Copyright
©The Author(s) 2003.
World J Gastroenterol. Jun 15, 2003; 9(6): 1231-1236
Published online Jun 15, 2003. doi: 10.3748/wjg.v9.i6.1231
Published online Jun 15, 2003. doi: 10.3748/wjg.v9.i6.1231
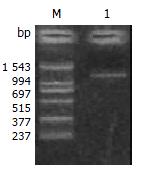
Figure 1 1% gelose electrophoretogram of the product of PCR (1030 bp).
M: PCR marker; 1: PCR procuct.
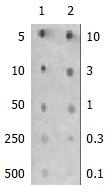
Figure 2 Blot hybridization of Dig-labeled probe to show the labeling efficiency.
Column 1: Dig-labeling probe; Column 2: standard control (unit: pg/μL).
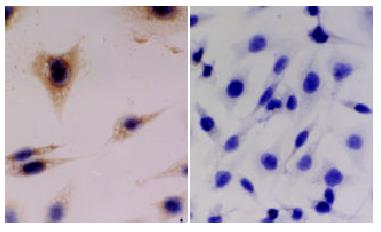
Figure 3 Expression of KAI1 in LoVo-KAI1 cell and LoVo-neo cell by in situ hybridization.
The left picture: Expression of LoVo-KAI1 cells (× 400) showed that the positive expression (brown granule) located in cytoplasm. The right picture: Expression of LoVo-neo cells (× 400) was negative.
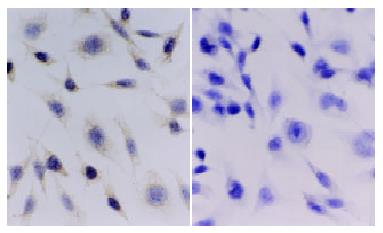
Figure 4 Expression of CD82 in LoVo-KAI1 cells and LoVo-neo cells by immunohistochemistry.
The left picture: Detection of LoVo-KAI1 cells (× 400) was positive, the cytoplasm and the membrane were stained brown. The right picture: Detection of LoVo-neo cells (× 400) was negative.
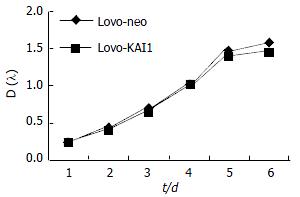
Figure 5 Growth curve of LoVo-KAI1 and LoVo-neo (P < 0.
05).
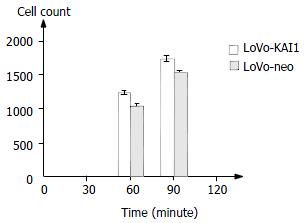
Figure 6 Adhesion of homotypic cells: The cell-cell adhesion ability in LoVo-KAI1 cells was significantly increased as compared with that of LoVo-neo cells (P < 0.
01).
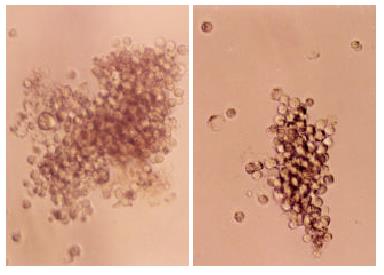
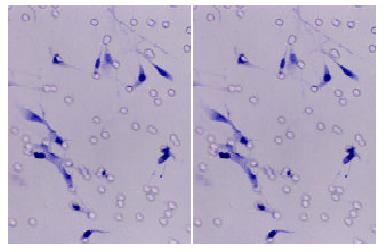
Figure 7 The cells aggregation pictures.
The left picture: The LoVo-KAI1 cells formed large multicellular aggregates. The rightpicture: The LoVo-neo cells formed smaller aggregates.
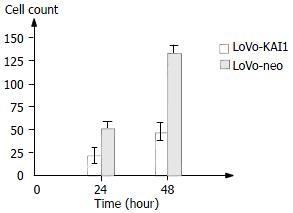
Figure 8 The invasion assay: The invasive number of LoVo-KAI1 cells was significantly reduced compared with that of LoVo-neo cells (P < 0.
01).
Figure 9 The invasion ability of LoVo-KAI1 cells and LoVo-neo cells by modified Boyden chamber.
The left picture: LoVo-KAI1 cell invasion picture (× 200). The right picture: LoVo-neo cell invasion picture (× 200).
- Citation: Liu L, Wu DH, Li ZG, Yang GZ, Ding YQ. Effects of KAI1/CD82 on biological behavior of human colorectal carcinoma cell line. World J Gastroenterol 2003; 9(6): 1231-1236
- URL: https://www.wjgnet.com/1007-9327/full/v9/i6/1231.htm
- DOI: https://dx.doi.org/10.3748/wjg.v9.i6.1231


