Copyright
©The Author(s) 2003.
World J Gastroenterol. May 15, 2003; 9(5): 936-940
Published online May 15, 2003. doi: 10.3748/wjg.v9.i5.936
Published online May 15, 2003. doi: 10.3748/wjg.v9.i5.936
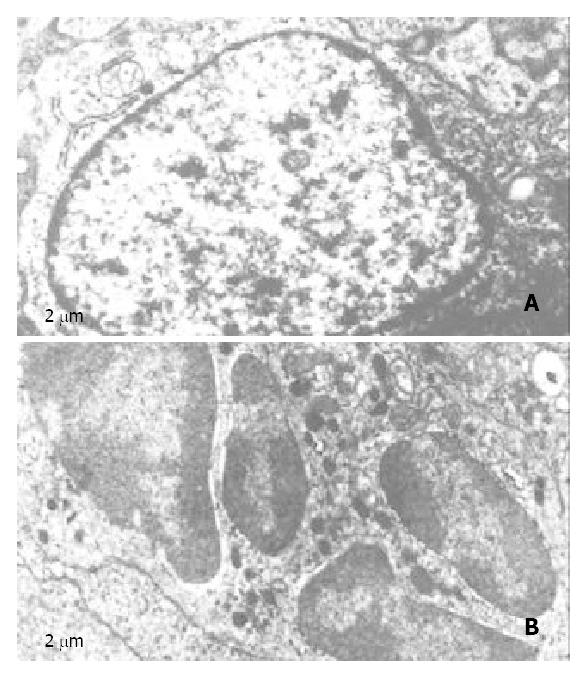
Figure 1 Electro micrographs of nimesulide plus 5-FU treated mice hepatoma.
A, control; B, nimesulide plus 5-FU.
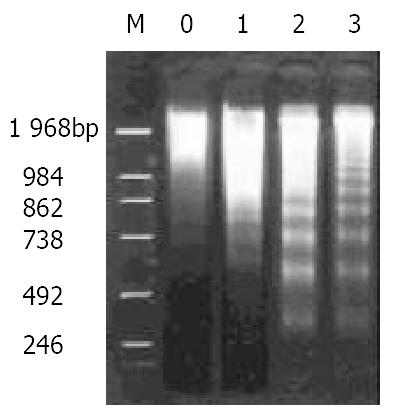
Figure 2 DNA ladder pattern of hepatoma tissues as demon-strated by agarose gel 1.
5% electrophoresis. M, DNA markers; lanes 0-3, control, nimesulide 20 mg/kg, 5-FU 20 mg/kg, nimesulide 20 mg/kg + 5-FU 10 mg/kg.
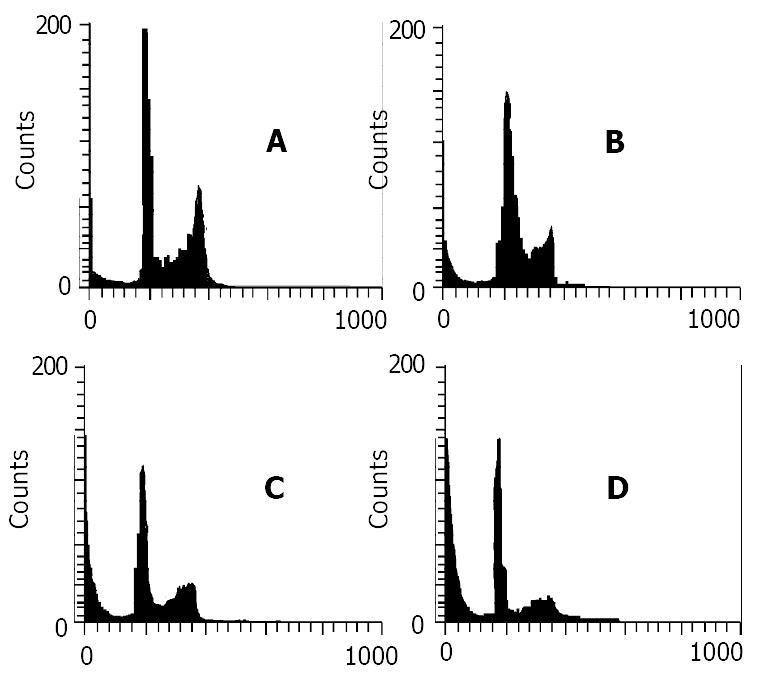
Figure 3 Data of flow cytometry of mouse hepatoma without any treatment as a control (A), or following 21 d treatment with nimesulide 20 mg/kg (B), 5-FU 20 mg/kg (C) and nimesulide 20 mg/kg + 5-FU 10 mg/kg (D).
The sub-G1 peak to the left of the G1 peak represents apoptotic cells.
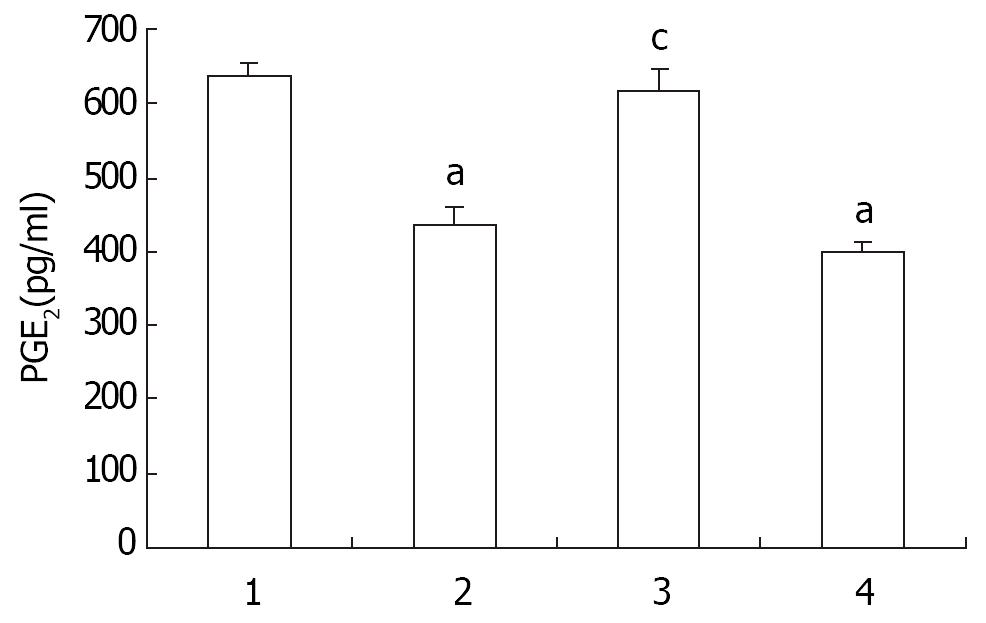
Figure 4 Effect of Nimesulide and 5-FU on PGE2 content in mouse hepatoma.
Each column is the mean ± SD of the sample. 1-4, control, nimesulide 20 mg/kg, 5-FU 20 mg/kg, and nimesulide 20 mg/kg + 5-FU 10 mg/kg. n = 3. -x±s. aP < 0.01 vs control, cP < 0.01 vs nimesulide + 5-FU.
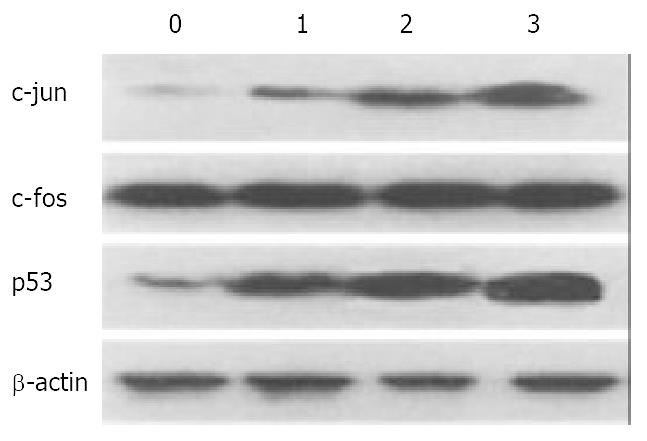
Figure 5 Effect of nimesulide and 5-FU on expression of c-fos, c-jun, and p53 in mouse hepatoma.
0-3, control, nimesulide 20 mg/kg, 5-FU 20 mg/kg, nimesulide 10 mg/kg + 5-Fu 10 mg/kg. The β-actin was used as an intrinsic reference molecule.
- Citation: Li XH, Li XK, Cai SH, Tang FX, Zhong XY, Ren XD. Synergistic effects of nimesulide and 5-fluorouracil on tumor growth and apoptosis in the implanted hepatoma in mice. World J Gastroenterol 2003; 9(5): 936-940
- URL: https://www.wjgnet.com/1007-9327/full/v9/i5/936.htm
- DOI: https://dx.doi.org/10.3748/wjg.v9.i5.936


