Copyright
©The Author(s) 2003.
World J Gastroenterol. May 15, 2003; 9(5): 921-929
Published online May 15, 2003. doi: 10.3748/wjg.v9.i5.921
Published online May 15, 2003. doi: 10.3748/wjg.v9.i5.921
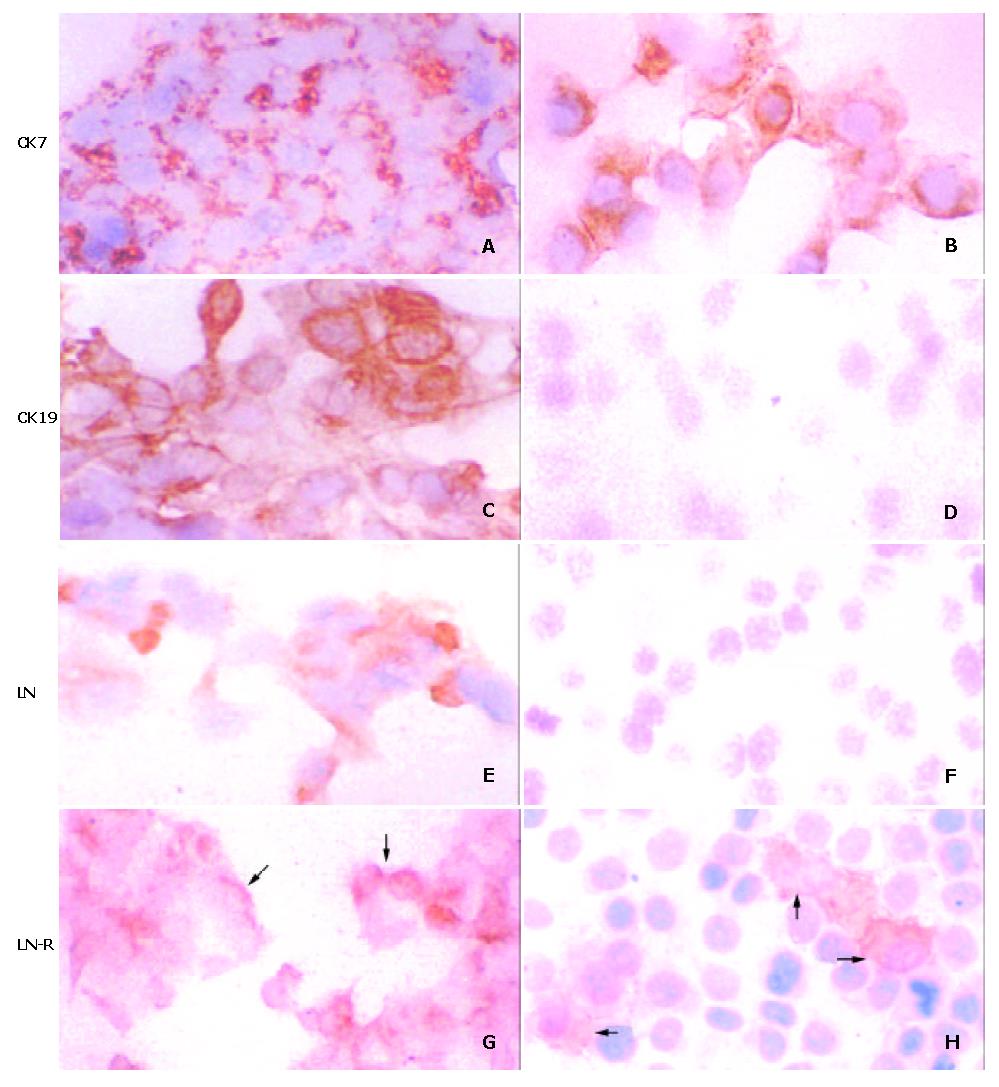
Figure 1 Expression of CK7 (A, B), CK19 (C, D), LN (E, F) and its receptor (LN-R, the reactivity denoted by arrows; G, H) in the representative HCC cell lines, HepG2 (A, C, E, G) and HCC-9724 (B, D, F, H).
Both CK19 and LN present in HepG2 (C and E) and absent in HCC-9724 (D and F). S-P reaction, slightly counterstained with hematoxylin. × 250.
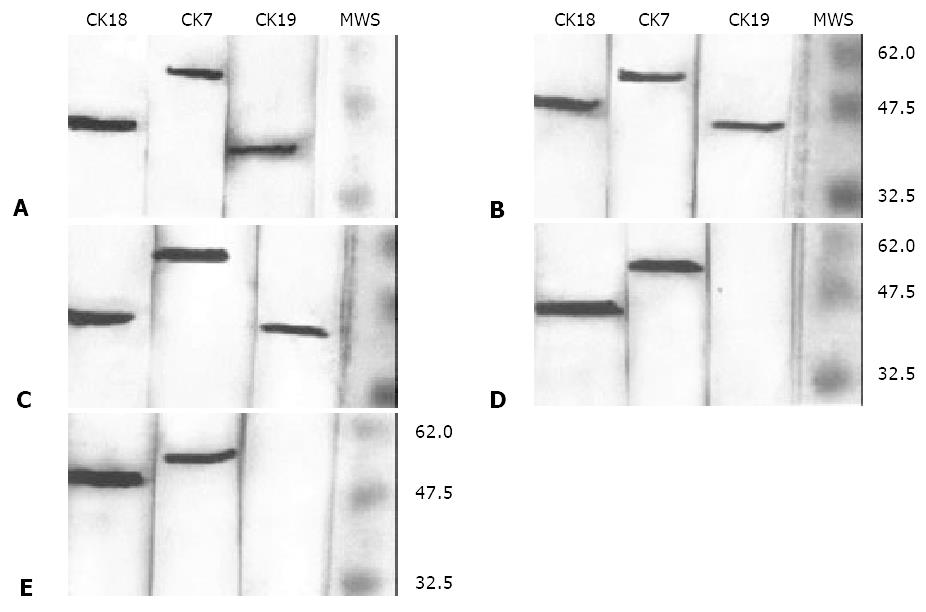
Figure 2 Western blotting for CK18, CK7 and CK19 using the intermediate filament cytoskeleton extracts from HCC cell lines SMMC7721 (A), HCC-9204 (B), HepG2 (C), HHCC (D) and HCC-9724 (E).
Immunoreactions were demonstrated by AP-labeled anti-mouse IgG and visualized in a BCIP/NBT solution. The right lanes show molecular weight standards (MWS) visualized by staining with Commassie R250, with three indicated by the short bars (from top to bottom, Mr62000, Mr47500 and Mr32500, respectively).
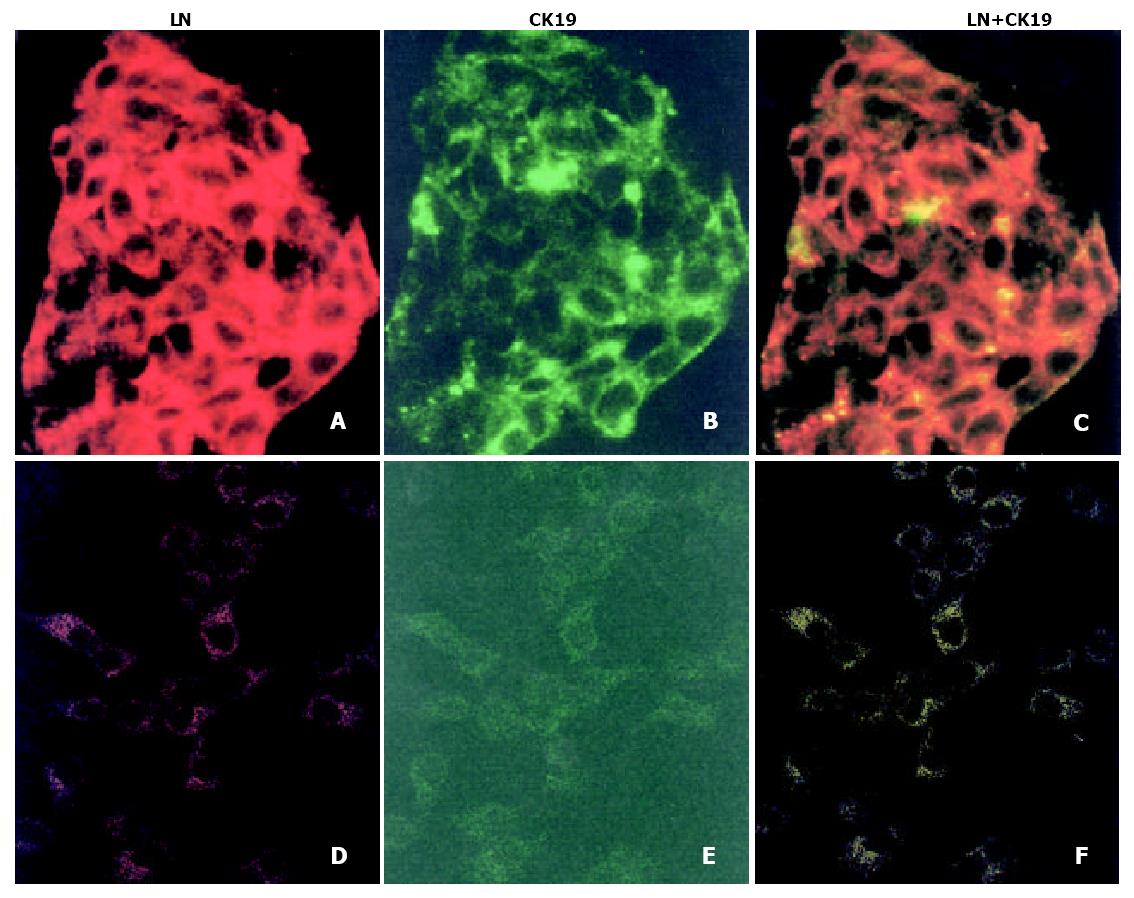
Figure 3 Double immunofluorescence reaction for LN (TRITC-labeled, red) and CK19 (FITC-labeled, green) in HCC cell lines HepG2 (A-C) and HCC-9724 (D-F) under a laser-scanning confocal microscope.
Definite signals for LN and CK19, frequently coexisting within cytoplasmic compartment (orange), were found only in the cell line HepG2. × 400.
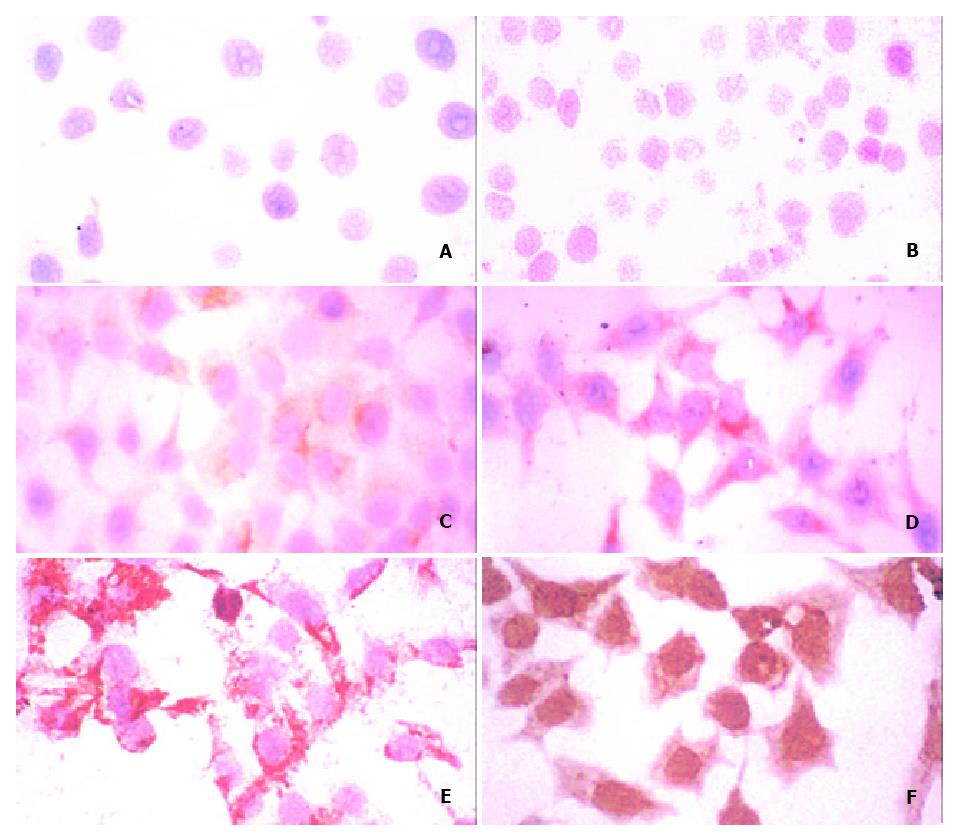
Figure 4 Induction test using the HCC cell line HCC-9724.
Cells were inoculated in RPMI1640 medium containing LN at concentrations of 2.5 (A), 5 (B), 10 (C), 20 (D), 40 (E) and 60 mg/L (F), respectively. CK19 expression was found in cells incubated with LN starting at a concentration of 10 mg/L (C), and increasing with LN concentrations (D-F). S-P reaction, slightly counterstained with hematoxylin. × 250.
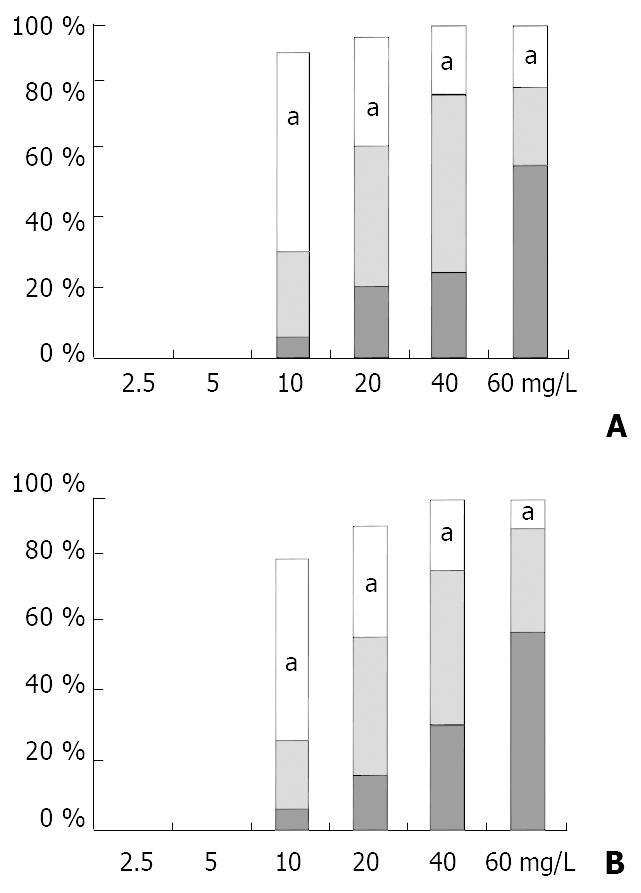
Figure 5 Induction of CK19 expression in HCC cell lines, HHCC (A) and HCC-9724 (B), by LN.
Concentrations of LN in culture medium ranging from 2.5 mg/L to 60 mg/L. Numbers of cells expressing CK19 were presented in percentages, and the expression levels indicated by column colors (white, +; gray, 2+; black, 3+). aP < 0.05 (compared to group on the left).
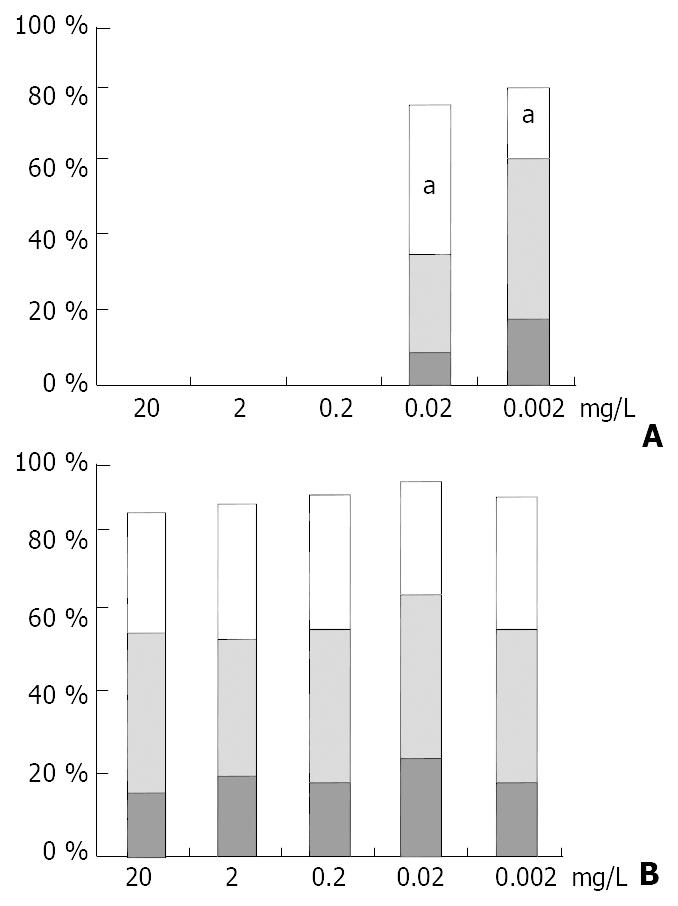
Figure 6 Blocking test of the CK19 expression in HHCC cells induced by exogenous LN.
A. CK19 expression completely blocked with concentration of the polyclonal anti-LN up to 0.2 mg/L in the LN-conditioned medium (20 mg/L). B. Addition of the same amount of normal rabbit IgG having no effect on the CK19 expression. Numbers of cells expressing CK19 presented in percentages, and CK19 expression levels indicated by column colors (white, +; gray, 2+; black, 3+). aP < 0.05 (compared to group on the left).
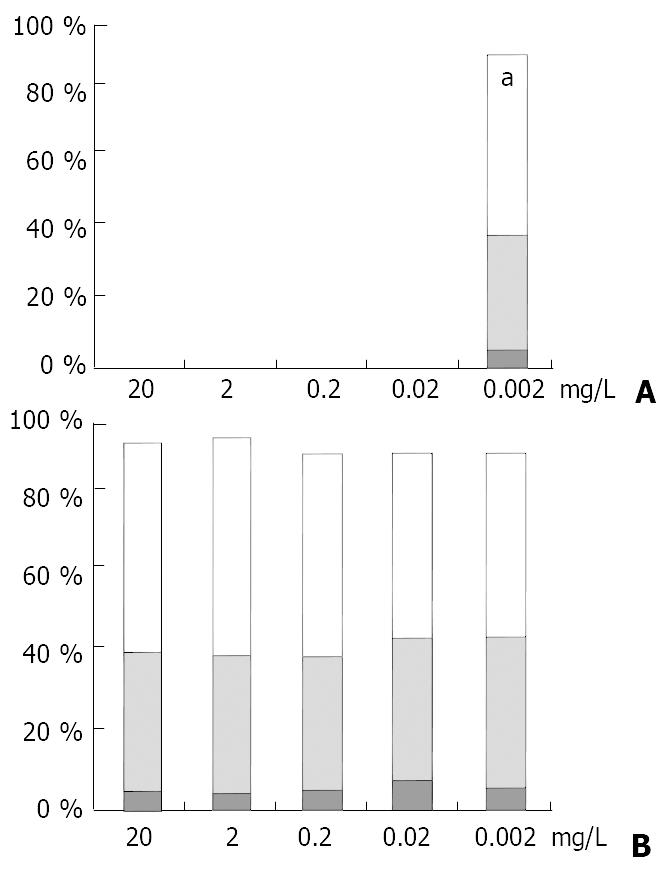
Figure 7 Blocking test of the CK19 expression in SMMC7721 cells associated with endogenous LN.
A. CK19 expression completely blocked with concentration of the polyclonal anti-LN up to 0.02 mg/L in the ordinary medium. B. Addition of the same amount of normal rabbit IgG having no effect on the CK19 expression. Numbers of cells expressing CK19 were presented in percentages, and CK19 expression levels indicated by column colors (white, +; gray, 2+; black, 3+). aP < 0.05 (compared to group on the left).
- Citation: Su Q, Fu Y, Liu YF, Zhang W, Liu J, Wang CM. Laminin induces the expression of cytokeratin 19 in hepatocellular carcinoma cells growing in culture. World J Gastroenterol 2003; 9(5): 921-929
- URL: https://www.wjgnet.com/1007-9327/full/v9/i5/921.htm
- DOI: https://dx.doi.org/10.3748/wjg.v9.i5.921


