Copyright
©The Author(s) 2003.
World J Gastroenterol. May 15, 2003; 9(5): 1072-1076
Published online May 15, 2003. doi: 10.3748/wjg.v9.i5.1072
Published online May 15, 2003. doi: 10.3748/wjg.v9.i5.1072
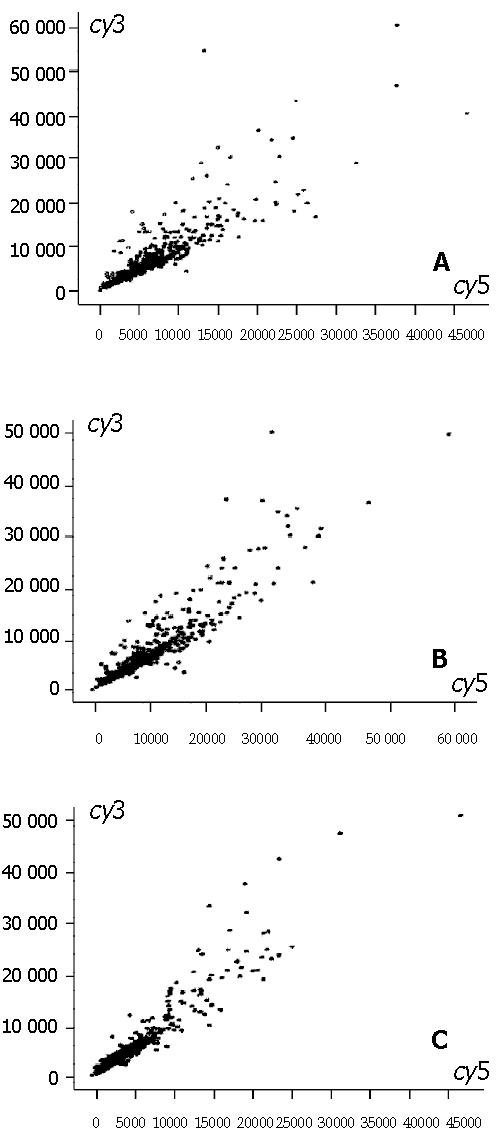
Figure 1 The scatter plots of gene expression pattern by cDNA microarray.
A: Model liver(Cy5)/normal liver(Cy3); B: Model+GdCl3 liver (Cy5)/normal liver; C: Mode+ASP liver (Cy5)/normal liver (Cy3). Ratio is Cy5/Cy3: high expression (ratio > 2.0), low expression (ratio < 0.5), no change in expression (0.5 < ratio < 2.0).
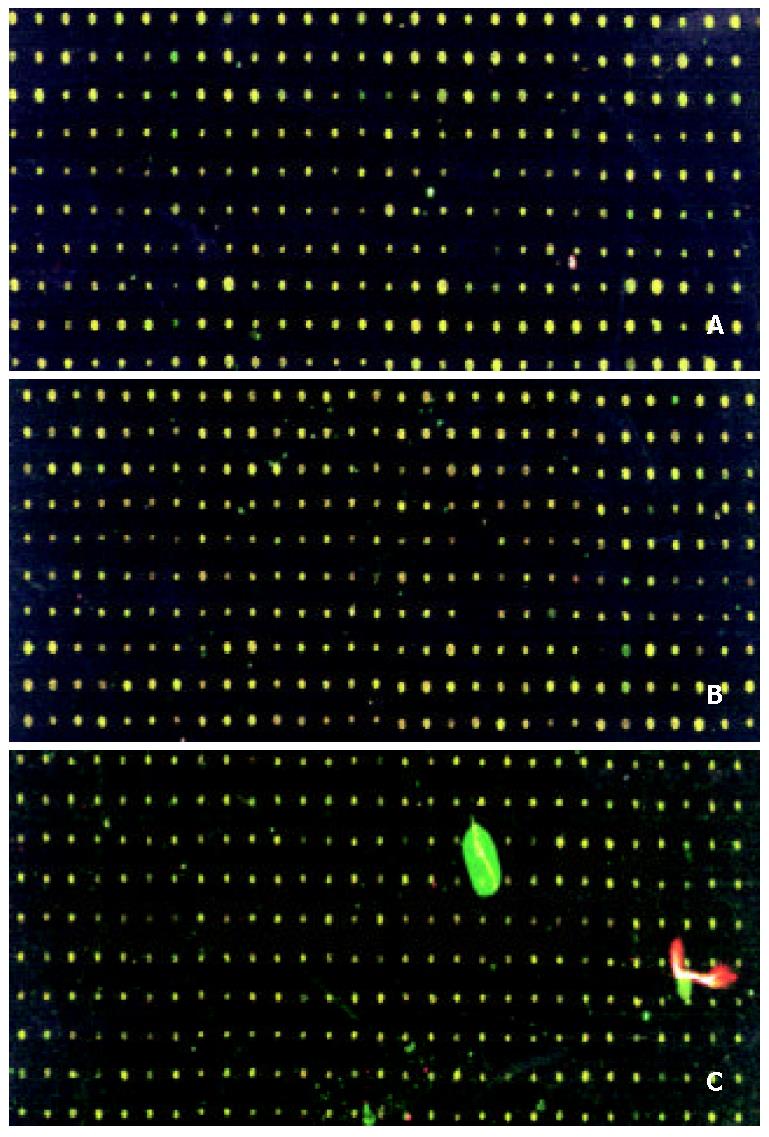
Figure 2 Scanning results of hybridizing signals by cDNA microarray.
A: Model liver(Cy5)/normal liver(Cy3); B: Model+GdCl3 liver (Cy5)/normal liver; C: Mode+ASP liver (Cy5)/normal liver (Cy3). Color of spots in the merged image of Cy3 image and Cy5 image: high expression (red), low ex-pression (green), no change in expression (yellow).
- Citation: Ding H, Shi GG, Yu X, Yu JP, Huang JA. Modulation of GdCl3 and Angelica Sinensis polysaccharides on differentially expressed genes in liver of hepatic immunological injury mice by cDNA microarray. World J Gastroenterol 2003; 9(5): 1072-1076
- URL: https://www.wjgnet.com/1007-9327/full/v9/i5/1072.htm
- DOI: https://dx.doi.org/10.3748/wjg.v9.i5.1072


