Copyright
©The Author(s) 2003.
World J Gastroenterol. May 15, 2003; 9(5): 1028-1033
Published online May 15, 2003. doi: 10.3748/wjg.v9.i5.1028
Published online May 15, 2003. doi: 10.3748/wjg.v9.i5.1028
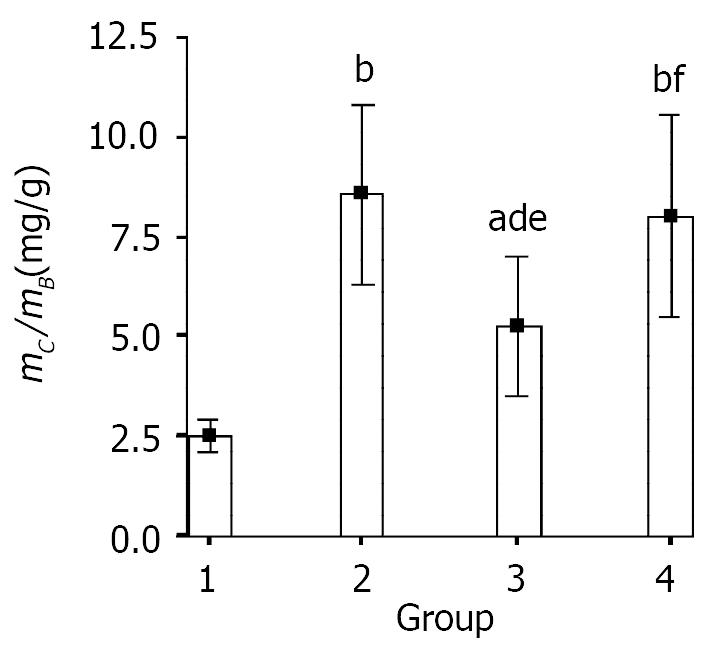
Figure 1 Effect of EA on mC/mB.
aP < 0.05, bP < 0.01 vs normal control; dP < 0.01, fP > 0.05 vs UC control; eP < 0.05 vs UC+EA at non-acupoint.
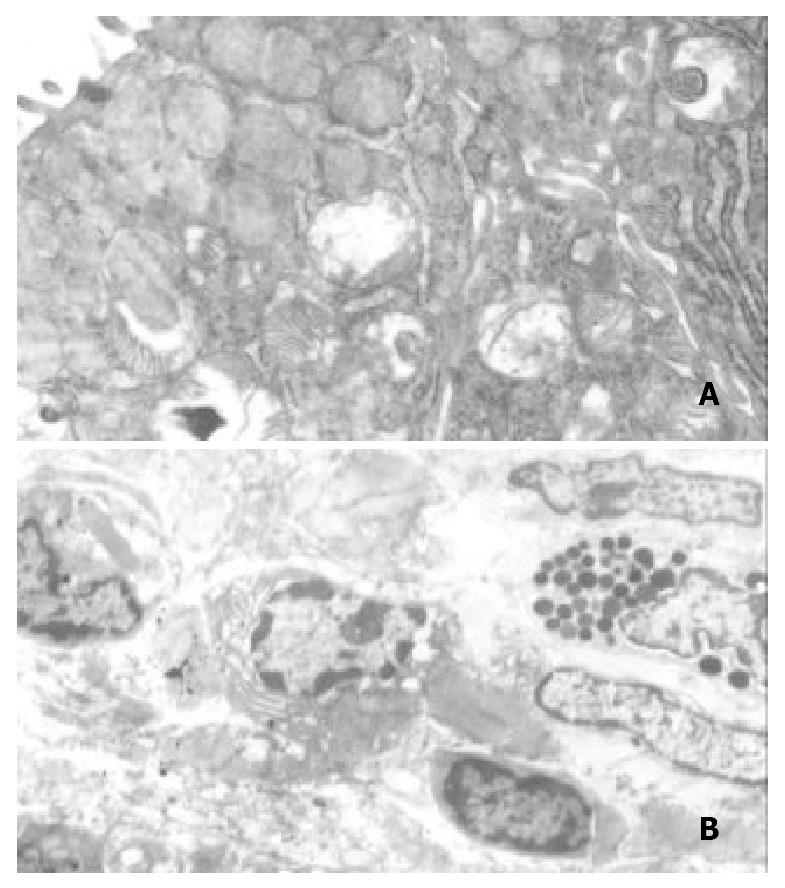
Figure 2 Colonic ultrastructure of UC control group: A, goblet cells, microvilli, endoplasmic reticula and mitochondria (TEM × 10000); B, inflammatory cells (TEM × 2500).
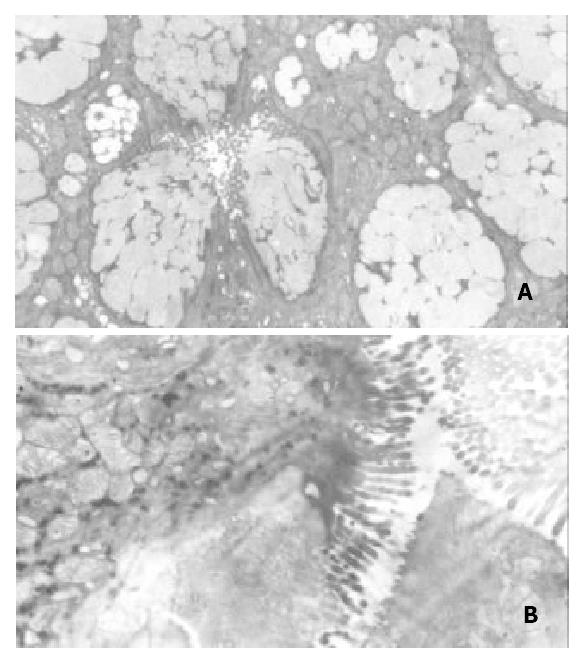
Figure 3 Colonic ultrastructure of UC+EA at ST36 group: A, goblet cells (TEM × 4000); B microvilli and mitochondria (TEM × 8000).
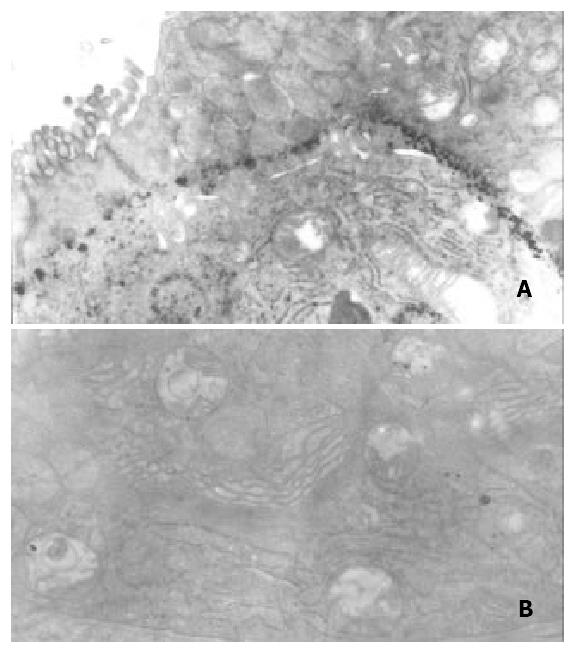
Figure 4 Colonic ultrastructure of EA+non-acupoint group: A, goblet cells, microvilli and mitochondria (TEM × 8000); B, endoplasmic reticula and mitochondria (TEM × 10000).
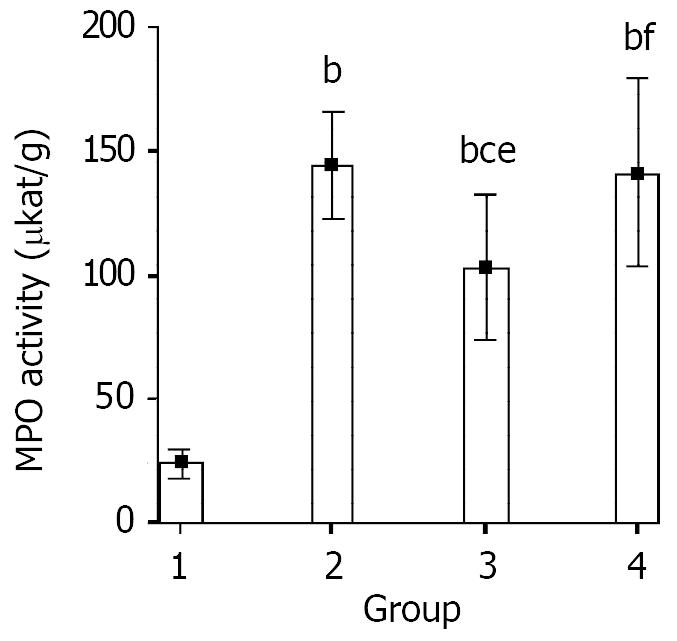
Figure 5 Effect of EA on colonic MPO activity.
bP < 0.01 vs normal control; cP < 0.05, fP > 0.05 vs UC control; eP < 0.05 vs UC+EA at non-acupoint.
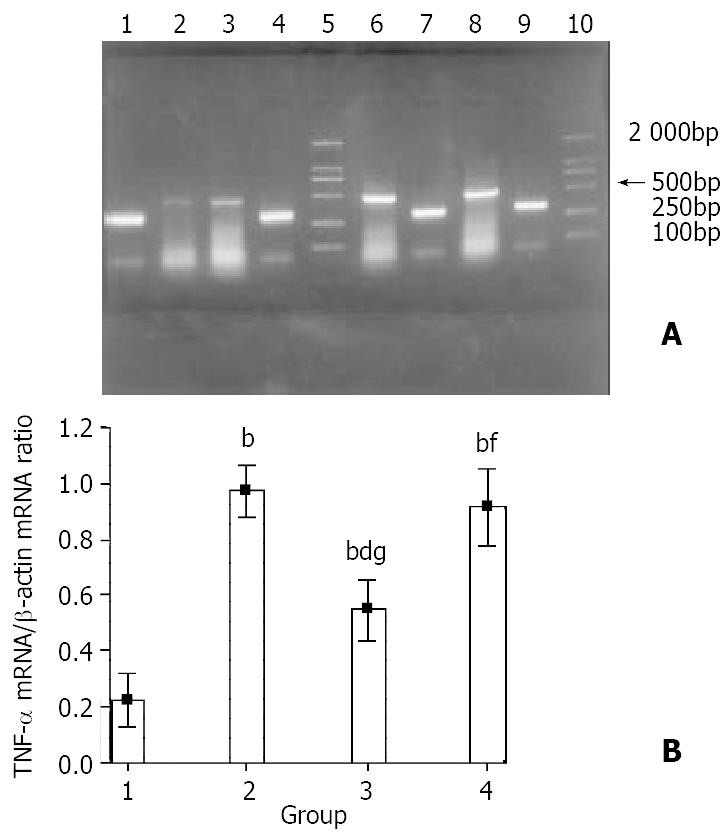
Figure 6 Effect of EA on TNF-α mRNA expression.
A: Repre-sentative pictures of RT-PCR. Lane 1, 4, 7, 9: β-actin. Lane 2, 3, 6, 8: TNF-α. Lane 5, 10: DNA Marker (DL2000). B: Relative level of TNF-α mRNA expression. bP < 0.01 vs normal control; dP < 0.01, fP > 0.05 vs UC control; gP < 0.01 vs UC+EA at non-acupoint.
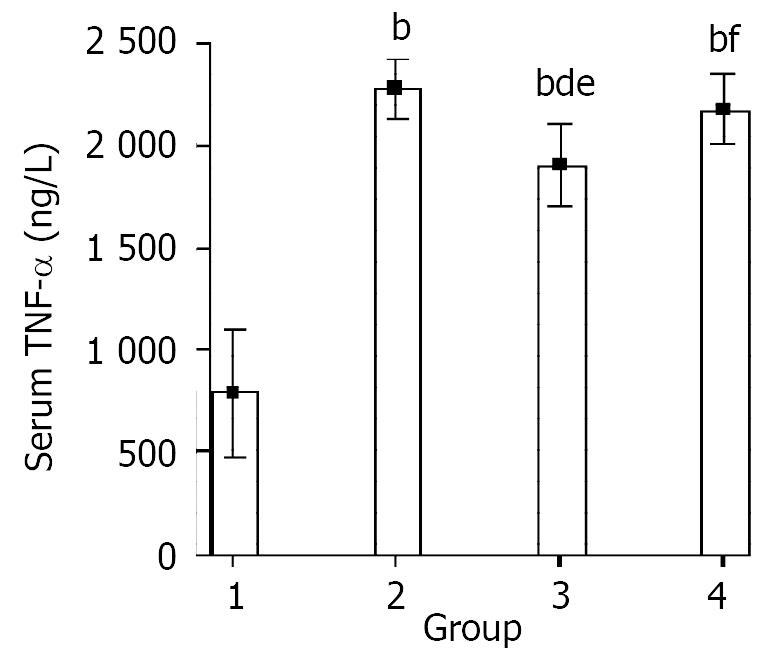
Figure 7 Effect of EA on serum TNF-α concentration.
bP < 0.01 vs normal control; dP < 0.01, fP > 0.05 vs UC control; eP < 0.05 vs UC+EA at non-acupoint.
- Citation: Tian L, Huang YX, Tian M, Gao W, Chang Q. Downregulation of electroacupuncture at ST36 on TNF-α in rats with ulcerative colitis. World J Gastroenterol 2003; 9(5): 1028-1033
- URL: https://www.wjgnet.com/1007-9327/full/v9/i5/1028.htm
- DOI: https://dx.doi.org/10.3748/wjg.v9.i5.1028


