Copyright
©The Author(s) 2003.
World J Gastroenterol. Nov 15, 2003; 9(11): 2528-2532
Published online Nov 15, 2003. doi: 10.3748/wjg.v9.i11.2528
Published online Nov 15, 2003. doi: 10.3748/wjg.v9.i11.2528
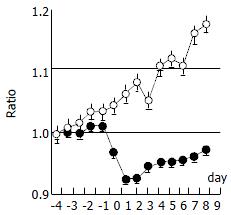
Figure 1 Body weight of experimental animals was significantly lower than that of controls (P < 0.
01), ○ controls, ● colitis.
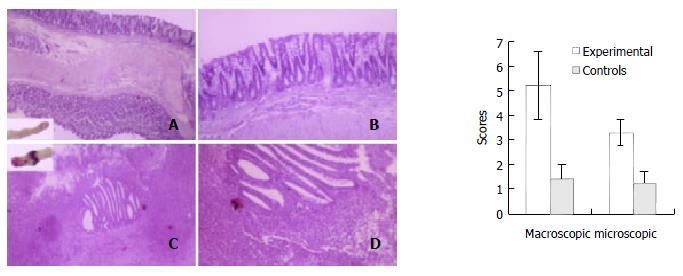
Figure 2 Left: Colon histological manifestation of experimental animals (C: 4 × 10, upper left is colon; D: 10 × 10) compared with controls (A: 4 × 10, lower left is colon; B: 10 × 10) (haematoxylin and eosin).
Right: Macroscopical and microscopical damage scores in experimental animals are higher than those in controls.
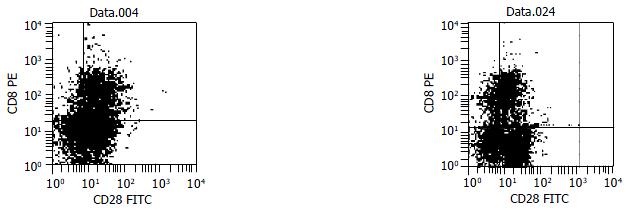
Figure 3 Flow cytometry shows the proportion of CD8+CD28- T regulatory cells was 12.
4% in experimental animals (right) and 4.9% in controls (left).
- Citation: Xiao WB, Liu YL. Changes of CD8+CD28- T regulatory cells in rat model of colitis induced by 2,4-dinitrofluorobenzene. World J Gastroenterol 2003; 9(11): 2528-2532
- URL: https://www.wjgnet.com/1007-9327/full/v9/i11/2528.htm
- DOI: https://dx.doi.org/10.3748/wjg.v9.i11.2528


