Copyright
©The Author(s) 2003.
World J Gastroenterol. Nov 15, 2003; 9(11): 2419-2423
Published online Nov 15, 2003. doi: 10.3748/wjg.v9.i11.2419
Published online Nov 15, 2003. doi: 10.3748/wjg.v9.i11.2419
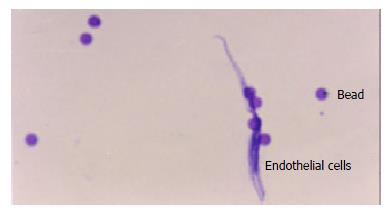
Figure 1 Endothelial cell attached with several beads.
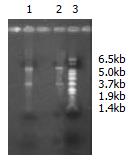
Figure 2 Lane 1, total RNA of stomach cancer.
Lane 2, total RNA of normal stomach tissue. Lane 3, marker.
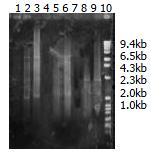
Figure 3 Lanes 1, 2, 3 demonstrate 21, 24, 27 PCR cycles of cDNA products of stomach cancer tissue.
Lanes 4, 5, 6 demonstrate 21, 24, 27 PCR cycles of cDNA products of normal stomach tissue. Lanes 7, 8, 9 demonstrate 15, 18, 21 PCR cycles of cDNA products of placental tissue. Lane 10, marker.
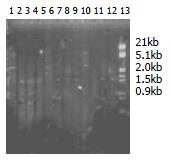
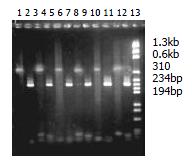
Figure 4 Lanes 1, 2, 3, 4: sampleI.
Lanes 5, 6, 7, 8: sampleII. Lanes 9, 10, 11, 12: sample III. Lane 13, marker. Lanes 1, 5, 9: cDNA undigested. Lanes 2, 6, 10: cDNA digested for 1 h. Lanes 3, 7, 11: cDNA digested for 3 h. Lanes 4, 8, 12: cDNA digested for 3.5 h.
Figure 5 Lanes 1, 2, 3, 4: sampleI.
Lanes 5, 6, 7, 8: sample II. Lanes 9, 10, 11, 12: sample III. Lane 13, marker. Lanes 1, 5, 9: PCR products using cDNA ligated Adaptor 1 as model, and G3PDH 3’primer and PCR Primer 1. Lanes 2, 6, 10: PCR products using cDNA ligated Adaptor 1 as model, and G3PDH 3’pmer and G3PDH 5’per; Lanes 3, 7, 11: PCR products using cDNA ligated Adaptor 2 as model, and G3PDH 3’primer and primer 1. Lanes 4, 8, 12: PCR products using cDNA ligatefd Adaptor 2 as model, and G3PDH 3’primer and G3PDH 5’primer.
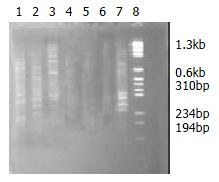
Figure 6 Lanes 1, 2, 3 indicated subtracted samples I, II, III.
Lanes 4, 5, 6 indicated unsubtracted sample I, II, III. Lane 7 showed the subtracted control provided by the kit. Lane 8: Marker.
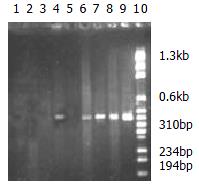
Figure 7 Lanes 1, 2, 3, 4 indicated the subtracted sample I was amplified by PCR wth different cycles: 18, 23, 28, 33.
Lanes 6, 7, 8, 9 indicated the unsubtracted sample I was amplified by PCR wth different cycles: 18, 23, 28, 33. Lane 10: Marker.
- Citation: Liu YB, Wei ZX, Li L, Li HS, Chen H, Li XW. Construction and analysis of SSH cDNA library of human vascular endothelial cells related to gastrocarcinoma. World J Gastroenterol 2003; 9(11): 2419-2423
- URL: https://www.wjgnet.com/1007-9327/full/v9/i11/2419.htm
- DOI: https://dx.doi.org/10.3748/wjg.v9.i11.2419


