Copyright
©The Author(s) 2002.
World J Gastroenterol. Oct 15, 2002; 8(5): 847-852
Published online Oct 15, 2002. doi: 10.3748/wjg.v8.i5.847
Published online Oct 15, 2002. doi: 10.3748/wjg.v8.i5.847
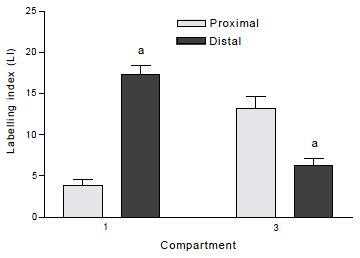
Figure 1 Labelling indices of compartment 1 and compartment 3 in proximal and distal colon of normal rats.
aP < 0.0001 when distal is compared to proximal colon in the same compartment. Values are mean ± SEM.
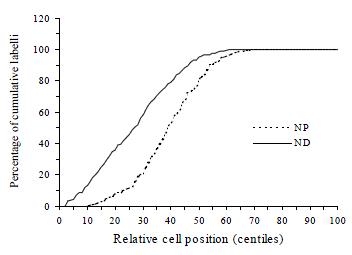
Figure 2 The different patterns of cumulative labelling distributions in proximal (NP) and distal (ND) rat colon of normal controls.
The curve is significantly shifted towards the right when the proximal colon is compared to distal colon.
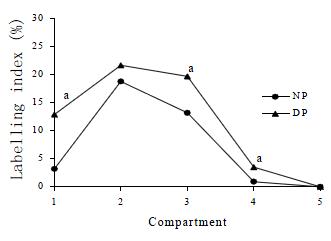
Figure 3 Labelling indices of normal proximal colon (NP) and DMH proximal colon (DP) for the 5 compartments.
aP < 0.0001 when labelling indices in the compartments of DMH proximal colons were compared to those found in normal proximal colons in the same compartments.
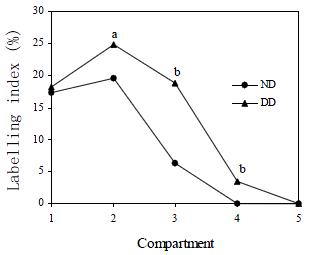
Figure 4 Labelling indices of normal distal colon (ND) and DMH distal colon (DD) for the 5 compartments.
aP < 0.05, bP < 0.0001 when labelling indices in the compartments of DMH distal colons were compared to those found in normal distal colons in the same compartments.
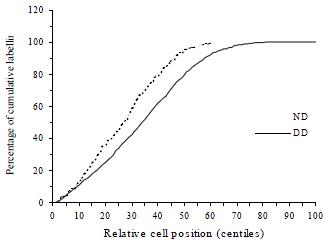
Figure 5 Cumulative labelling distribution in normal (ND) and DMH distal (DD) rat colon.
The curve is significantly shifted towards the right in DMH distal colon compared to normal distal colon.
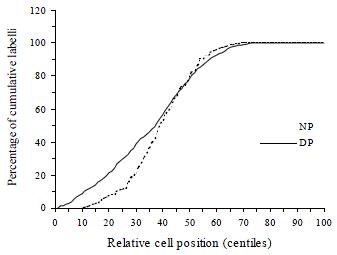
Figure 6 Cumulative labelling distribution in normal (NP) and DMH proximal (DP) rat colon.
The curve of DMH treated proximal rat colon is initially significantly shifted towards the left and then in the higher centiles shifted to the right.
- Citation: Ma QY, Williamson KE, Rowlands BJ. Variability of cell proliferation in the proximal and distal colon of normal rats and rats with dimethylhydrazine induced carcinogenesis. World J Gastroenterol 2002; 8(5): 847-852
- URL: https://www.wjgnet.com/1007-9327/full/v8/i5/847.htm
- DOI: https://dx.doi.org/10.3748/wjg.v8.i5.847


