Copyright
©The Author(s) 2002.
World J Gastroenterol. Oct 15, 2002; 8(5): 841-846
Published online Oct 15, 2002. doi: 10.3748/wjg.v8.i5.841
Published online Oct 15, 2002. doi: 10.3748/wjg.v8.i5.841
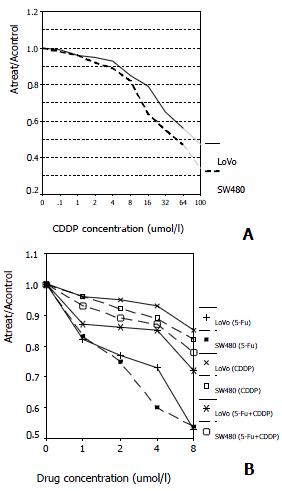
Figure 1 Comparison of sensitivity to 5-FU, CDDP or combination therapy in LoVo cells and SW480 cells.
(A) SW480 cells show increased sensitivity to CDDP than LoVo cells at the concentrations above 16 μmol/L (Ratio of absorption is 0.64 and 0.79 at 16 μmol/L, respectively; P < 0.01). (B) The dose-effect curve tells that the cytotoxicity diminishes in combination therapy of 5-FU and CDDP in both cell lines when compared with 5-FU single-therapy (Ratio of absorption in LoVo + 5-FU, SW480 + 5-FU, LoVo + 5-FU + CDDP and SW480 + 5-FU + CDDP is 0.53, 0.54, 0.72, 0.78, respectively; P < 0.01).
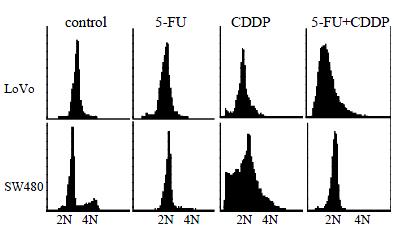
Figure 2 DNA content distribution of LoVo and SW480 cells after 48 h exposure to 5-FU and/or CDDP.
5-FU causes a more apparent increase of the proportion of hypo diploid DNA cells in LoVo than in SW480. CDDP renders an apparent increase of the hypodiploid DNA cells in both cell lines, but SW480 has more than LoVo cells. Few hypodiploid DNA cells are observed in combination of 5-FU and CDDP treatment.
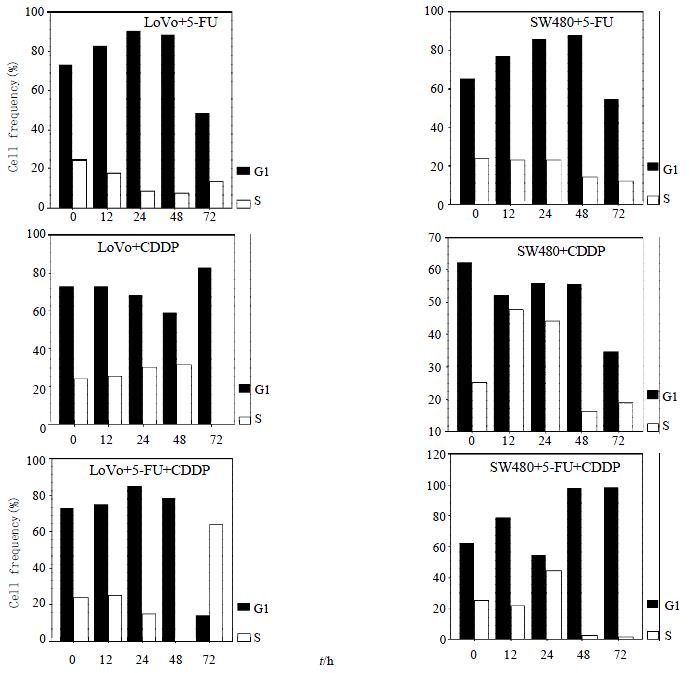
Figure 3 Hypodiploid DNA induced by 5-FU, CDDP or a combination therapy in LoVo cells and SW480 cells.
LoVo cells treated with 5-FU show an earlier presence and higher percentage of cells with hypodiploid DNA. B When exposed to CDDP, SW480 cells showed a more dramatic increase in presence of hypodiploid DNA than LoVo cells after 48 h. C When the two cell lines were exposed to 5-FU in combination with CDDP, SW480 cells have an 18% hypodiploid DNA, but not in LoVo cells in 96 h after treatment.
Figure 4 Effects on cell cycle distribution of LoVo cells & SW480 cells treated with5-FU, CDDP or combination therapy.
Both cell lines show an accumulation of G1-phase exposed to5-FU. On the contrary, CDDP mainly renders an accumulation of S-phase. Percentage of G1-and S-phase dominates alternatively in both lines treated with combination of 5-FU and CDDP.
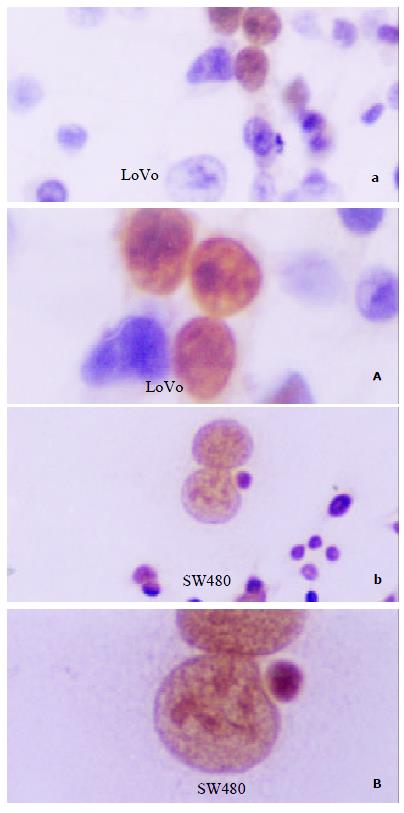
Figure 5 P53 staining with the anti-P53 mAb Do-7 in LoVo and SW480 cells.
(a, b × 100; A, B × 200)
- Citation: Chen XX, Lai MD, Zhang YL, Huang Q. Less cytotoxicity to combination therapy of 5-fluorouracil and cisplatin than 5-fluorouracil alone in human colon cancer cell lines. World J Gastroenterol 2002; 8(5): 841-846
- URL: https://www.wjgnet.com/1007-9327/full/v8/i5/841.htm
- DOI: https://dx.doi.org/10.3748/wjg.v8.i5.841


