Copyright
©The Author(s) 2001.
World J Gastroenterol. Oct 15, 2001; 7(5): 690-694
Published online Oct 15, 2001. doi: 10.3748/wjg.v7.i5.690
Published online Oct 15, 2001. doi: 10.3748/wjg.v7.i5.690
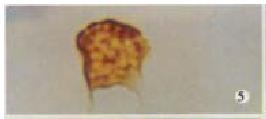
Figure 5 The expression of CD80 in DC, being brown yellow, 3.
3 × 100
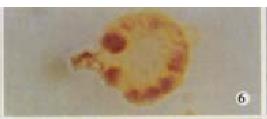
Figure 6 The expression of CD86 in DC, being brown yellow, 3.
3 × 100
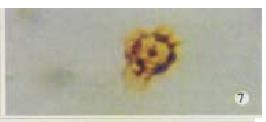
Figure 7 The expression of CD54 in DC, being brown yellow, 3.
3 × 100
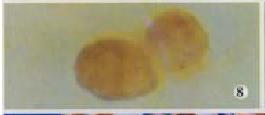
Figure 8 The expression of CD80 in DC-H22, being brown yellow, 3.
3 × 100
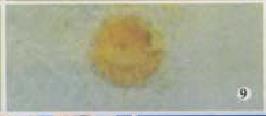
Figure 9 The expression of CD86 in DC-H22, being brown yellow, 3.
3 × 100
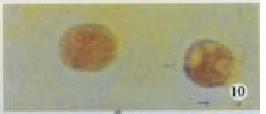
Figure 10 The expression of CD54 in DC-H22, being brown yellow, 3.
3 × 100
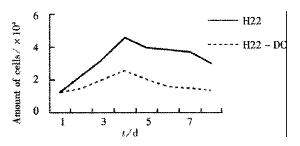
Figure 1 H22-DC growth curve.
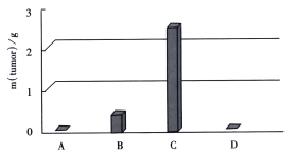
Figure 2 Tumor mass of BALB/c mice on d14 after inoculation.
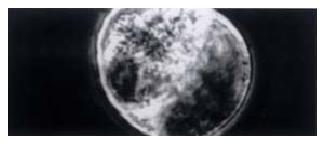
Figure 4 H22-DC fusion cells under phase microscope.
5 × 40
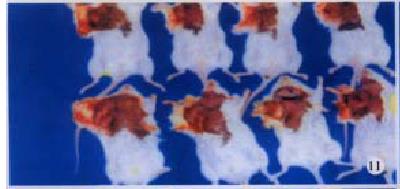
Figure 11 Tumorigenecity assays in BALB/c mice on d 14 following DC-H22 inoculation.
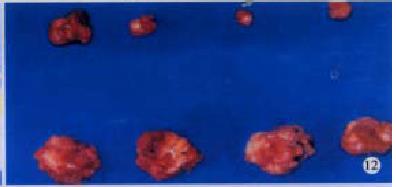
Figure 12 Tumorigenecity assays in BALB/c mice on d 14 following DC-H22 inoculation.
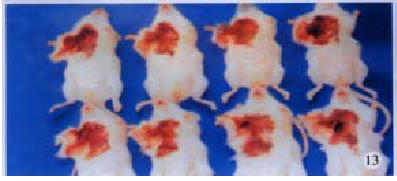
Figure 13 Tumorigenecity assays in BALB/c mice on d 14 following DC-H22 inoculation.
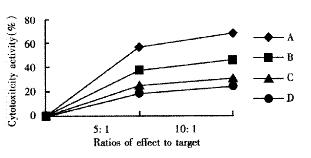
Figure 3 Influence on CTL cells of kill activity in vitro on d10 after inoculation.
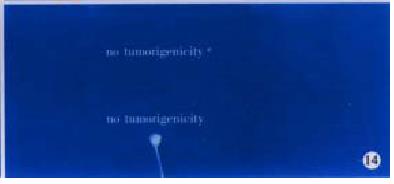
Figure 14 Tumorigenecity assays in BALB/c mice on d 14 following DC-H22 inoculation.
- Citation: Zhang J, Zhang JK, Zhuo SH, Chen HB. Effect of a cancer vaccine prepared by fusions of hepatocarcinoma cells with dendritic cells. World J Gastroenterol 2001; 7(5): 690-694
- URL: https://www.wjgnet.com/1007-9327/full/v7/i5/690.htm
- DOI: https://dx.doi.org/10.3748/wjg.v7.i5.690


