
















Copyright: ©Author(s) 2026.
World J Gastroenterol. Jan 21, 2027; 33(3): 124159
Published online Jan 21, 2027. doi: 10.3748/wjg.124159
Published online Jan 21, 2027. doi: 10.3748/wjg.124159
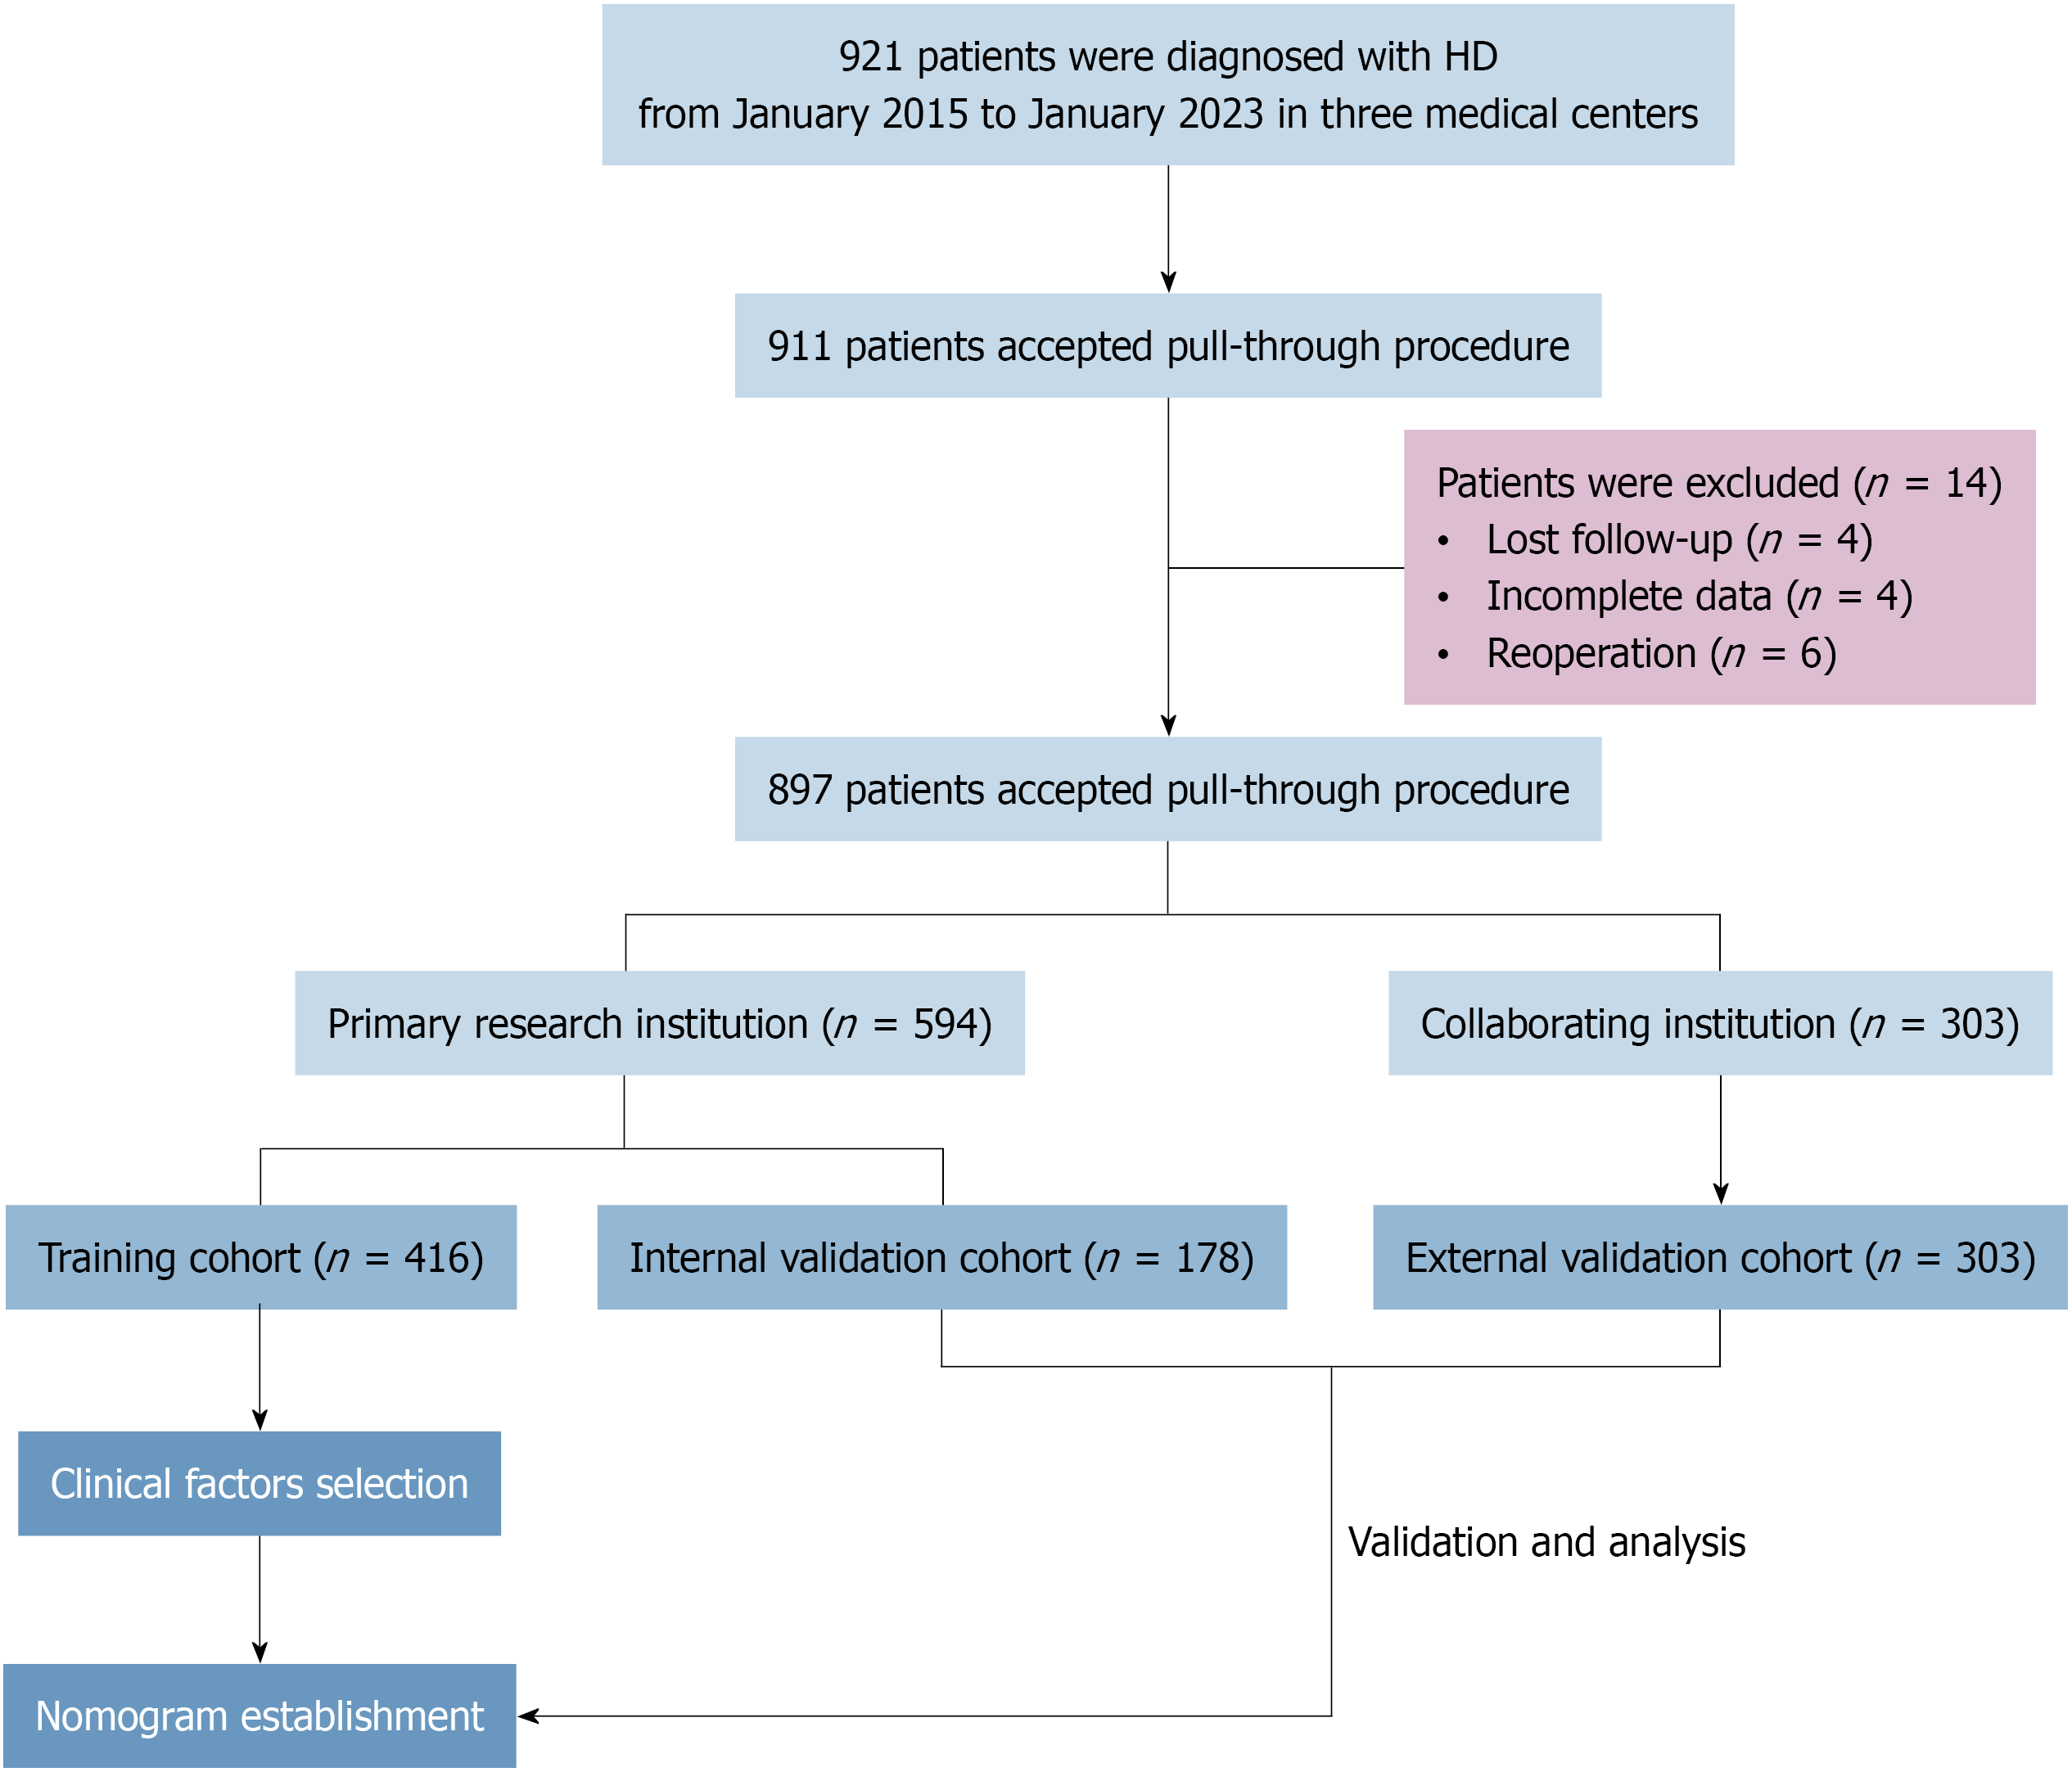
Figure 1 The work flow of this study.
HD: Hirschsprung disease.
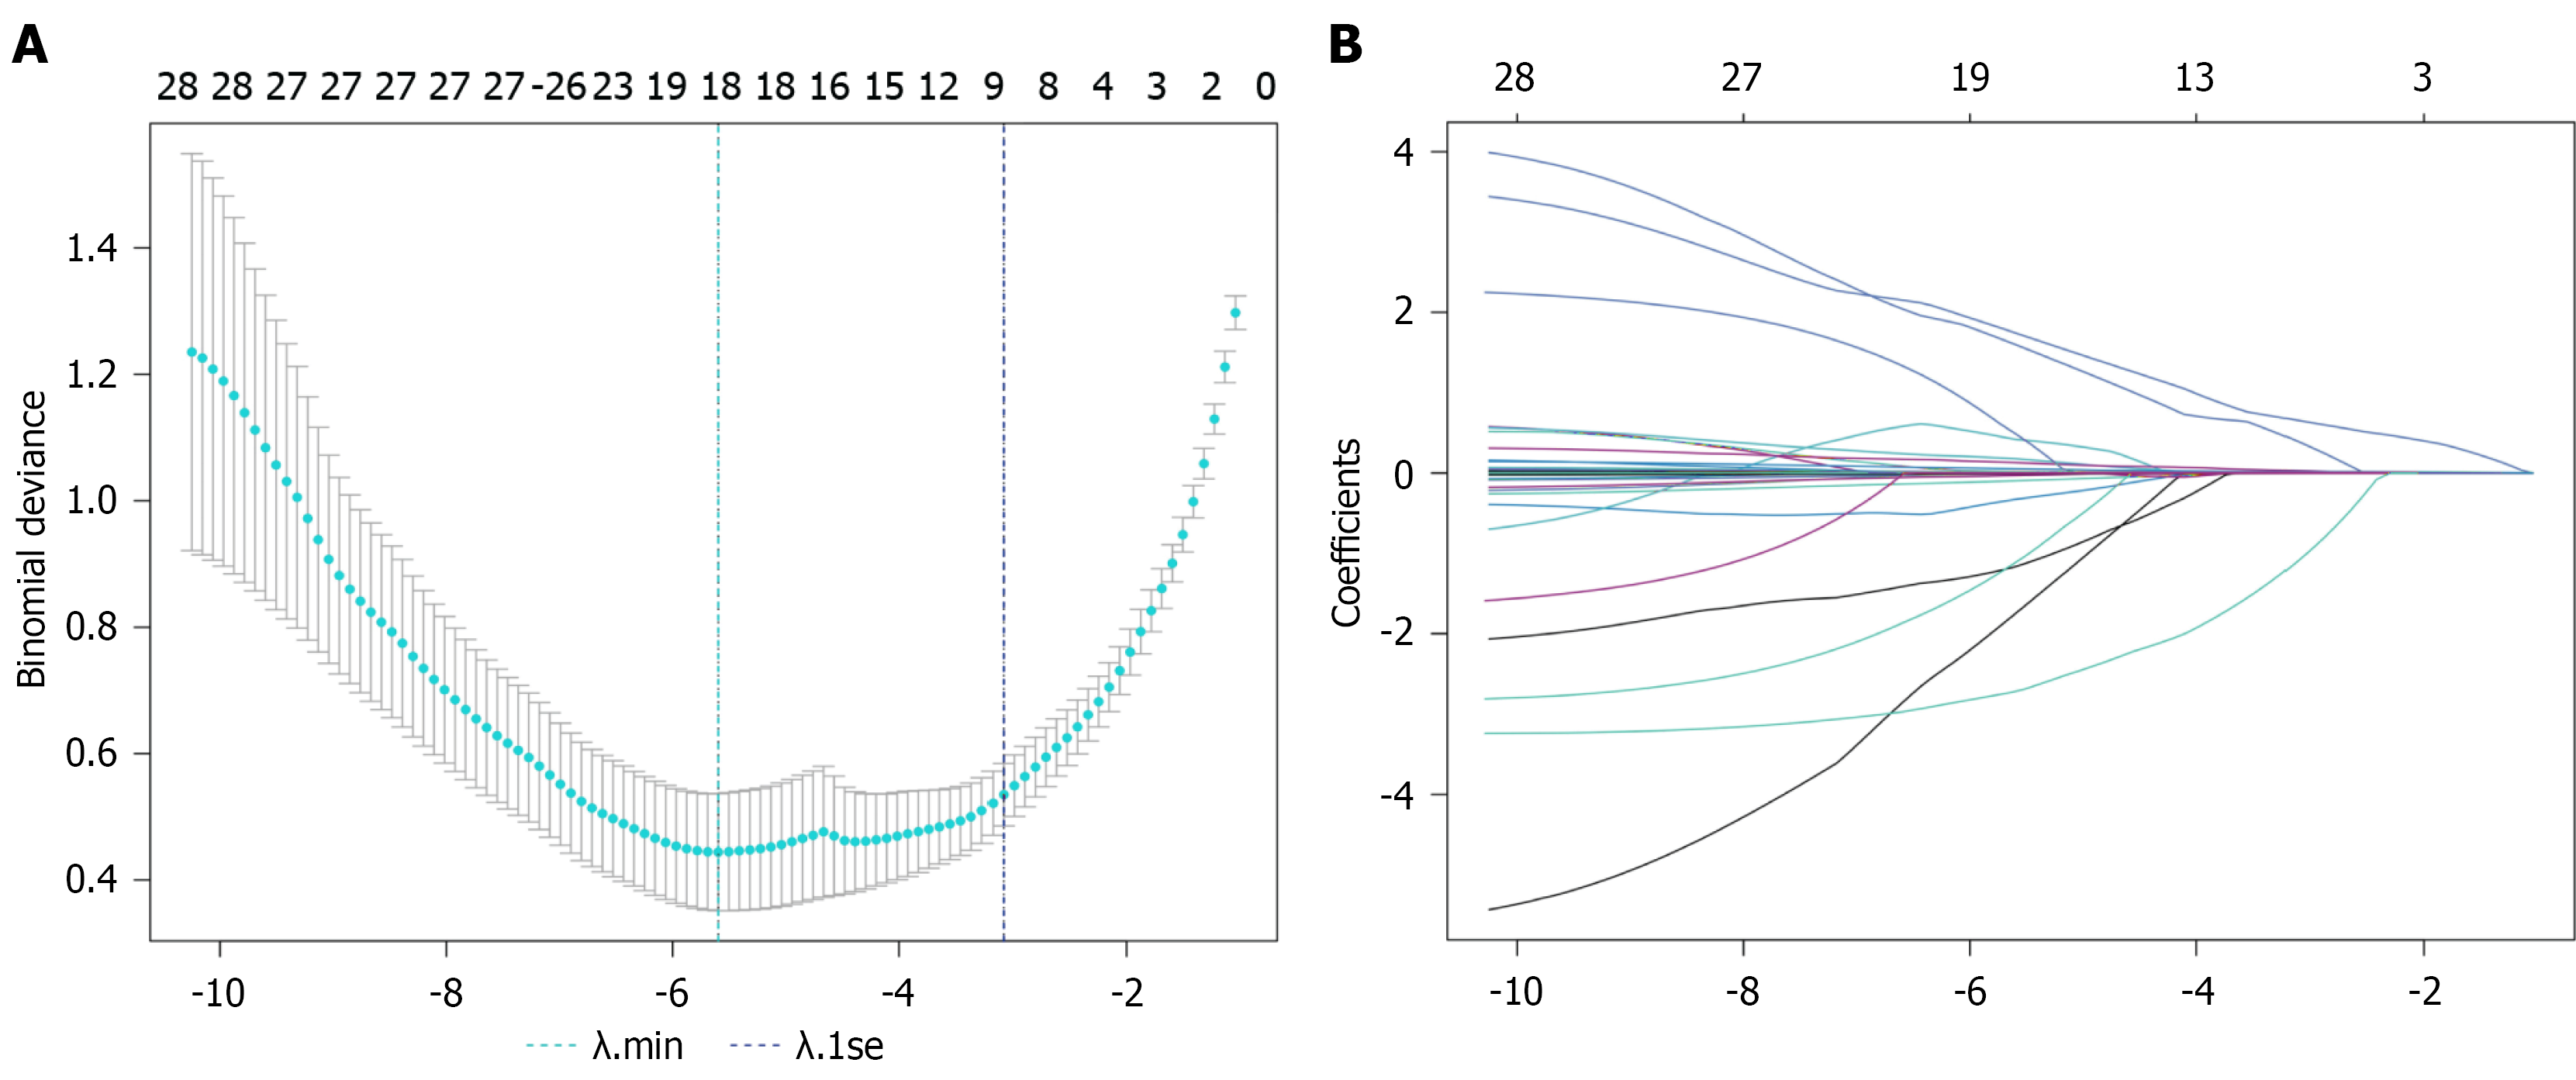
Figure 2 Feature variable selection using least absolute shrinkage and selection operator regression in the Training cohort.
A: The Y-axis shows binomial deviance, the lower X-axis shows log(λ), and the upper X-axis indicates the number of non-zero coefficients. The left dashed vertical line marks lambda.min (λ = 0.037), the value that minimizes deviance; the right dashed line marks lambda.1se (λ = 7.94 × 10⁻⁴), selected by the one-standard-error rule; B: A least absolute shrinkage and selection operator coefficient profile of all feature variables against the log(λ) sequence is shown. The blue dotted vertical lines indicate, respectively, the log(λmin) and log(λ 1se). The resulting eight predictors with non-zero coefficients were identified based on the log(λ 1se) value.
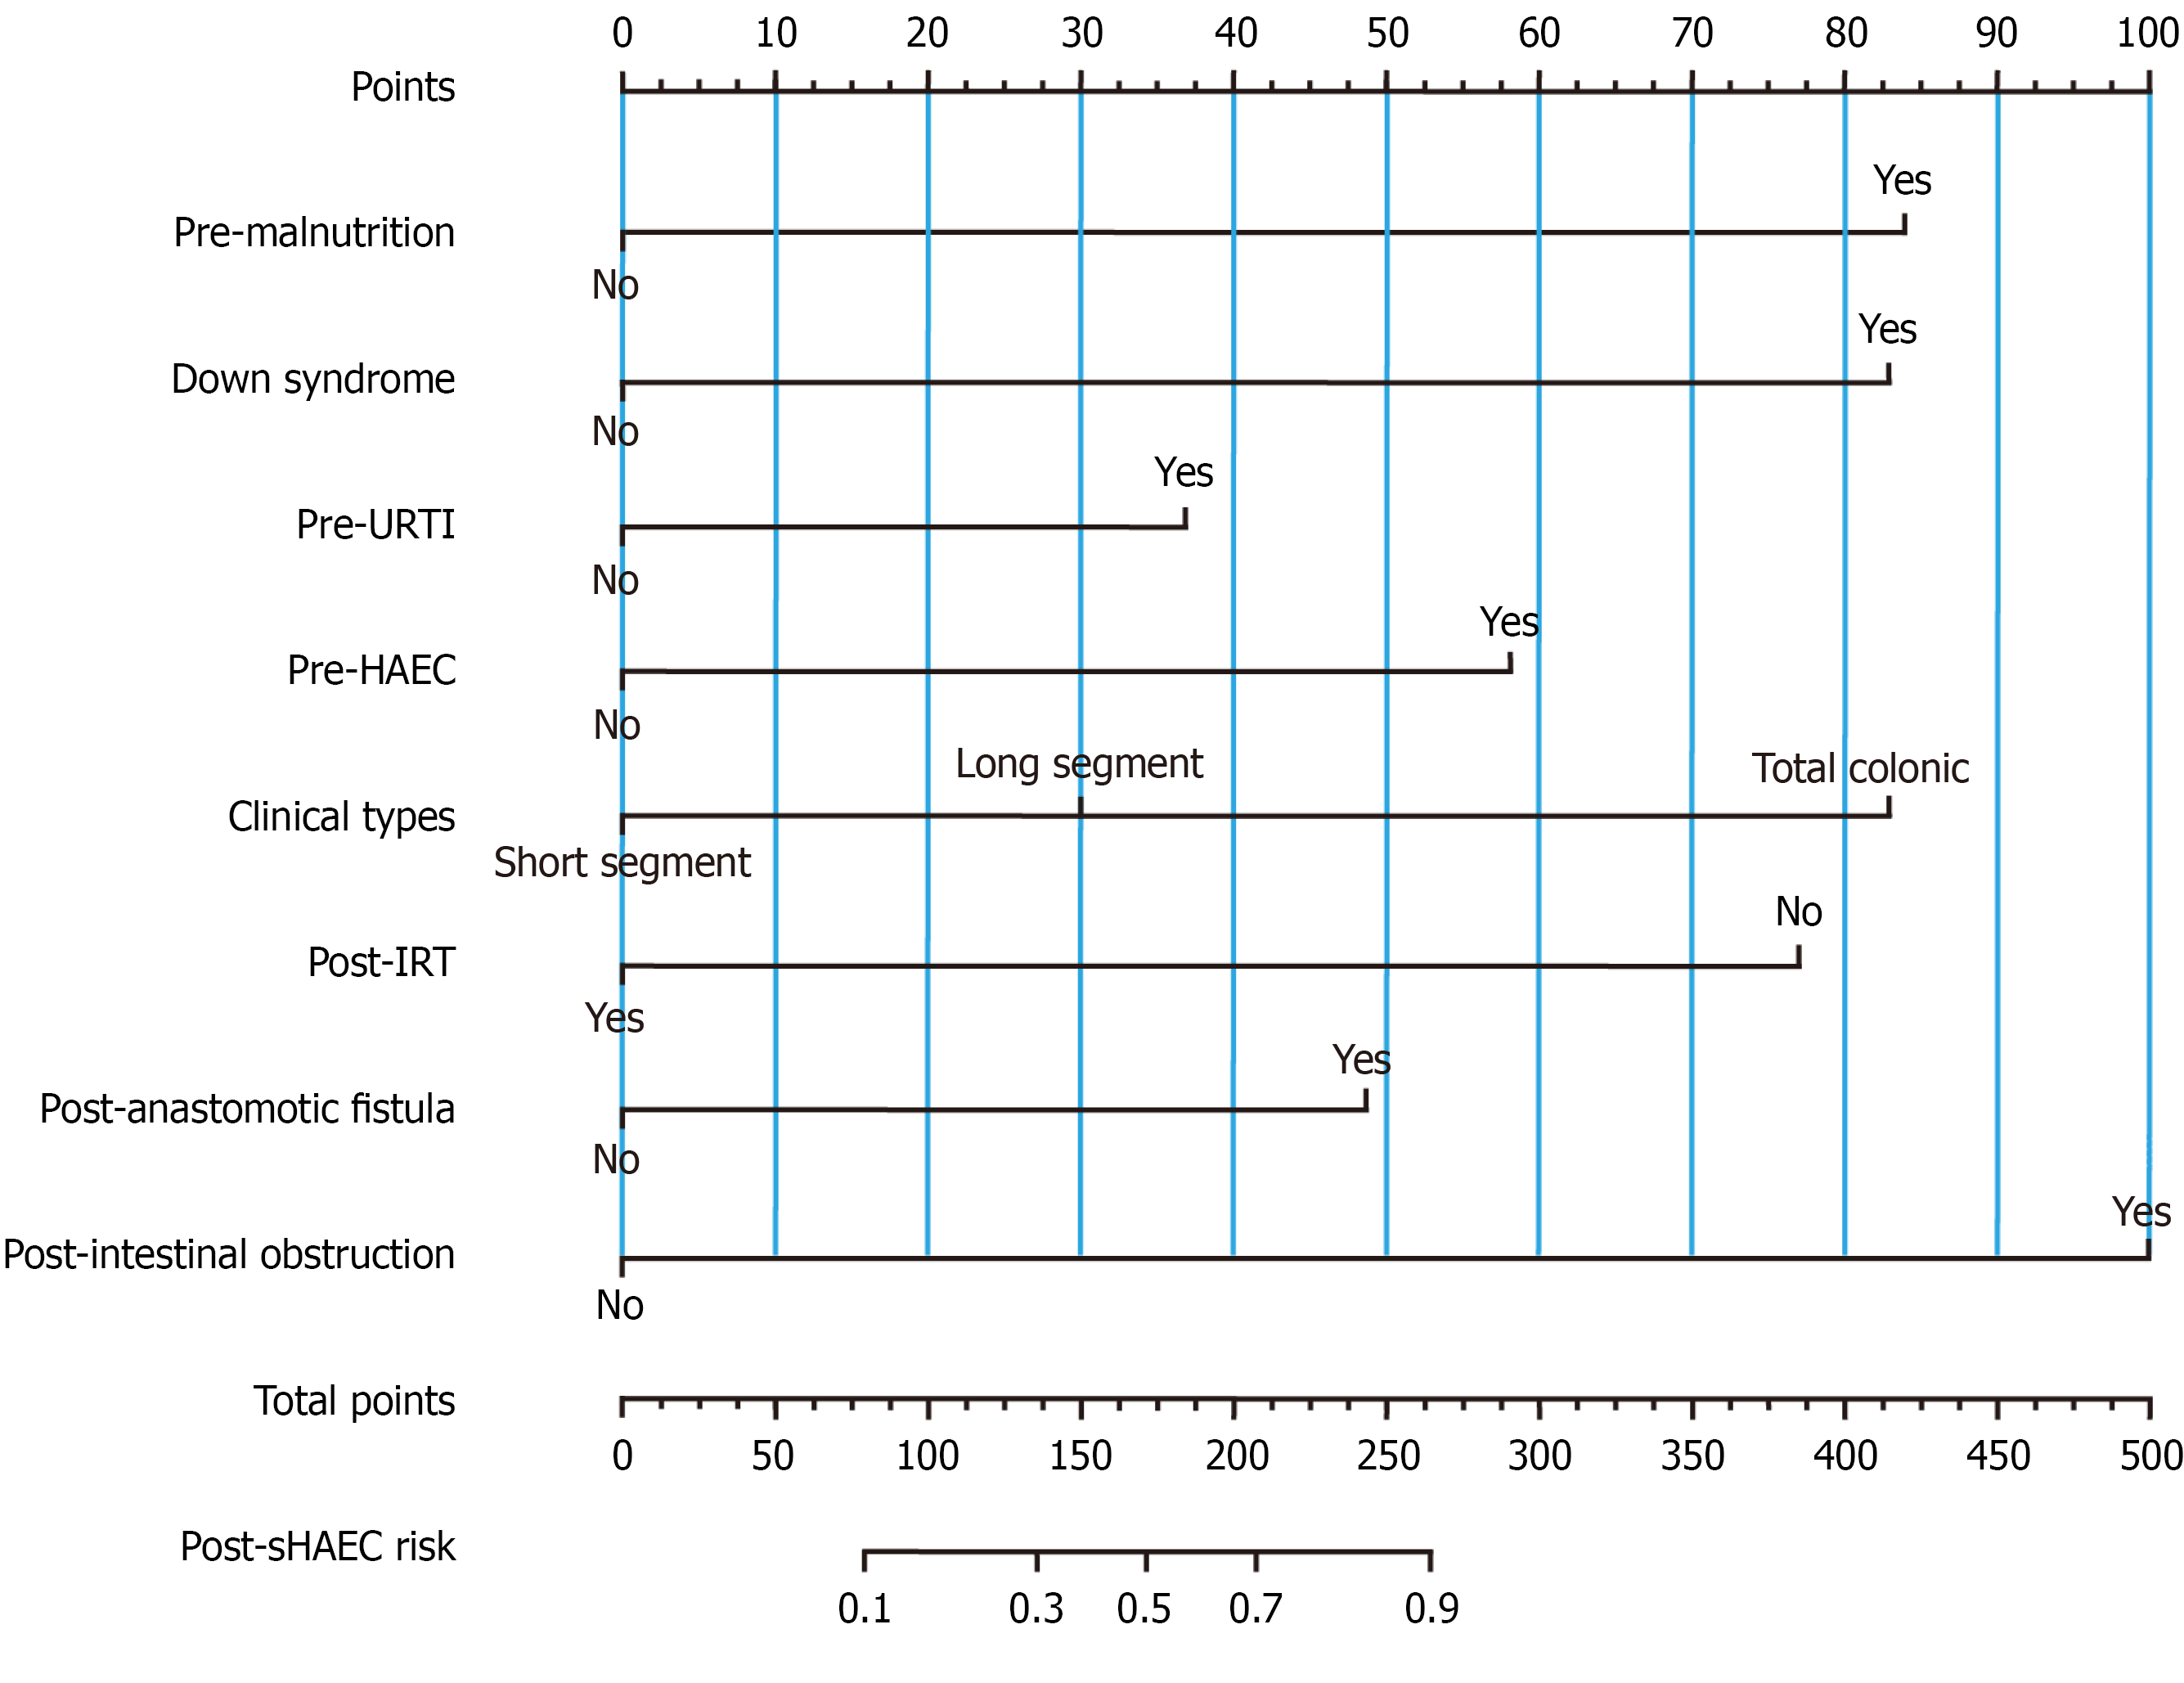
Figure 3 The nomogram for prediction the possibility of severe Hirschsprung-associated enterocolitis in Hirschsprung disease patients.
Each clinical factor with different status would correspond to a score in “Point”. The scores for each clinical factor were added to obtain an overall score in “Total point”. Then, “Total point” would correspond to risk of “sHAEC”. Pre-URTI: Preoperative upper respiratory tract infection; Pre-HAEC: Preoperative Hirschsprung-associated enterocolitis; Post-IRT: Postoperative indwelling rectal tube; sHAEC: Severe Hirschsprung-associated enterocolitis.
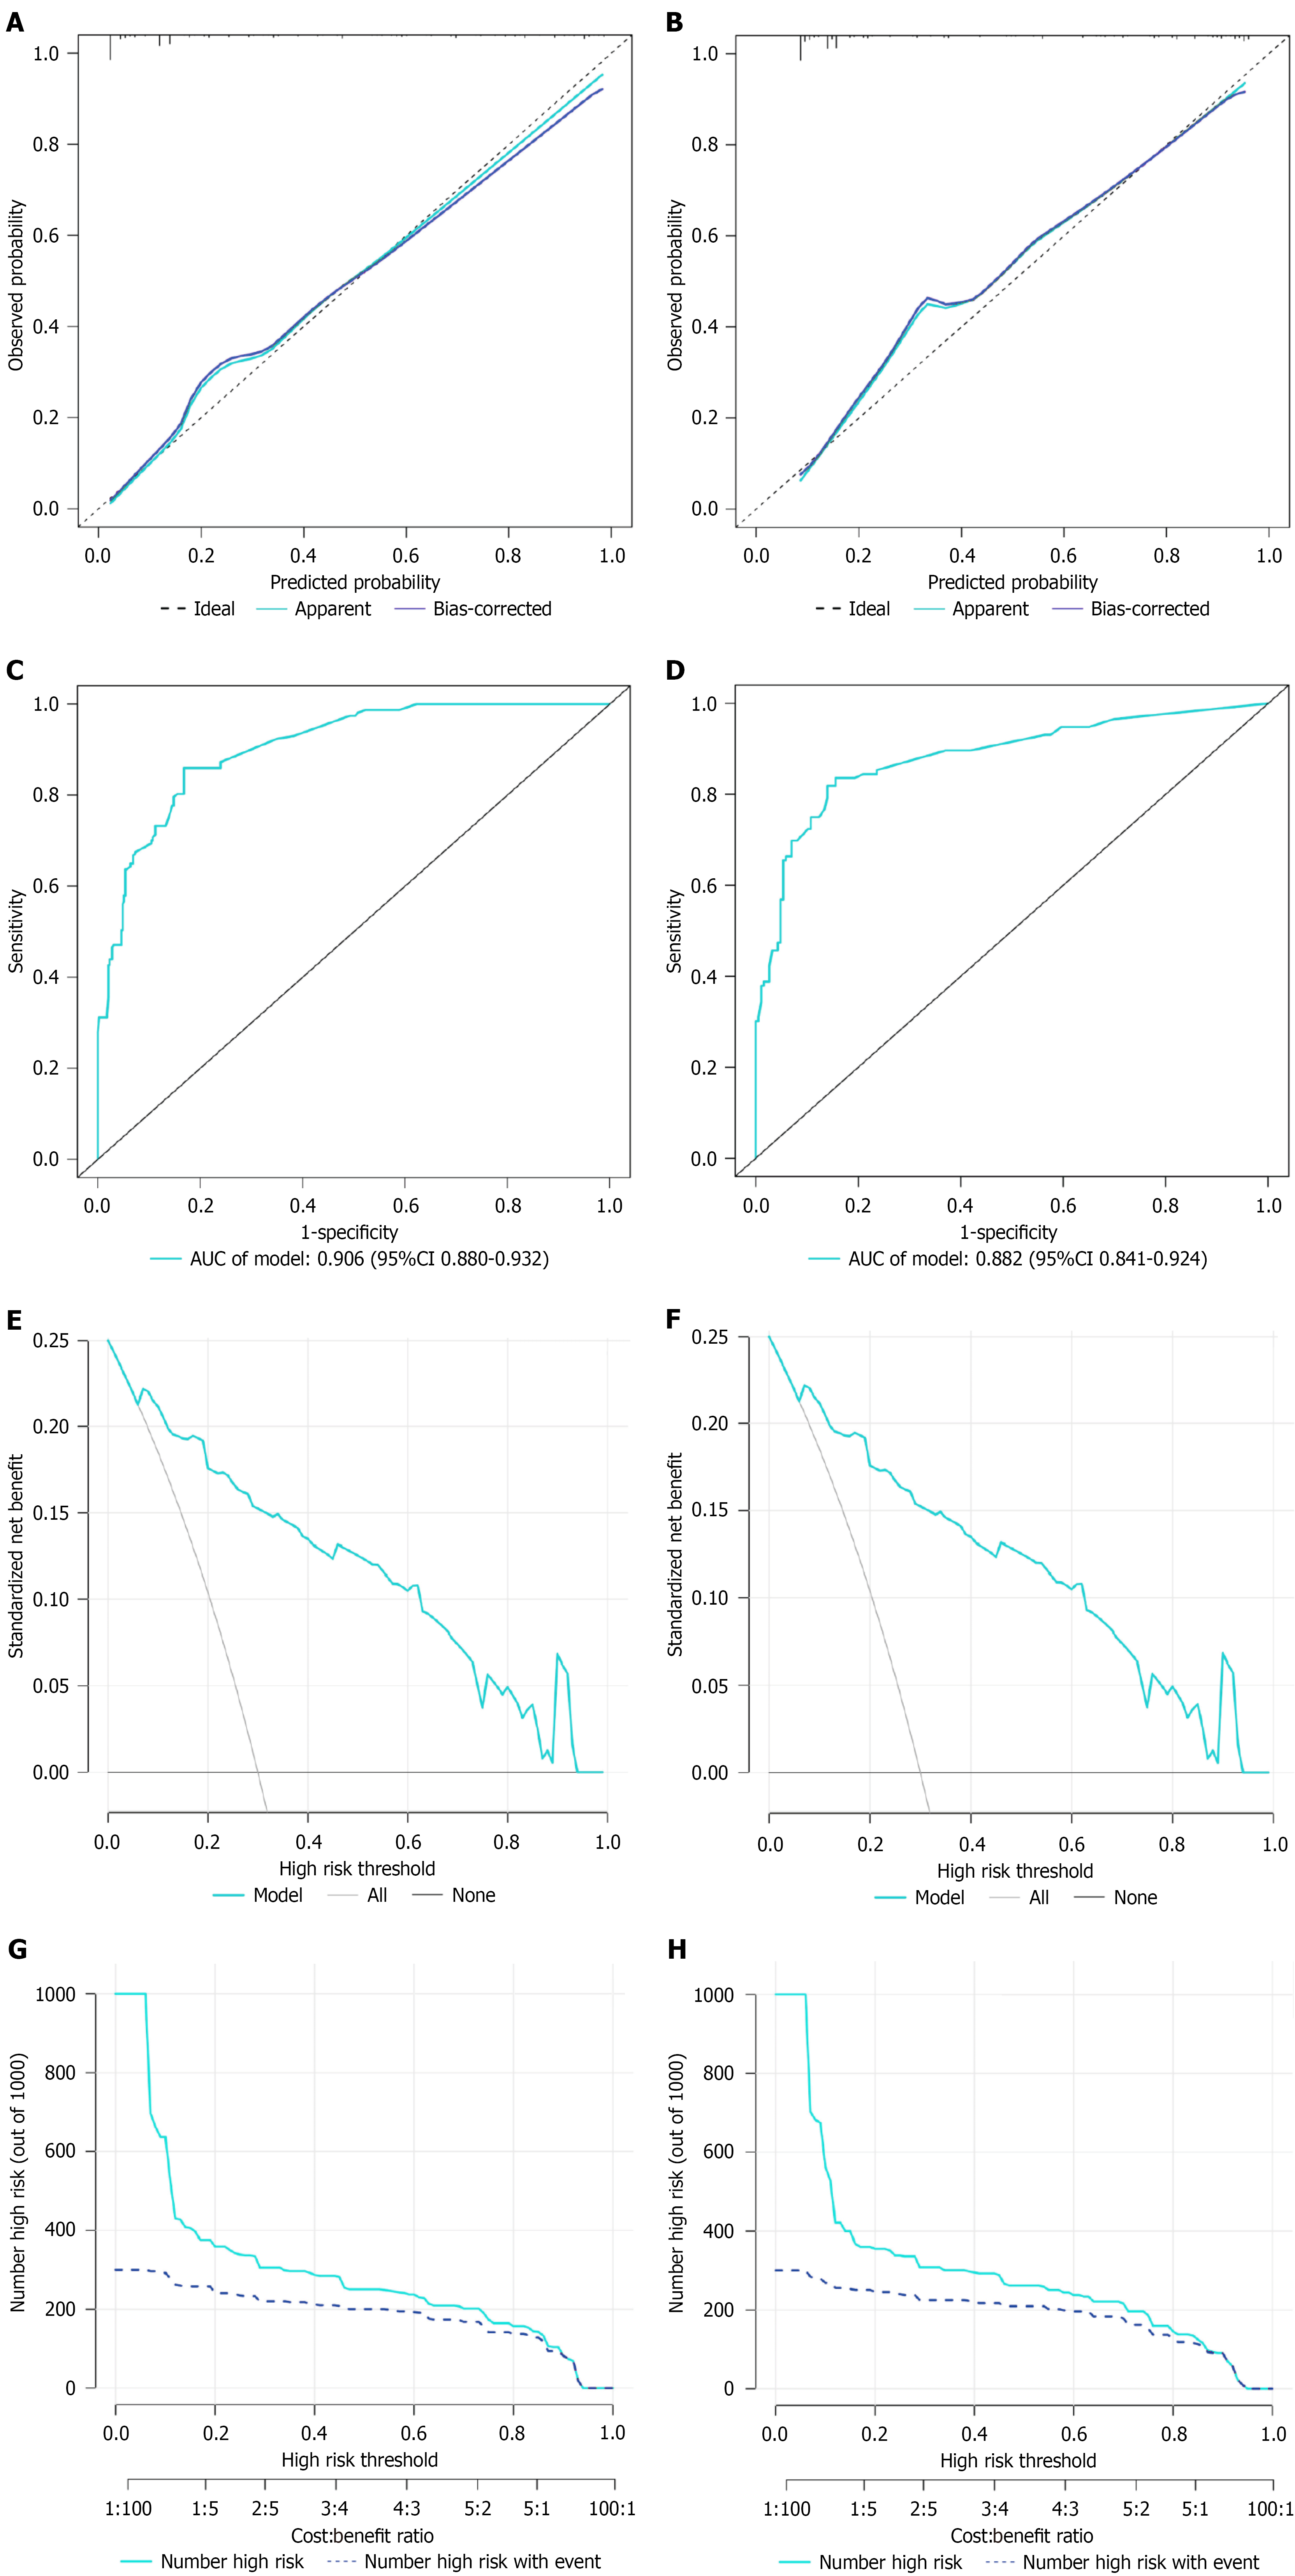
Figure 4 Calibration curves for the nomogram model of Severe Hirschsprung-associated enterocolitis in Hirschsprung disease patients.
A: Training cohort; B: Internal validation cohort. The X-axis represents the probability of severe Hirschsprung-associated enterocolitis (sHAEC) in Hirschsprung disease patients predicted by the nomogram; the Y-axis represents the actual outcome. The diagonal dashed line represents the ideal prediction using the ideal model; the solid black line represents the nomogram model calibration curve. The calibration curve close to the diagonal dashed line indicates good agreement between the predicted and actual probabilities; C and D: Area under the receiver operating characteristic curve of the nomogram model in training cohort and internal validation cohort. The closer the area under the receiver operating characteristic curve is to 1, the more reliable the predictive ability of the model; E and F: Decision curve analysis (DCA) curves of the nomogram model in training cohort, internal validation cohort. The X-axis is the high-risk threshold probability, and the Y-axis is the net benefit. The grey and black lines are the extreme curves; the grey line stands for the hypothesis that all patients suffer from sHAEC; and the black line stands for the hypothesis that all patients do not suffer from sHAEC. The cyan line is the DCA curve of the nomogram model, representing the net benefit of the model under different high-risk thresholds. The farther the DCA curve is from the extreme curve, the greater the range of net benefit and the better the clinical utility; G and H: Clinical impact curve of the nomogram model in training cohort, internal validation cohort. AUC: Area under the receiver operating characteristic curve.
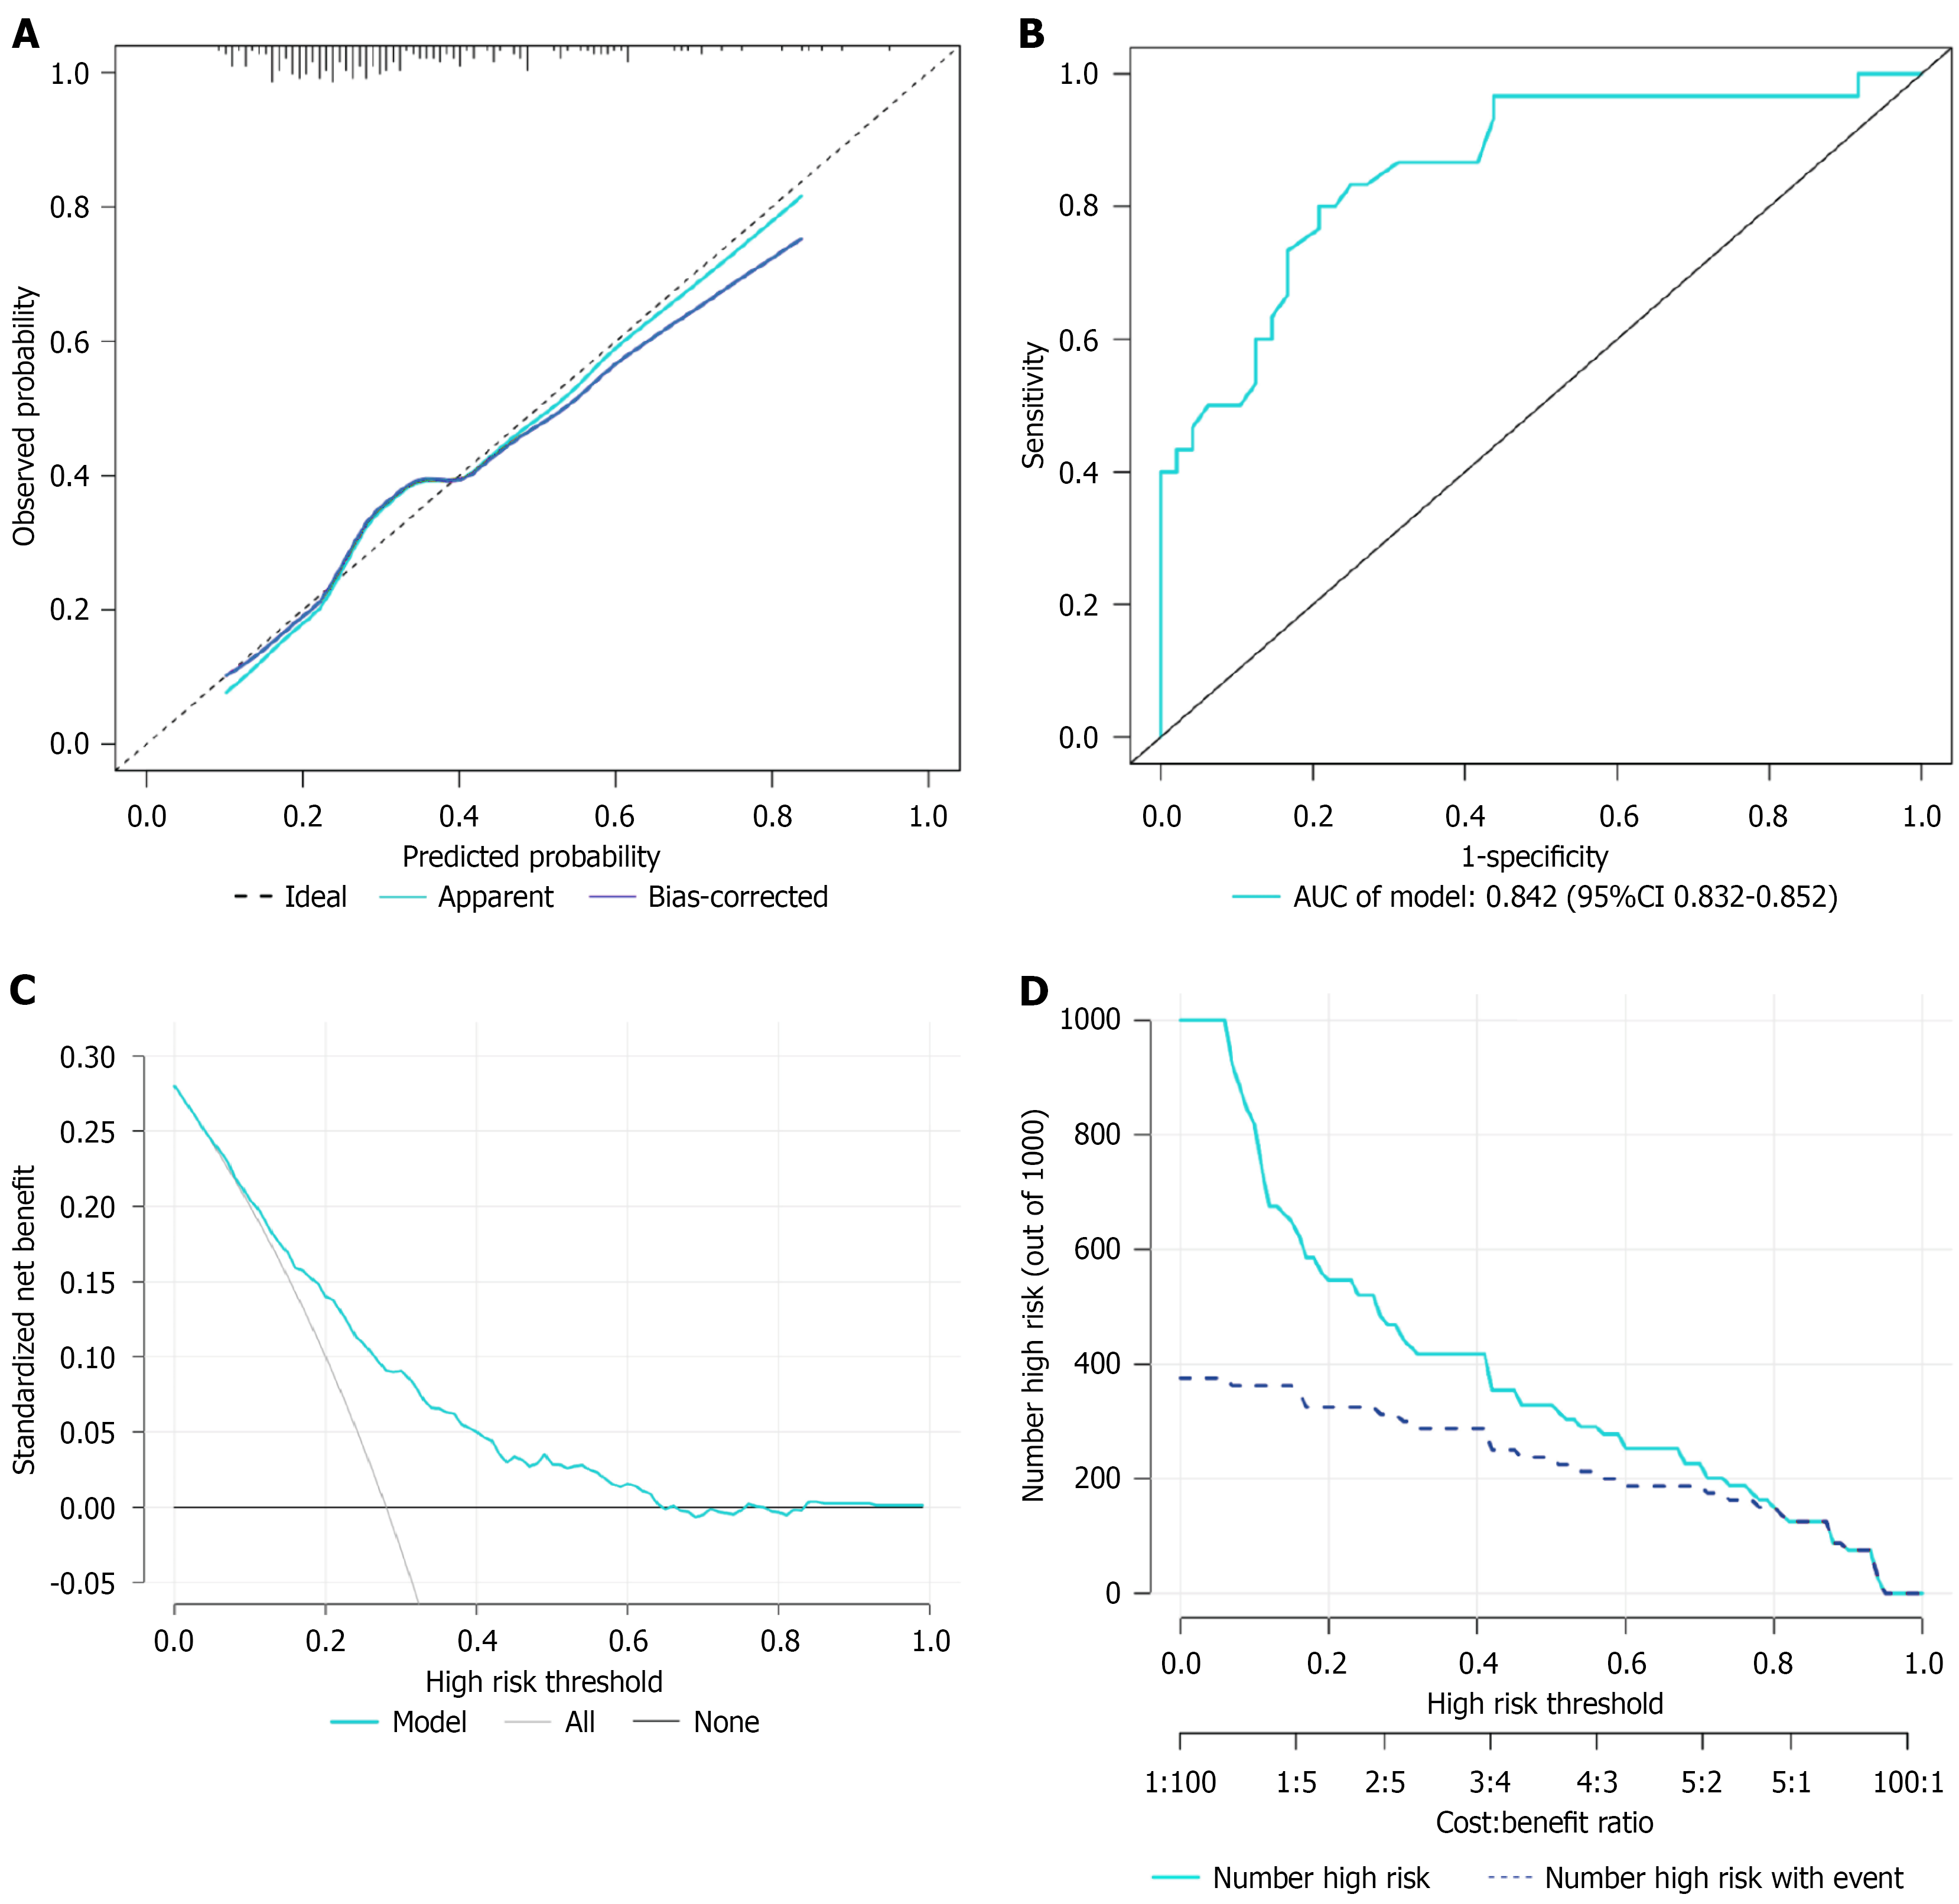
Figure 5 Parameter of the external validation cohort.
A: Calibration curves, B: Area under the receiver operating characteristic curve; C: Decision curve analysis curves; D: Clinical impact curves. AUC: Area under the receiver operating characteristic curve.
- Citation: Tang JF, Zhou Y, Luo ZB, Zheng ZB, Zhang MX, Chi SQ, Cao GQ, Zhang X, Li S, Zhong B, Tang ST. Online calculators to predict severe Hirschsprung-associated enterocolitis after pull-through surgery for Hirschsprung disease: A multicenter retrospective study. World J Gastroenterol 2027; 33(3): 124159
- URL: https://www.wjgnet.com/1007-9327/full/v33/i3/124159.htm
- DOI: https://dx.doi.org/10.3748/wjg.124159