
















Copyright: ©Author(s) 2026.
World J Gastroenterol. Jan 21, 2027; 33(3): 124070
Published online Jan 21, 2027. doi: 10.3748/wjg.124070
Published online Jan 21, 2027. doi: 10.3748/wjg.124070
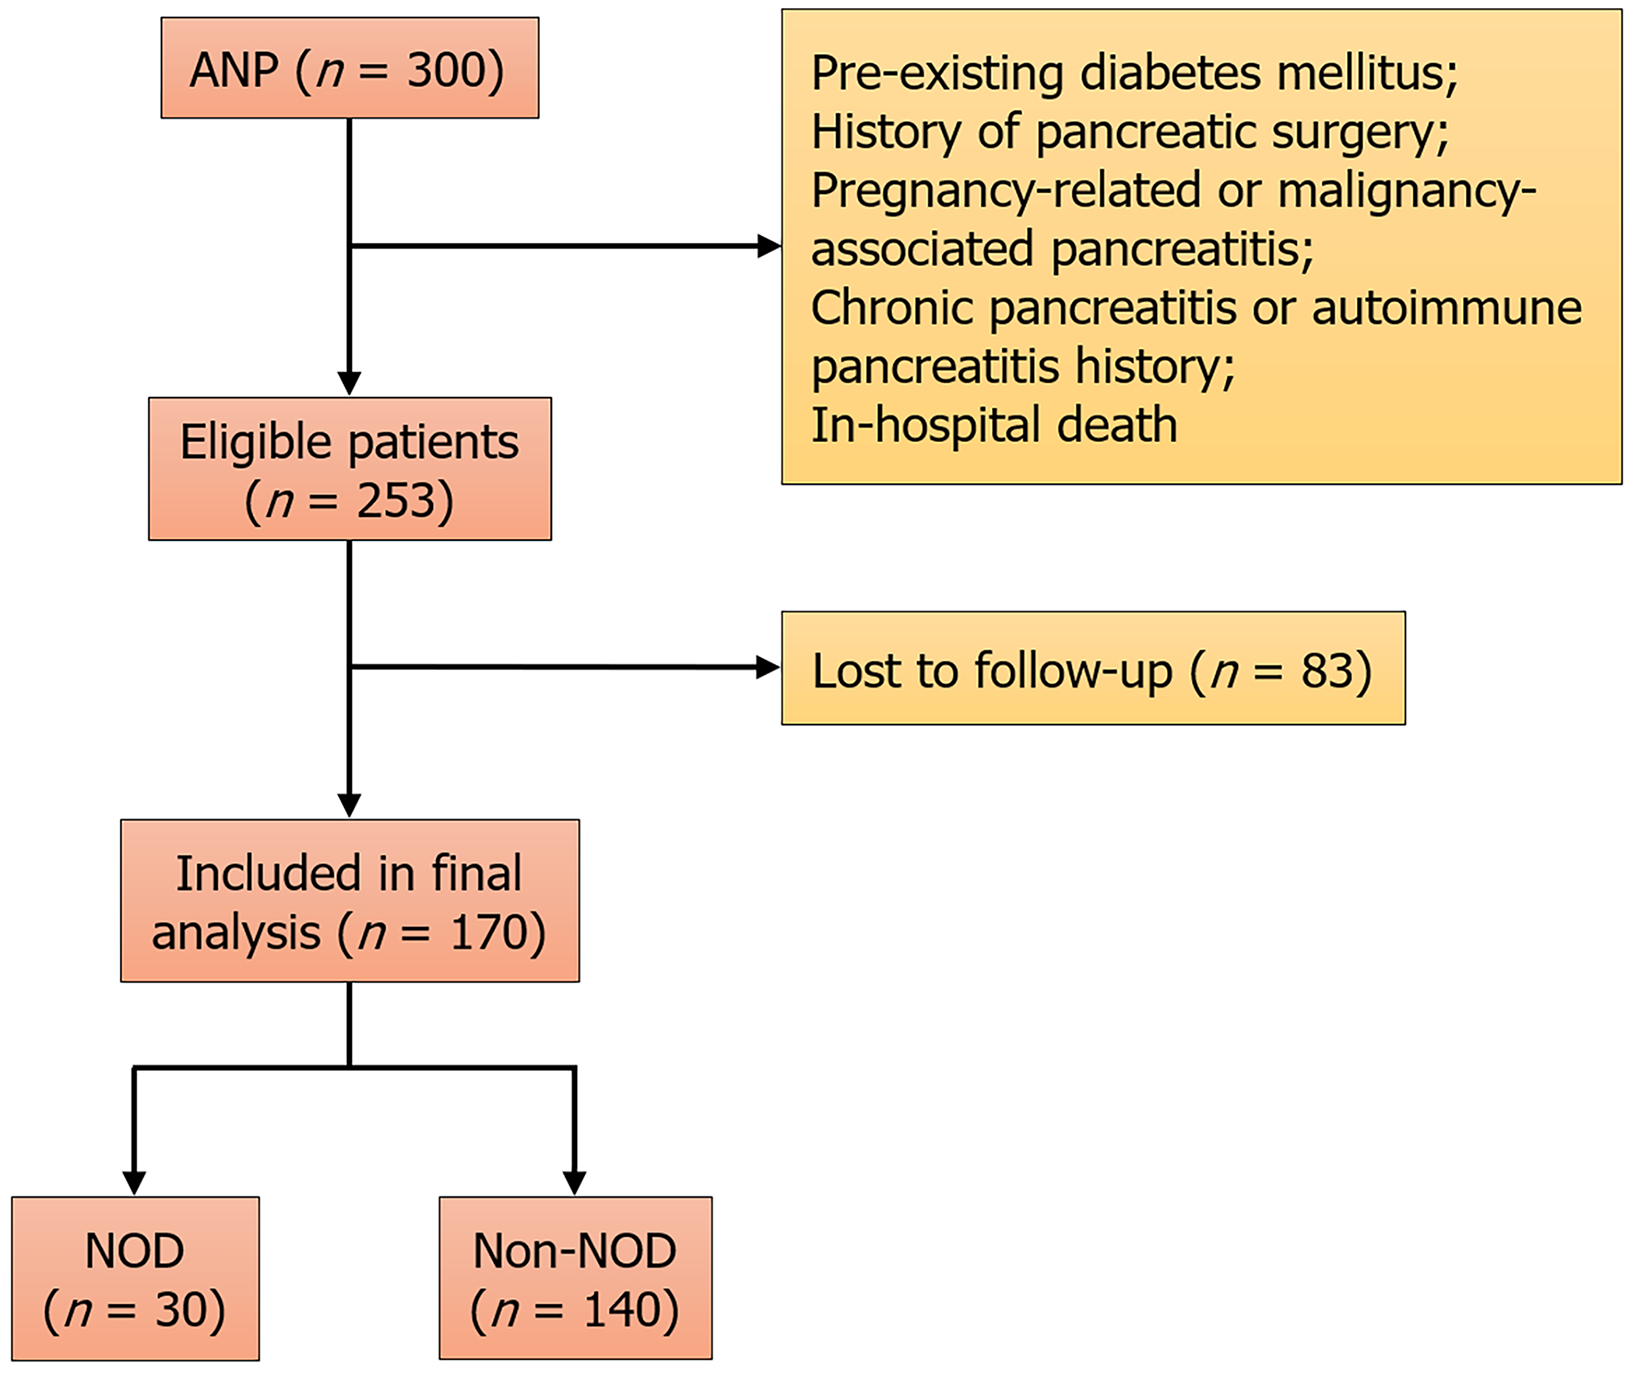
Figure 1 Flowchart of patient selection and study enrollment.
ANP: Acute necrotizing pancreatitis; NOD: New-onset diabetes.
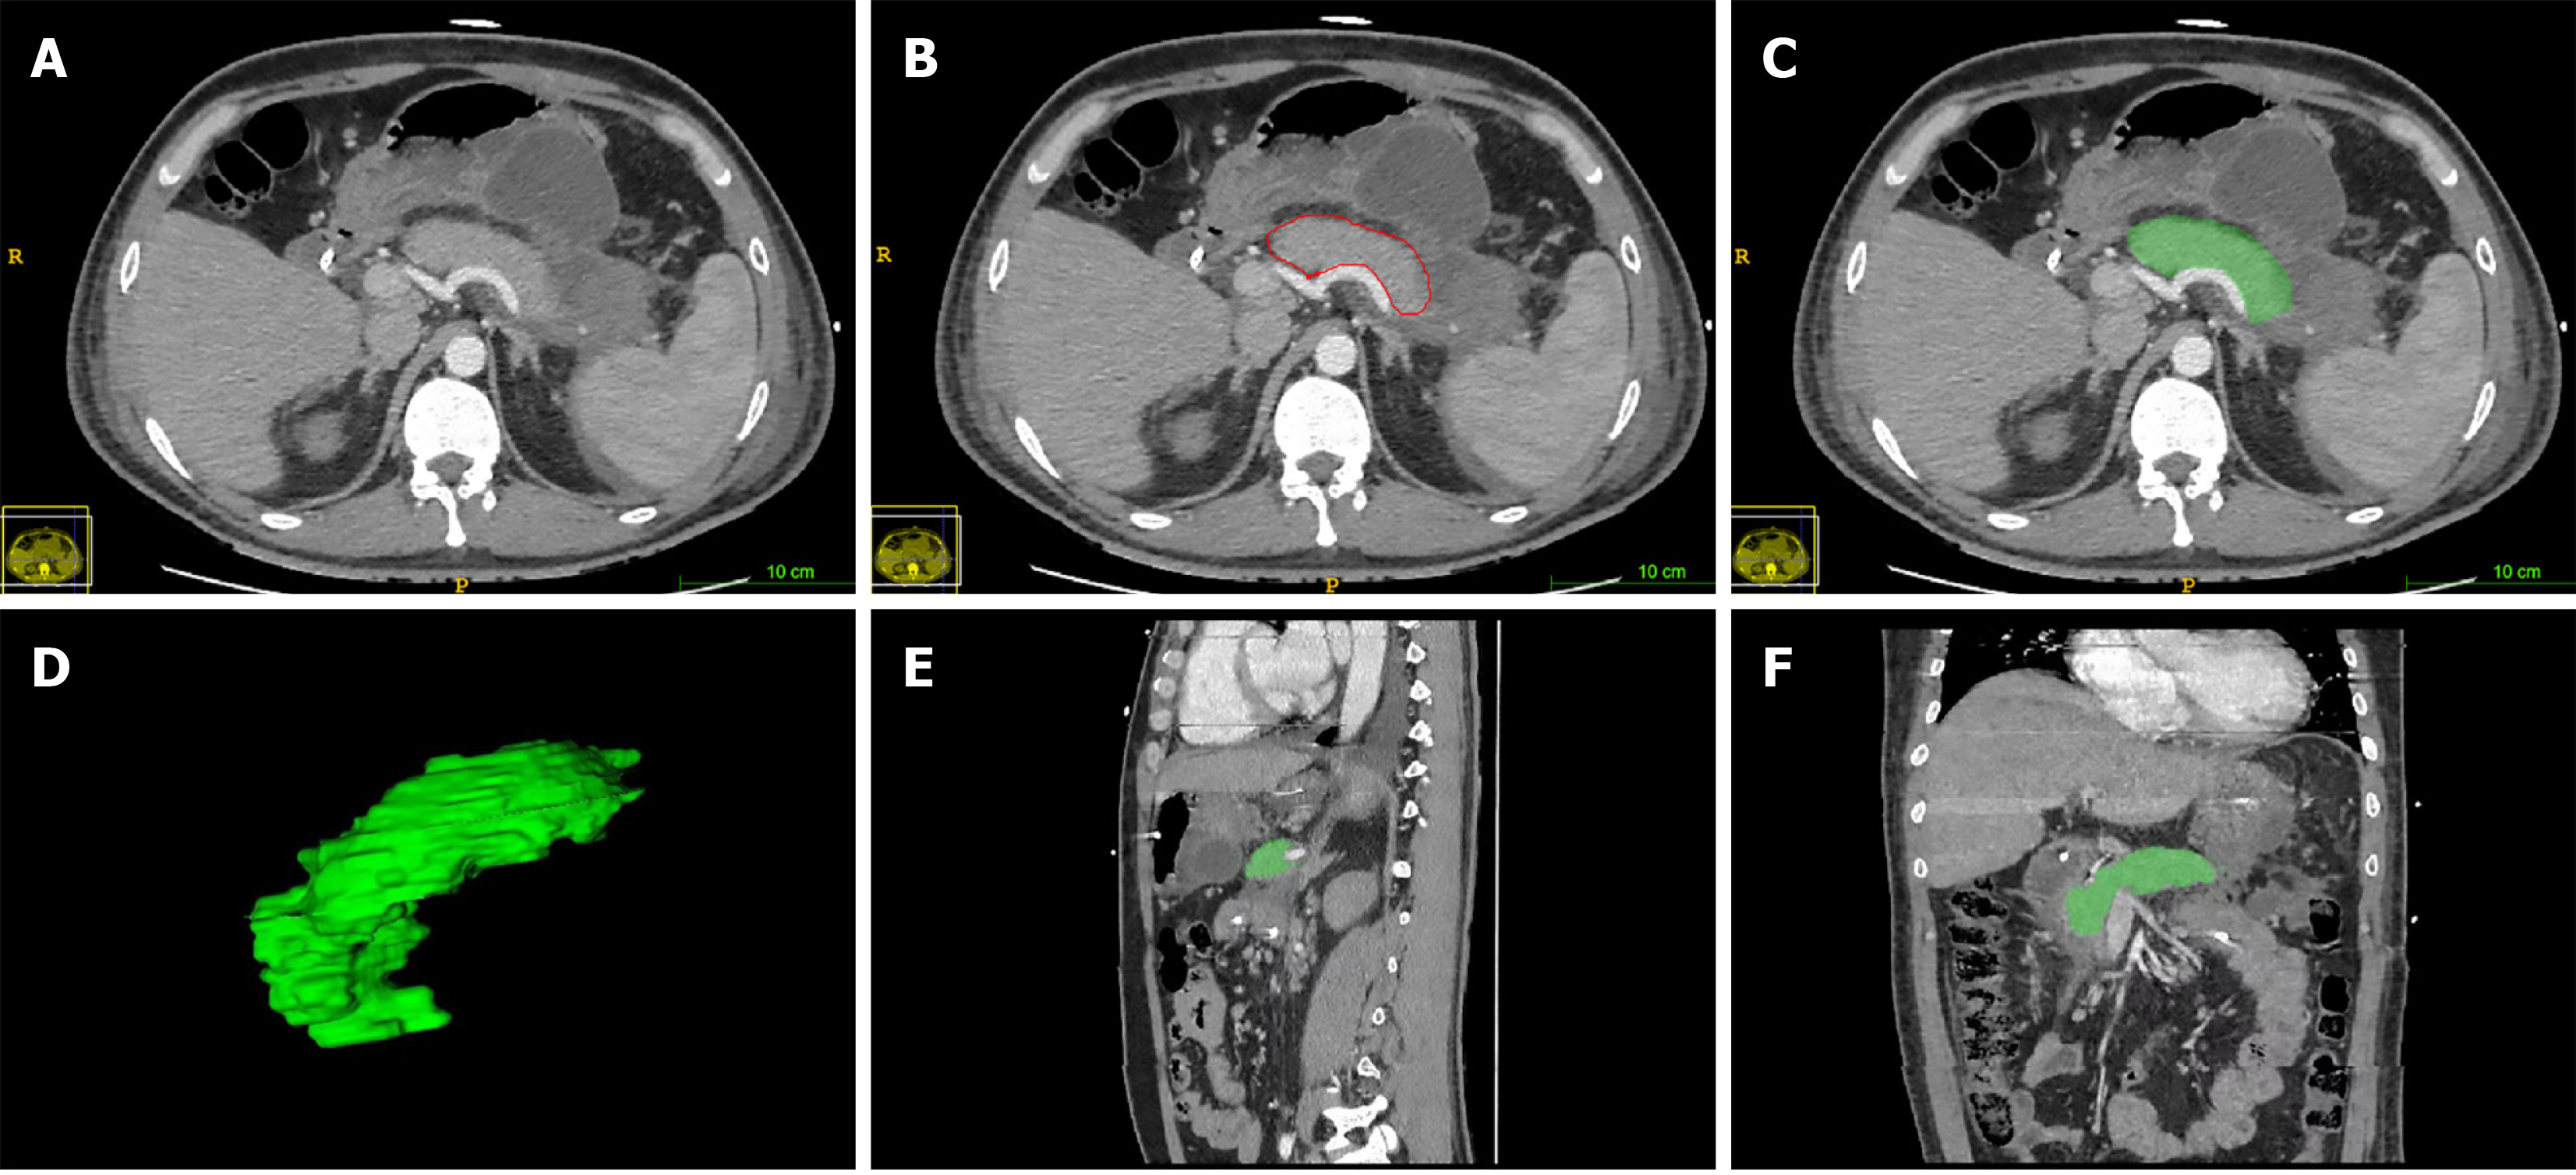
Figure 2 Quantitative radiological assessment of residual pancreatic volume in a 57-year-old patient with acute necrotizing pancreatitis.
A: Axial contrast-enhanced computed tomography (CECT) images showing necrosis (non-enhancing areas) within the pancreas; B: The residual pancreatic parenchyma (viable pancreatic tissue) was manually segmented using ITK-SNAP software and outlined with red solid lines; C: Using ITK-SNAP software, residual pancreatic volume was extracted on a slice-by-slice basis and visualized as the green segmented region; D: Three-dimensional reconstruction of the residual pancreatic volume, showing the calculated residual pancreatic volume (48.0 cm3); E: After plane reorientation, the sagittal view was obtained, with the residual pancreas highlighted in green; F: After plane reorientation, the coronal view was obtained, with the residual pancreas highlighted in green.
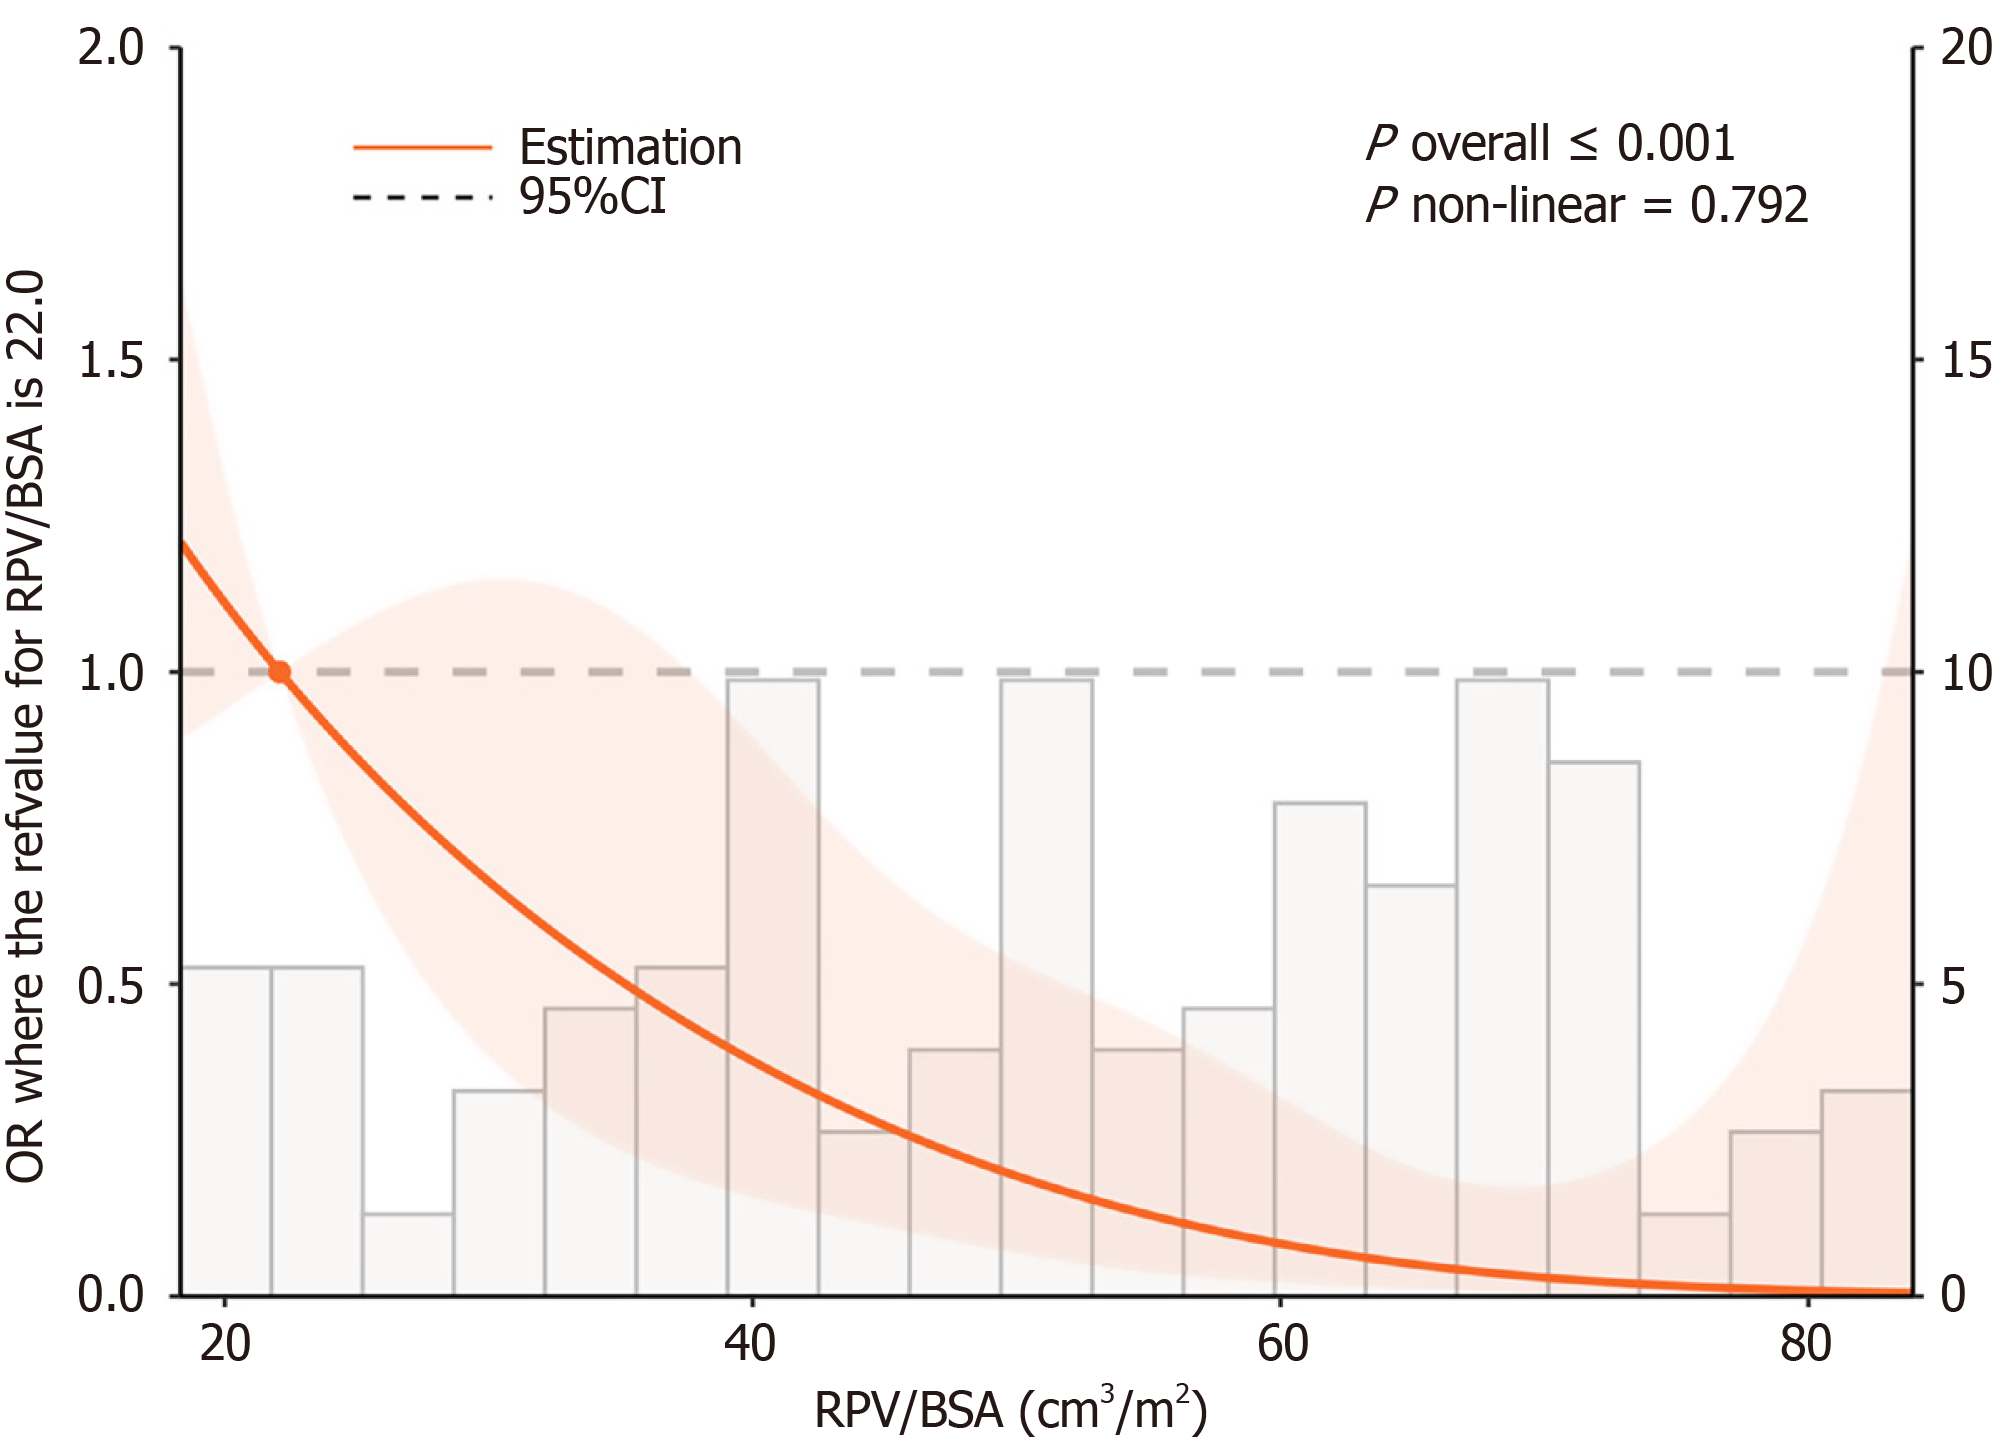
Figure 3 Restricted cubic spline analysis of the association between body surface area-indexed residual pancreatic volume and the risk of early new-onset diabetes.
RPV: Residual pancreatic volume; BSA: Body surface area; OR: Odds ratio; CI: Confidence interval.
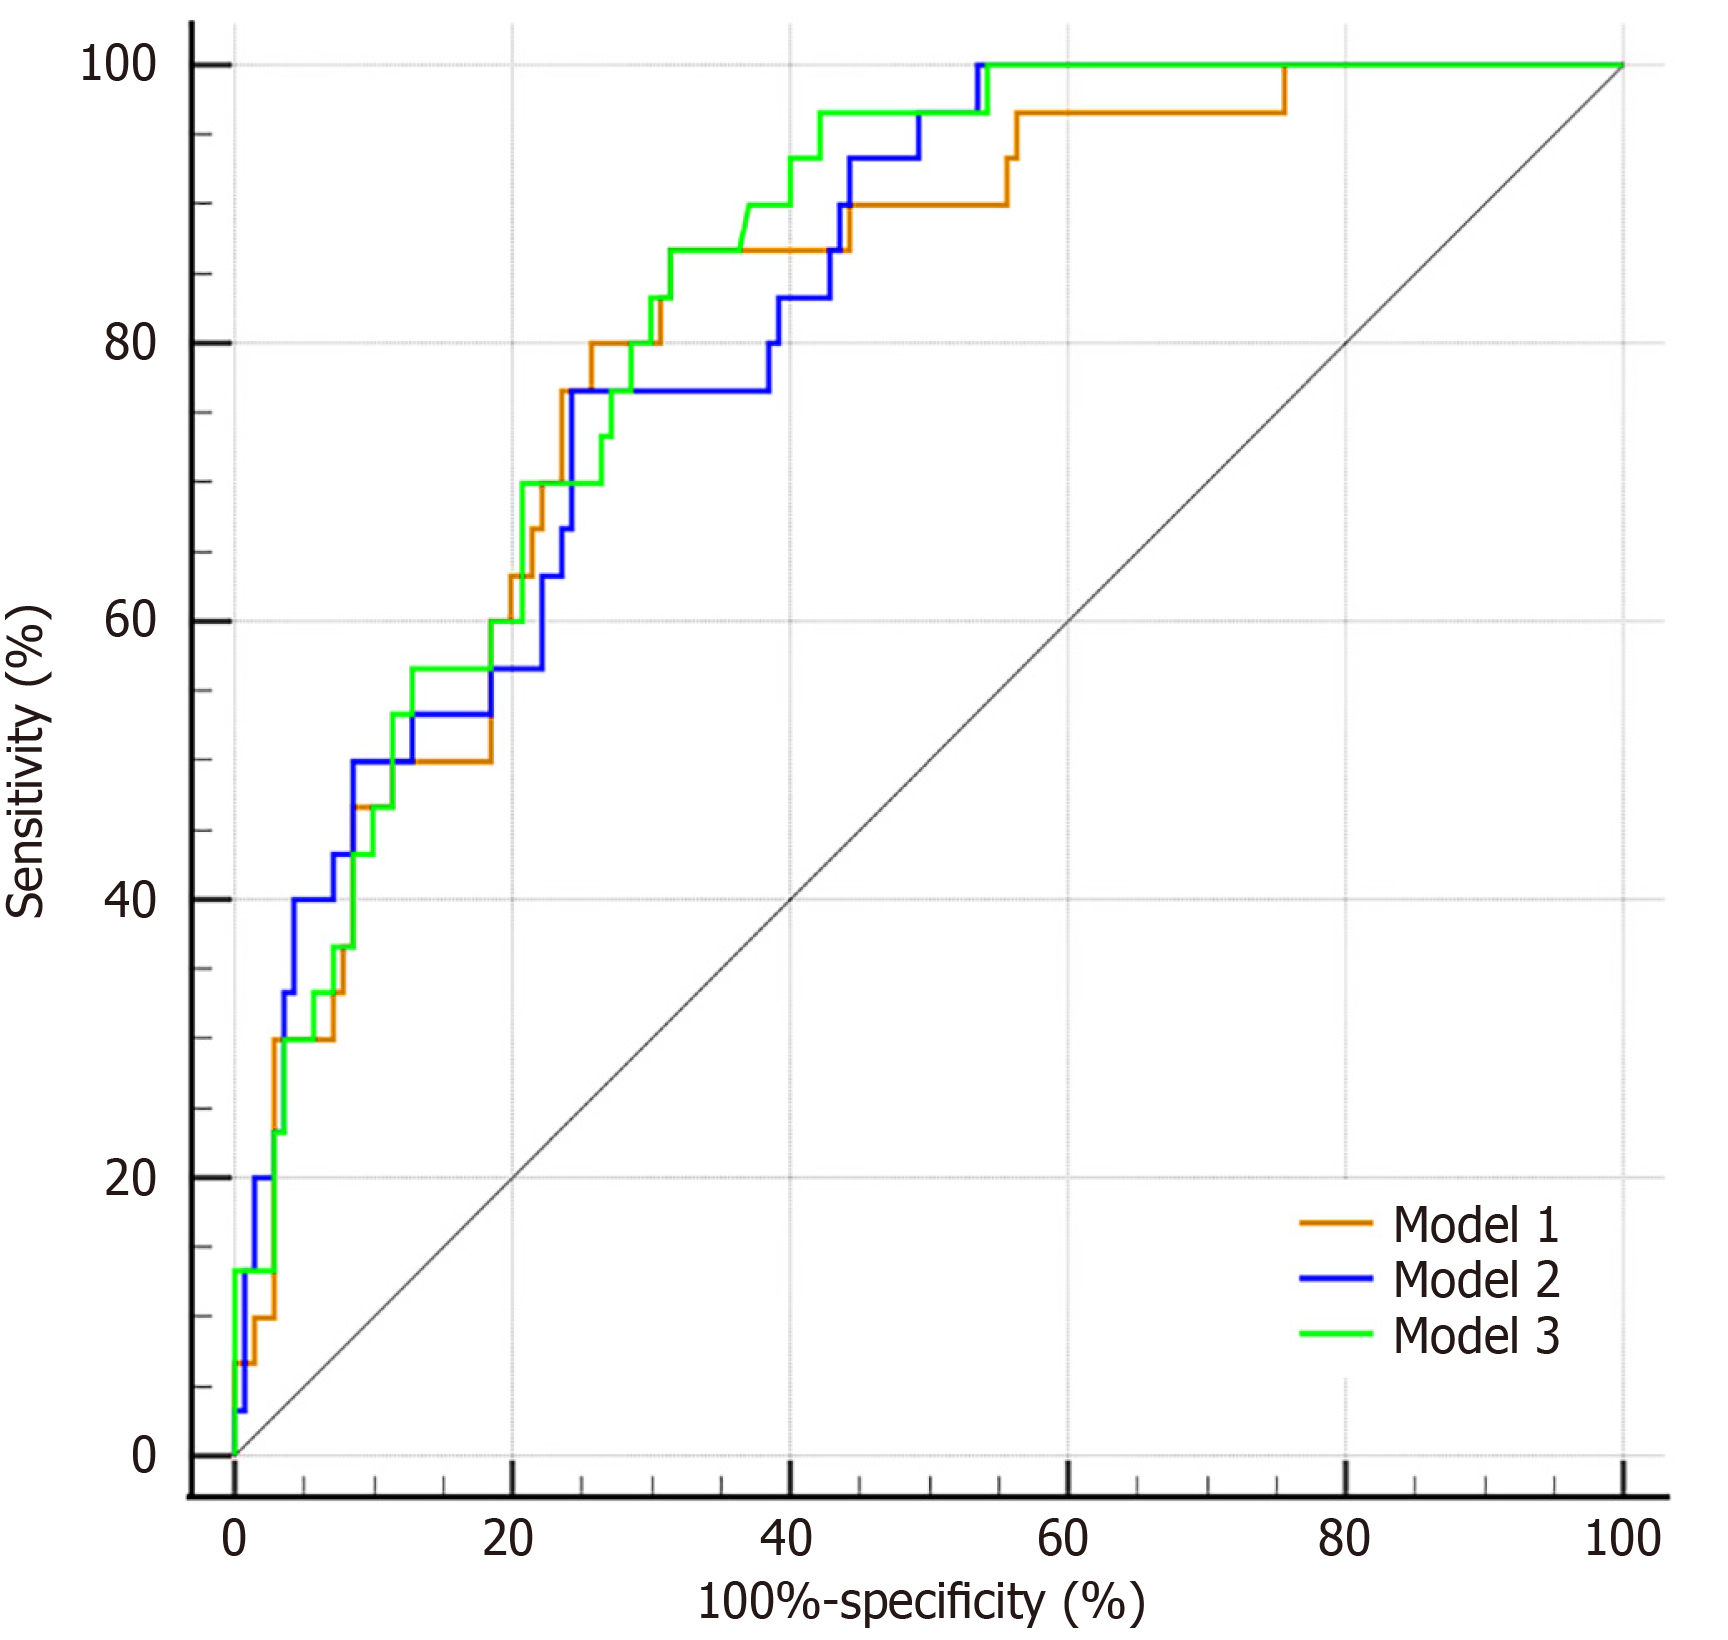
Figure 4 Comparison of receiver operating characteristic curves among the three predictive models for early new-onset diabetes.
Model 1 (orange line) includes body surface area-indexed residual pancreatic volume (RPV/BSA) alone. Model 2 (blue line) includes RPV/BSA and age. Model 3 (green line) includes RPV/BSA, age, peak blood glucose, and bedside index for severity in acute pancreatitis score.
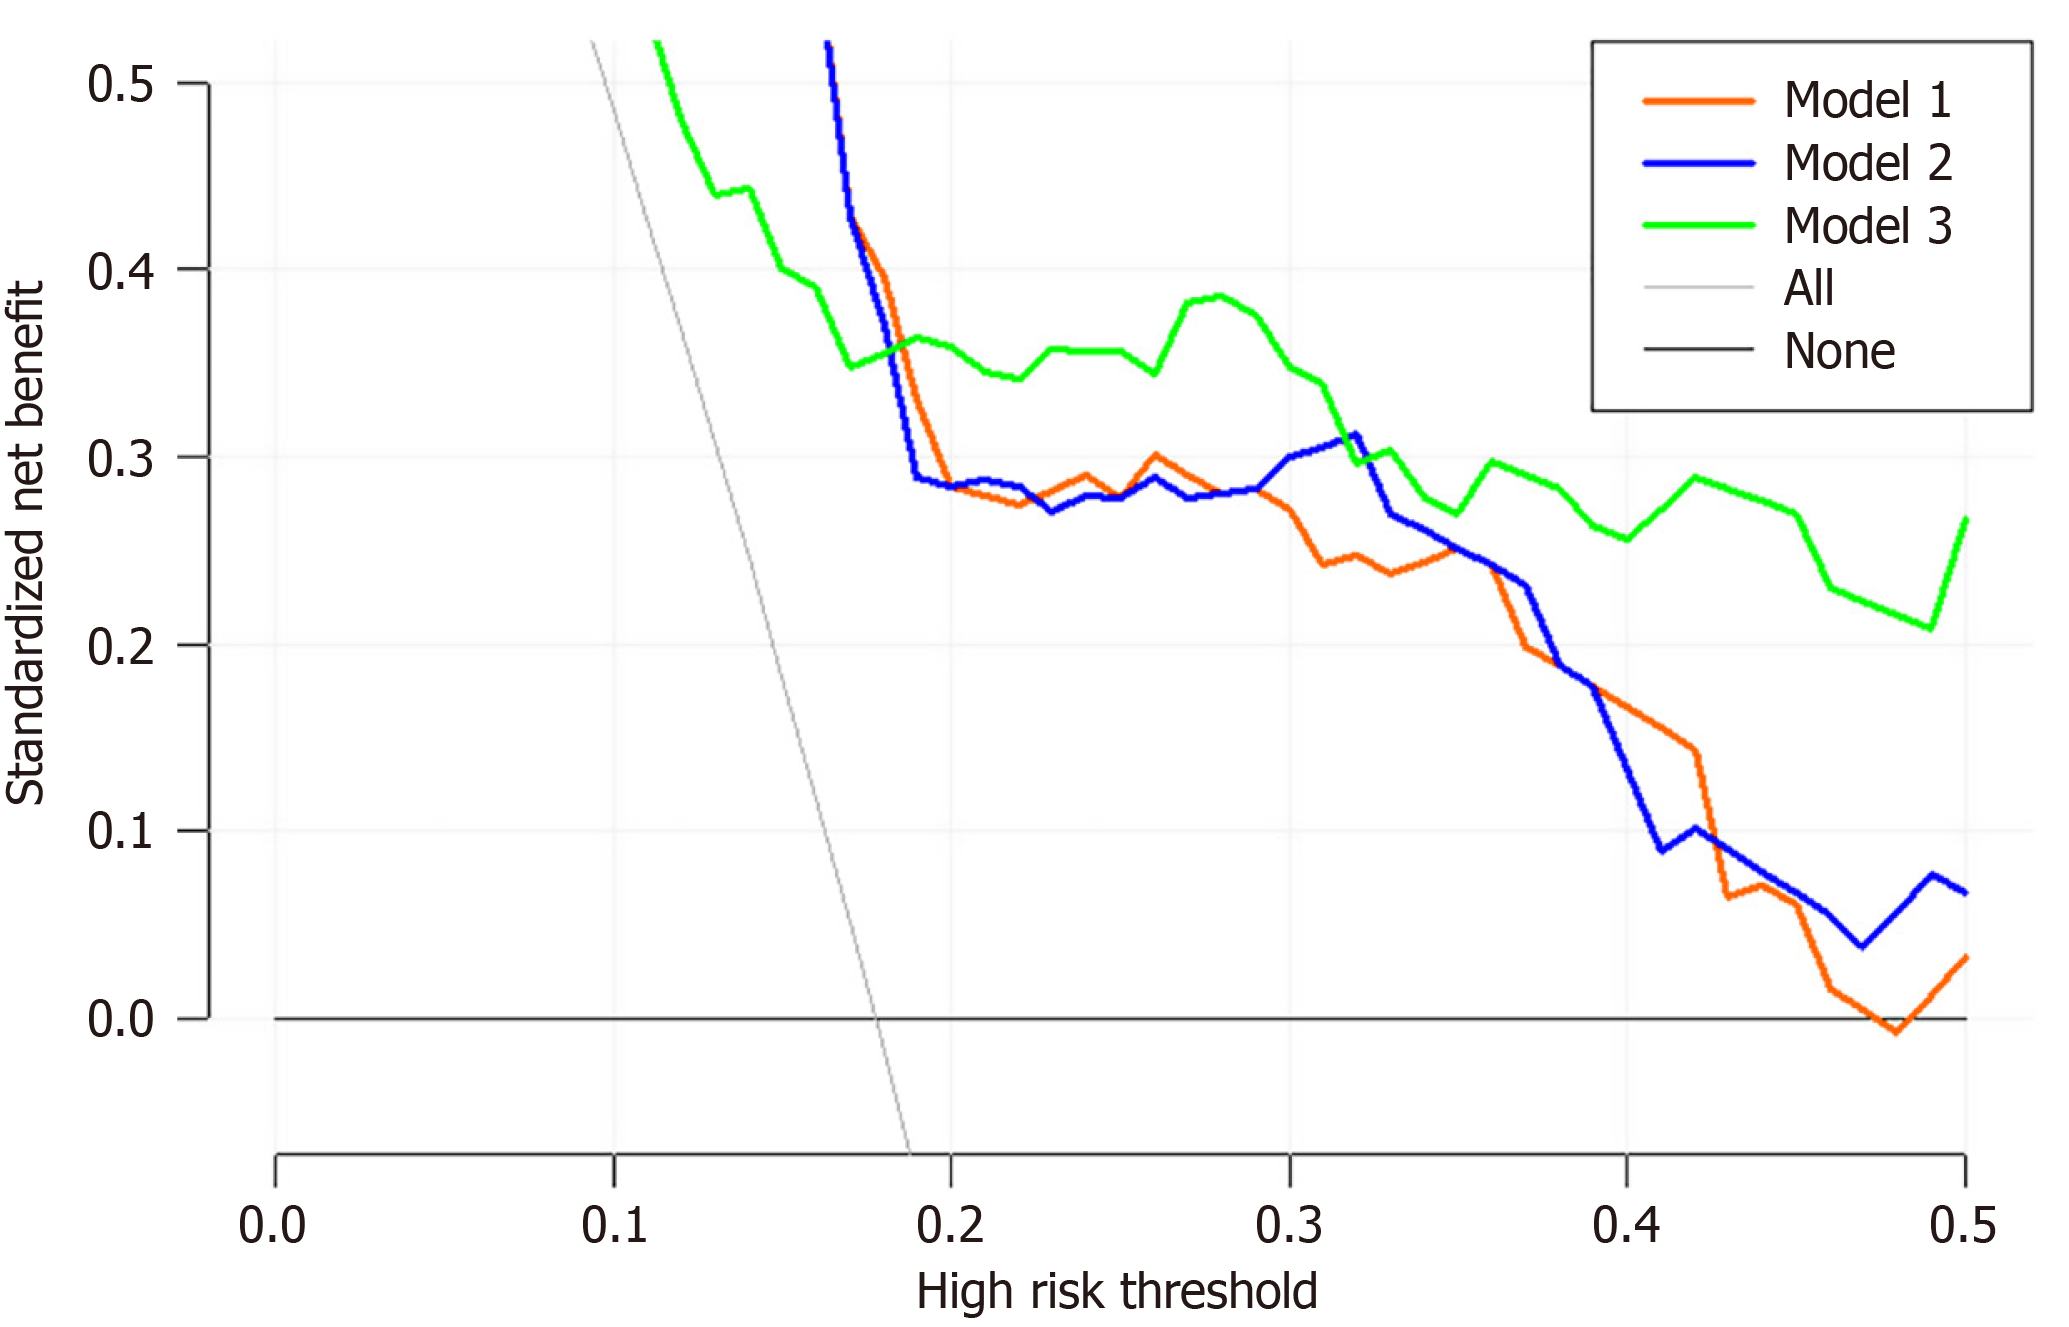
Figure 5 Decision curve analysis of the three predictive models for early new-onset diabetes after acute necrotizing pancreatitis.
Model 1 (orange line) includes body surface area-indexed residual pancreatic volume (RPV/BSA) alone. Model 2 (blue line) includes RPV/BSA and age. Model 3 (green line) includes RPV/BSA, age, peak blood glucose, and bedside index for severity in acute pancreatitis score.
- Citation: Tian CC, Hu C, Liu XY, Shen YY, Wu YM, Zhang LX, Mei Q. Body surface area-indexed residual pancreatic volume predicts early new-onset diabetes after acute necrotizing pancreatitis: Multivariable model evaluation. World J Gastroenterol 2027; 33(3): 124070
- URL: https://www.wjgnet.com/1007-9327/full/v33/i3/124070.htm
- DOI: https://dx.doi.org/10.3748/wjg.124070