
















Copyright: ©Author(s) 2026.
World J Gastroenterol. Jan 21, 2027; 33(3): 123331
Published online Jan 21, 2027. doi: 10.3748/wjg.123331
Published online Jan 21, 2027. doi: 10.3748/wjg.123331
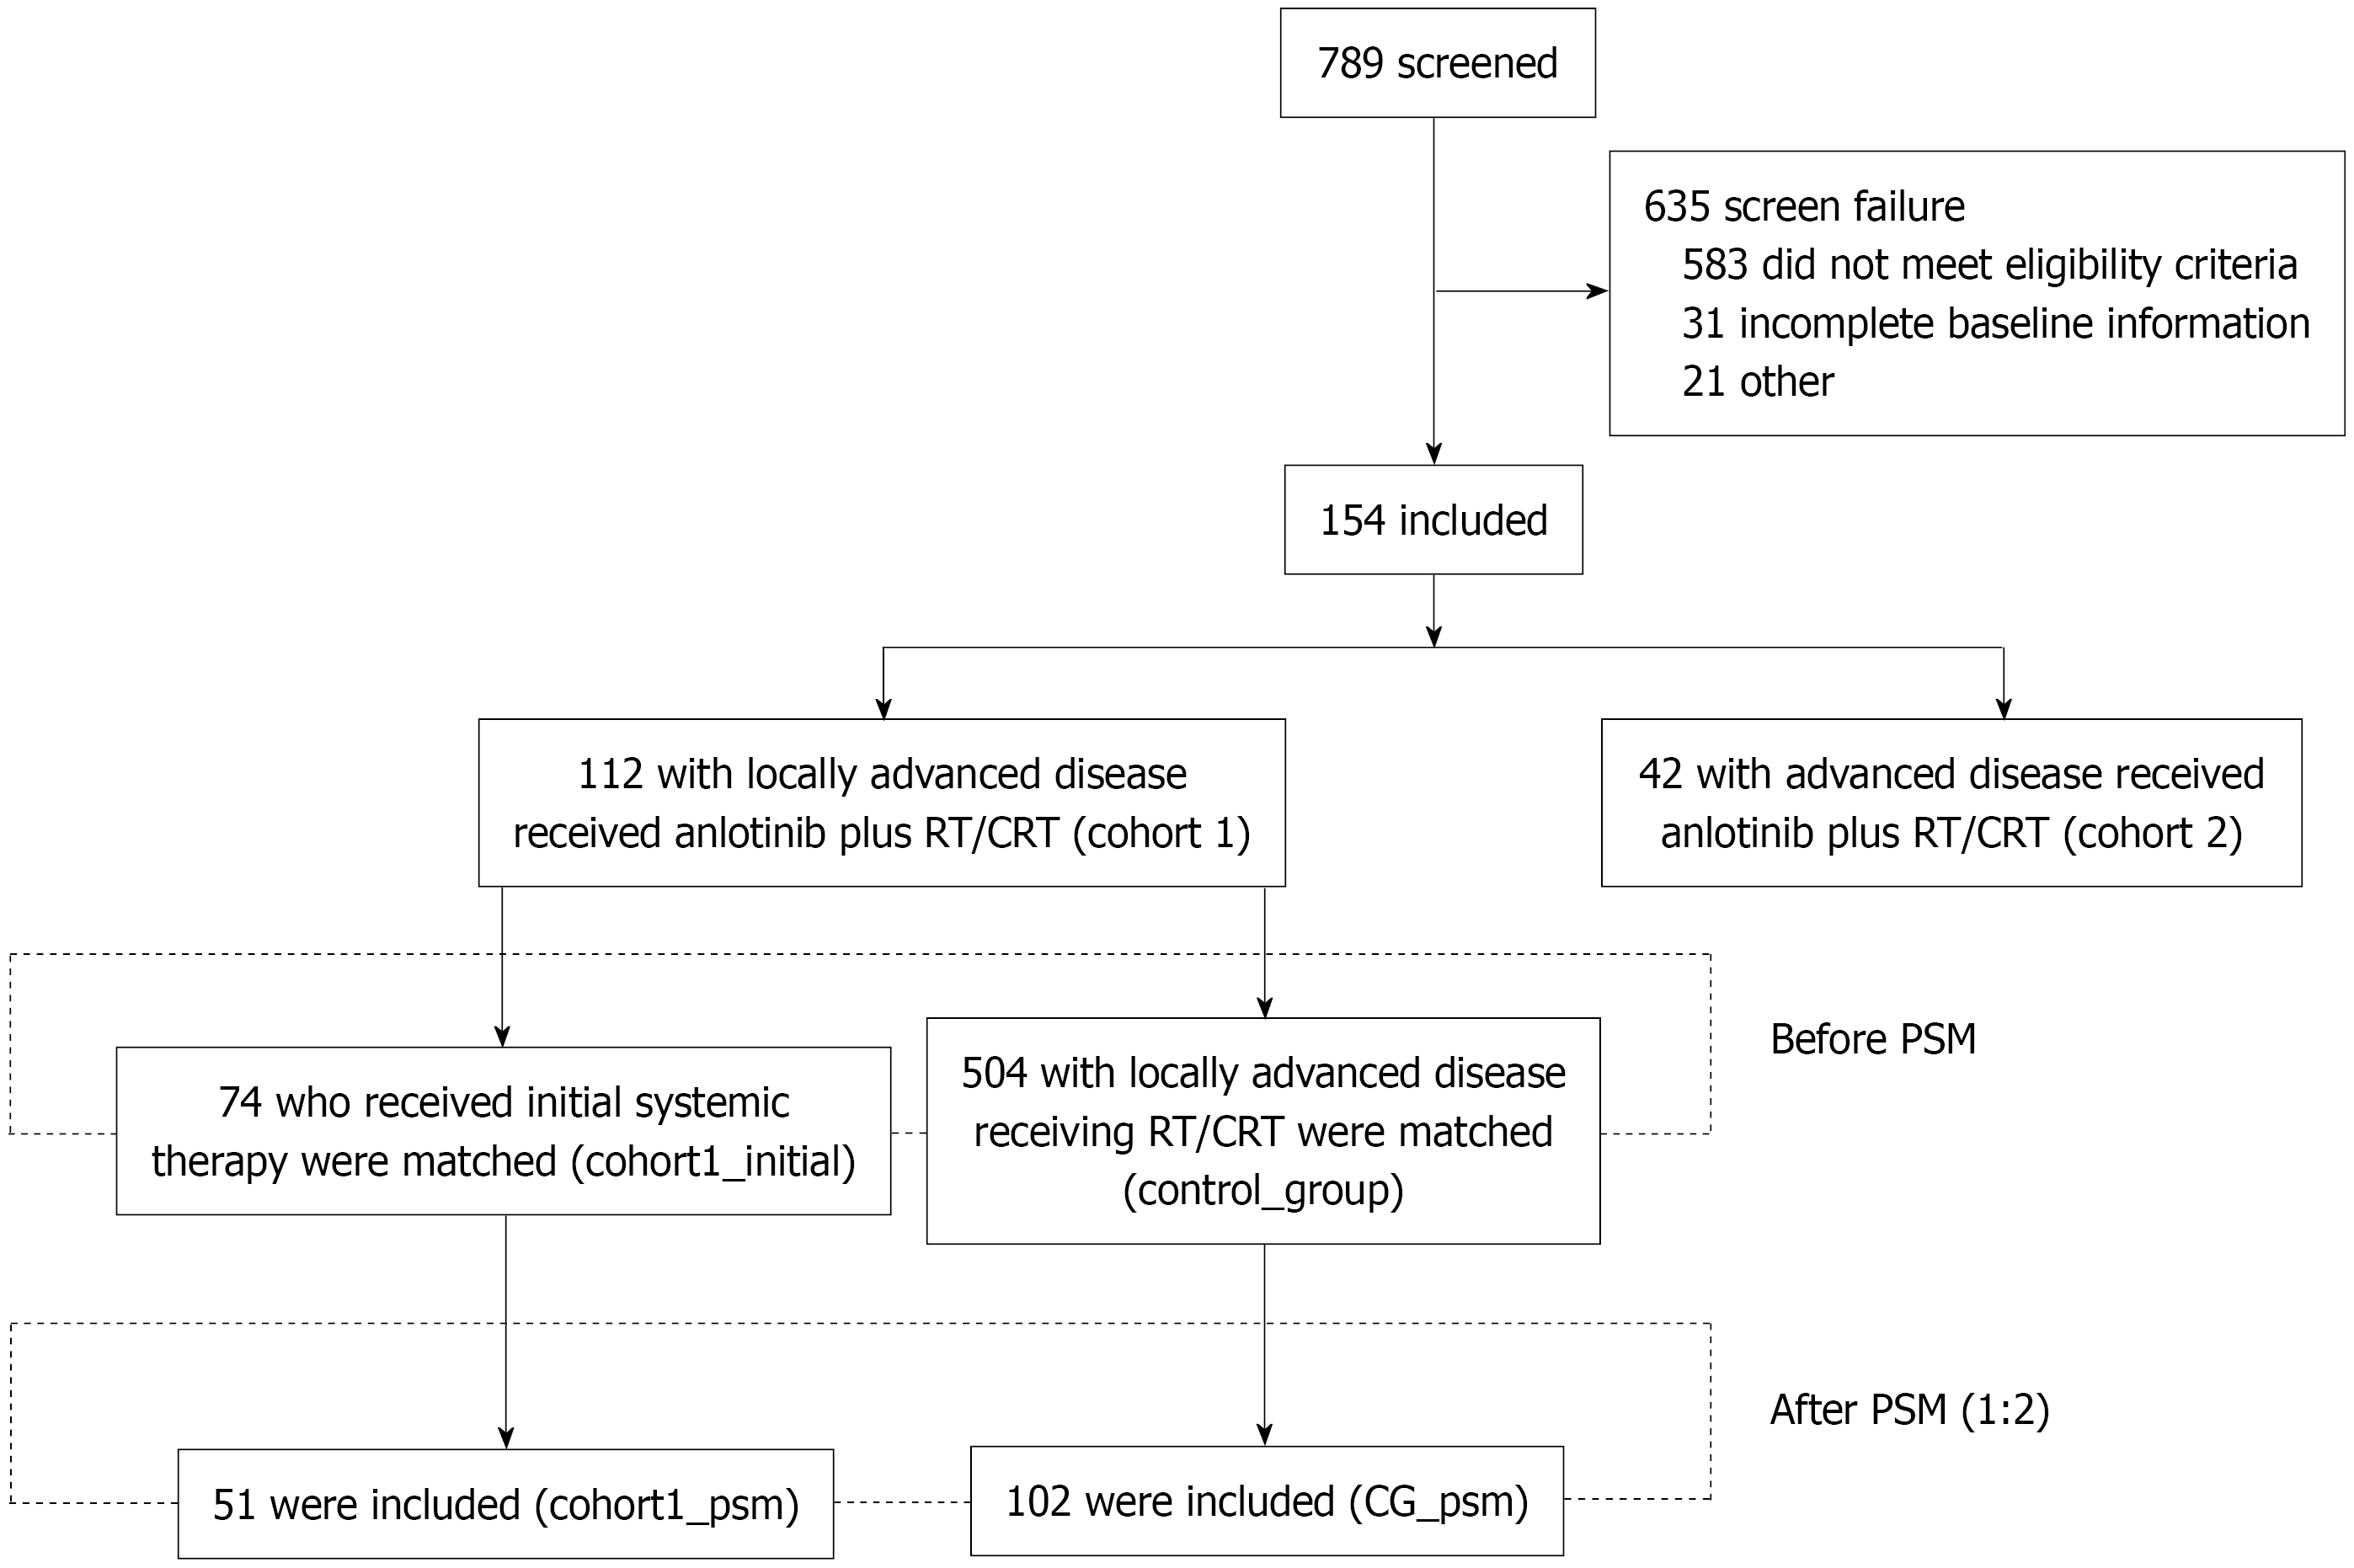
Figure 1 Trial profile.
RT: Radiotherapy; CRT: Chemoradiotherapy; PSM: Propensity score matching; CG: Control group.
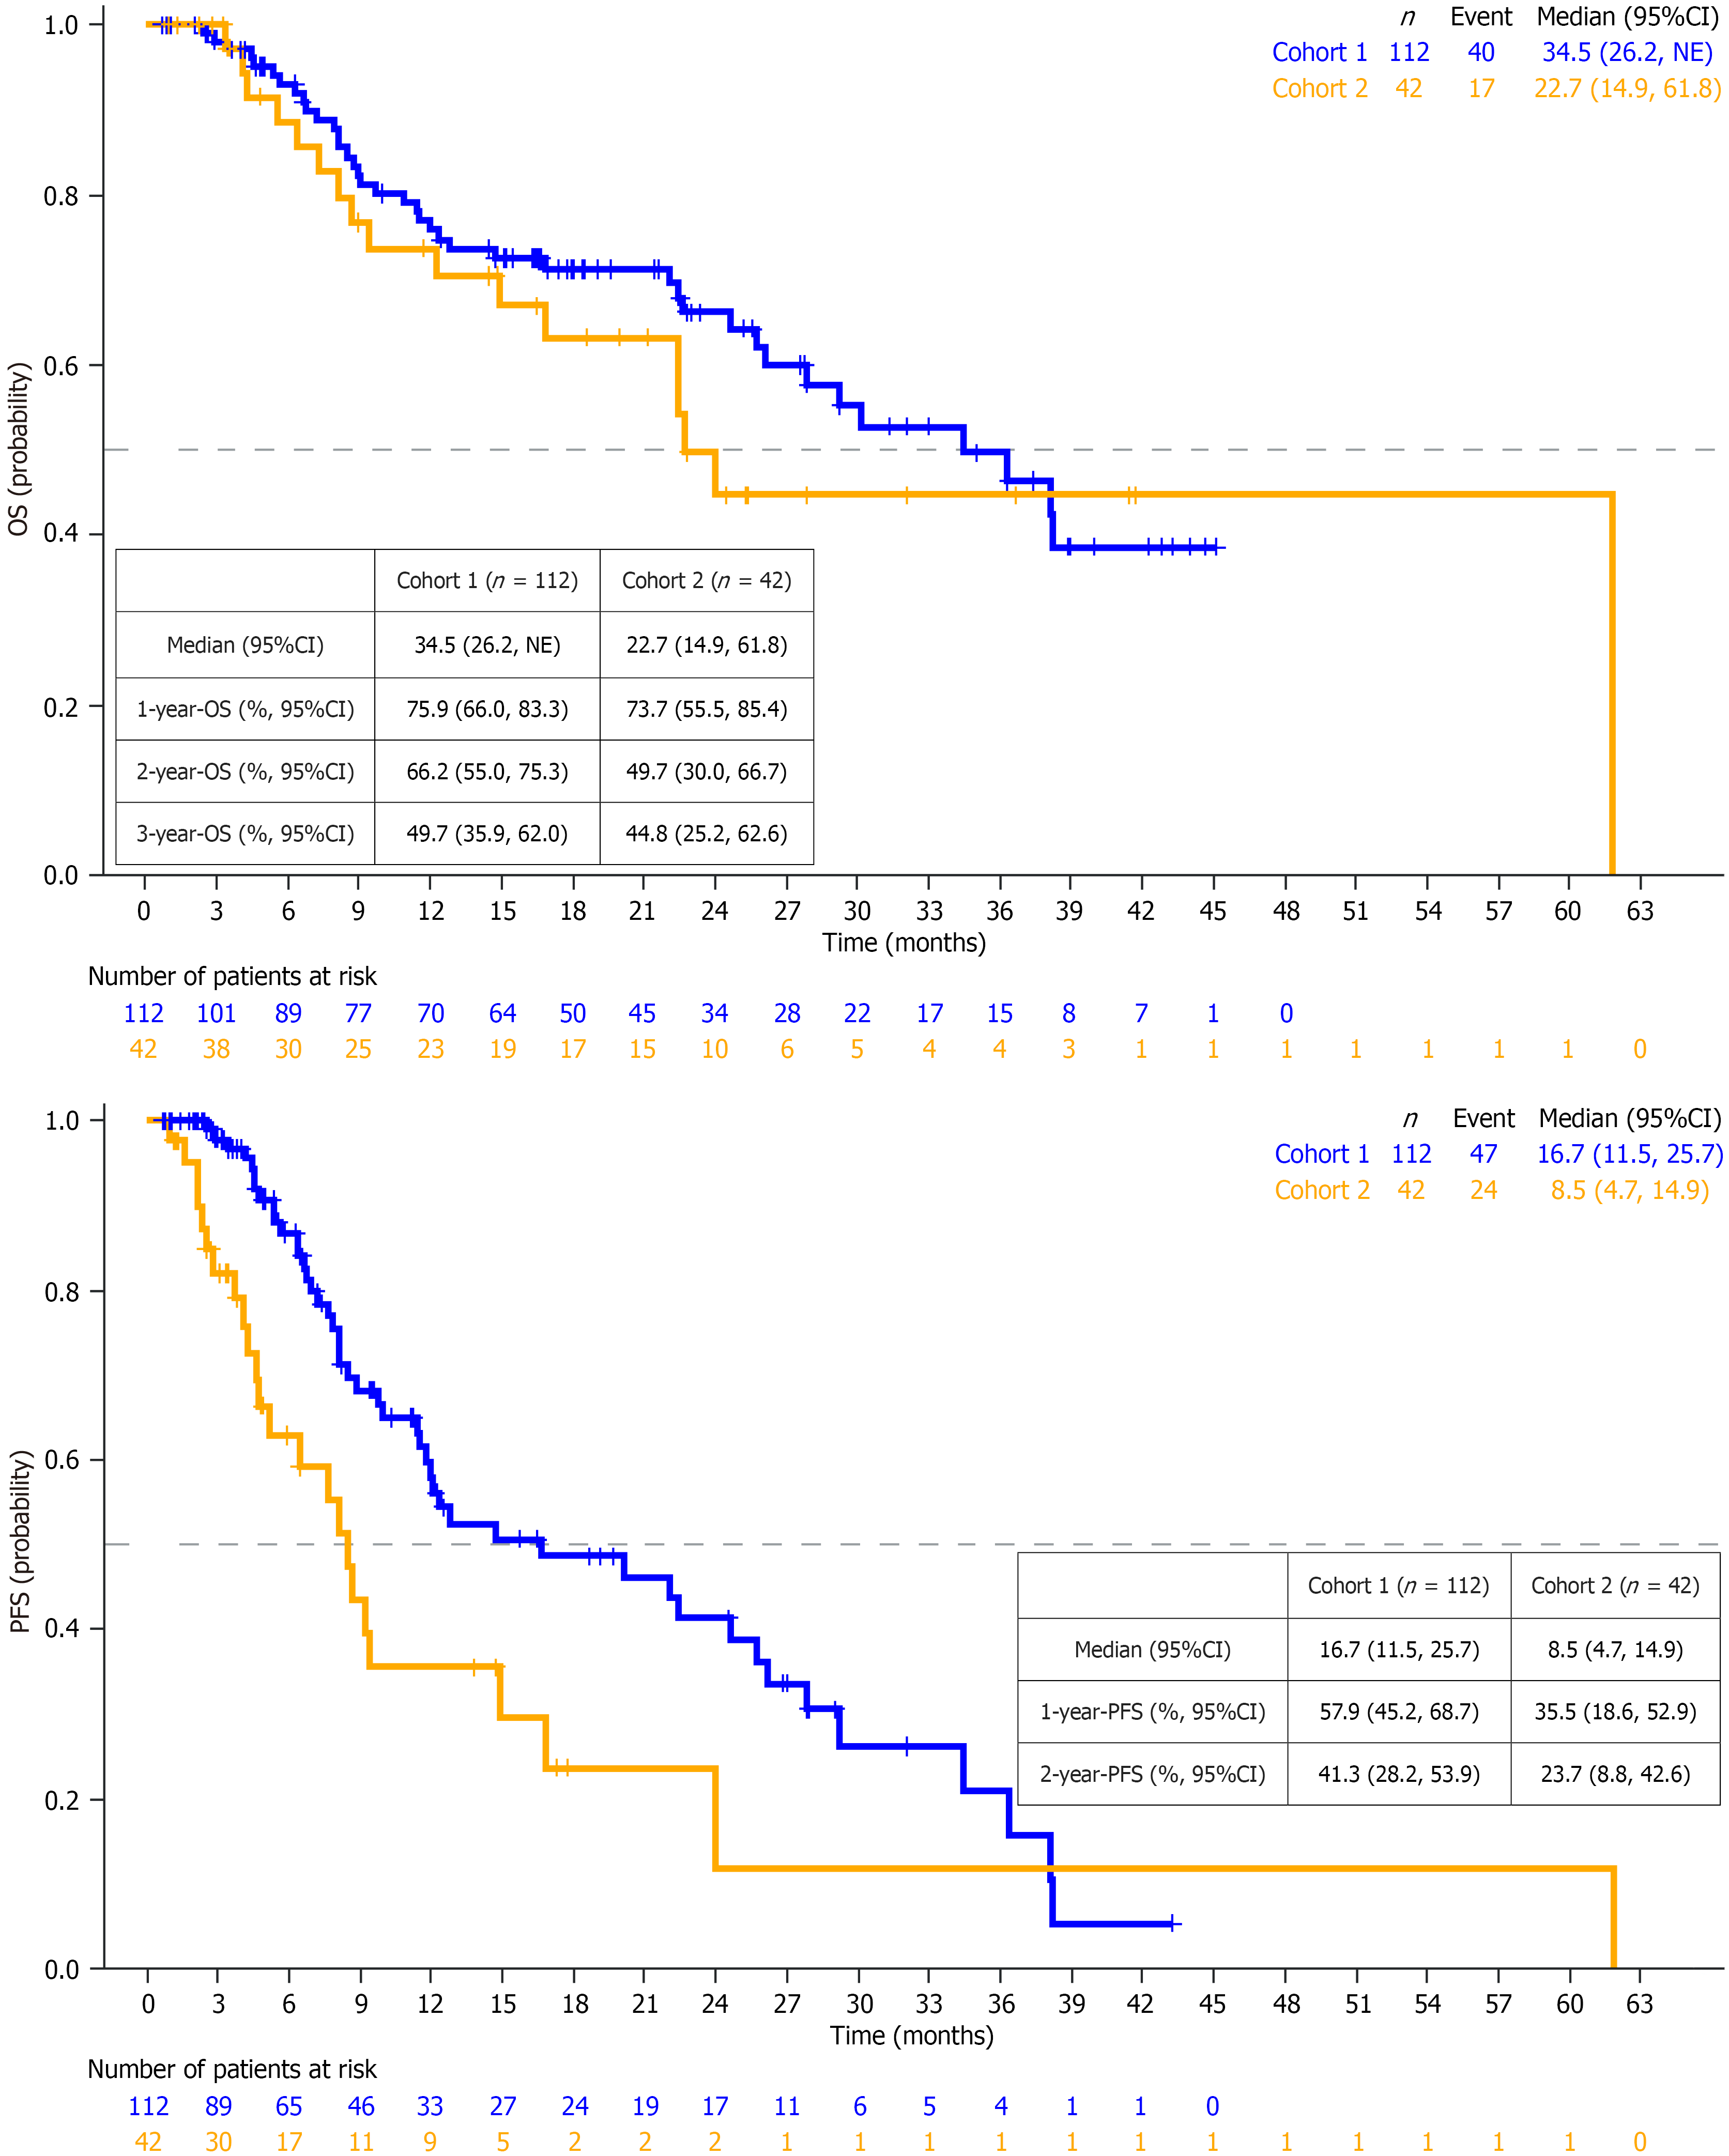
Figure 2 Kaplan-Meier plots for overall survival and progression-free survival between patients with locally advanced (cohort 1) and advanced (cohort 2) esophageal squamous cell carcinoma.
OS: Overall survival; PFS: Progression-free survival; NE: Not estimable; CI: Confidence interval.
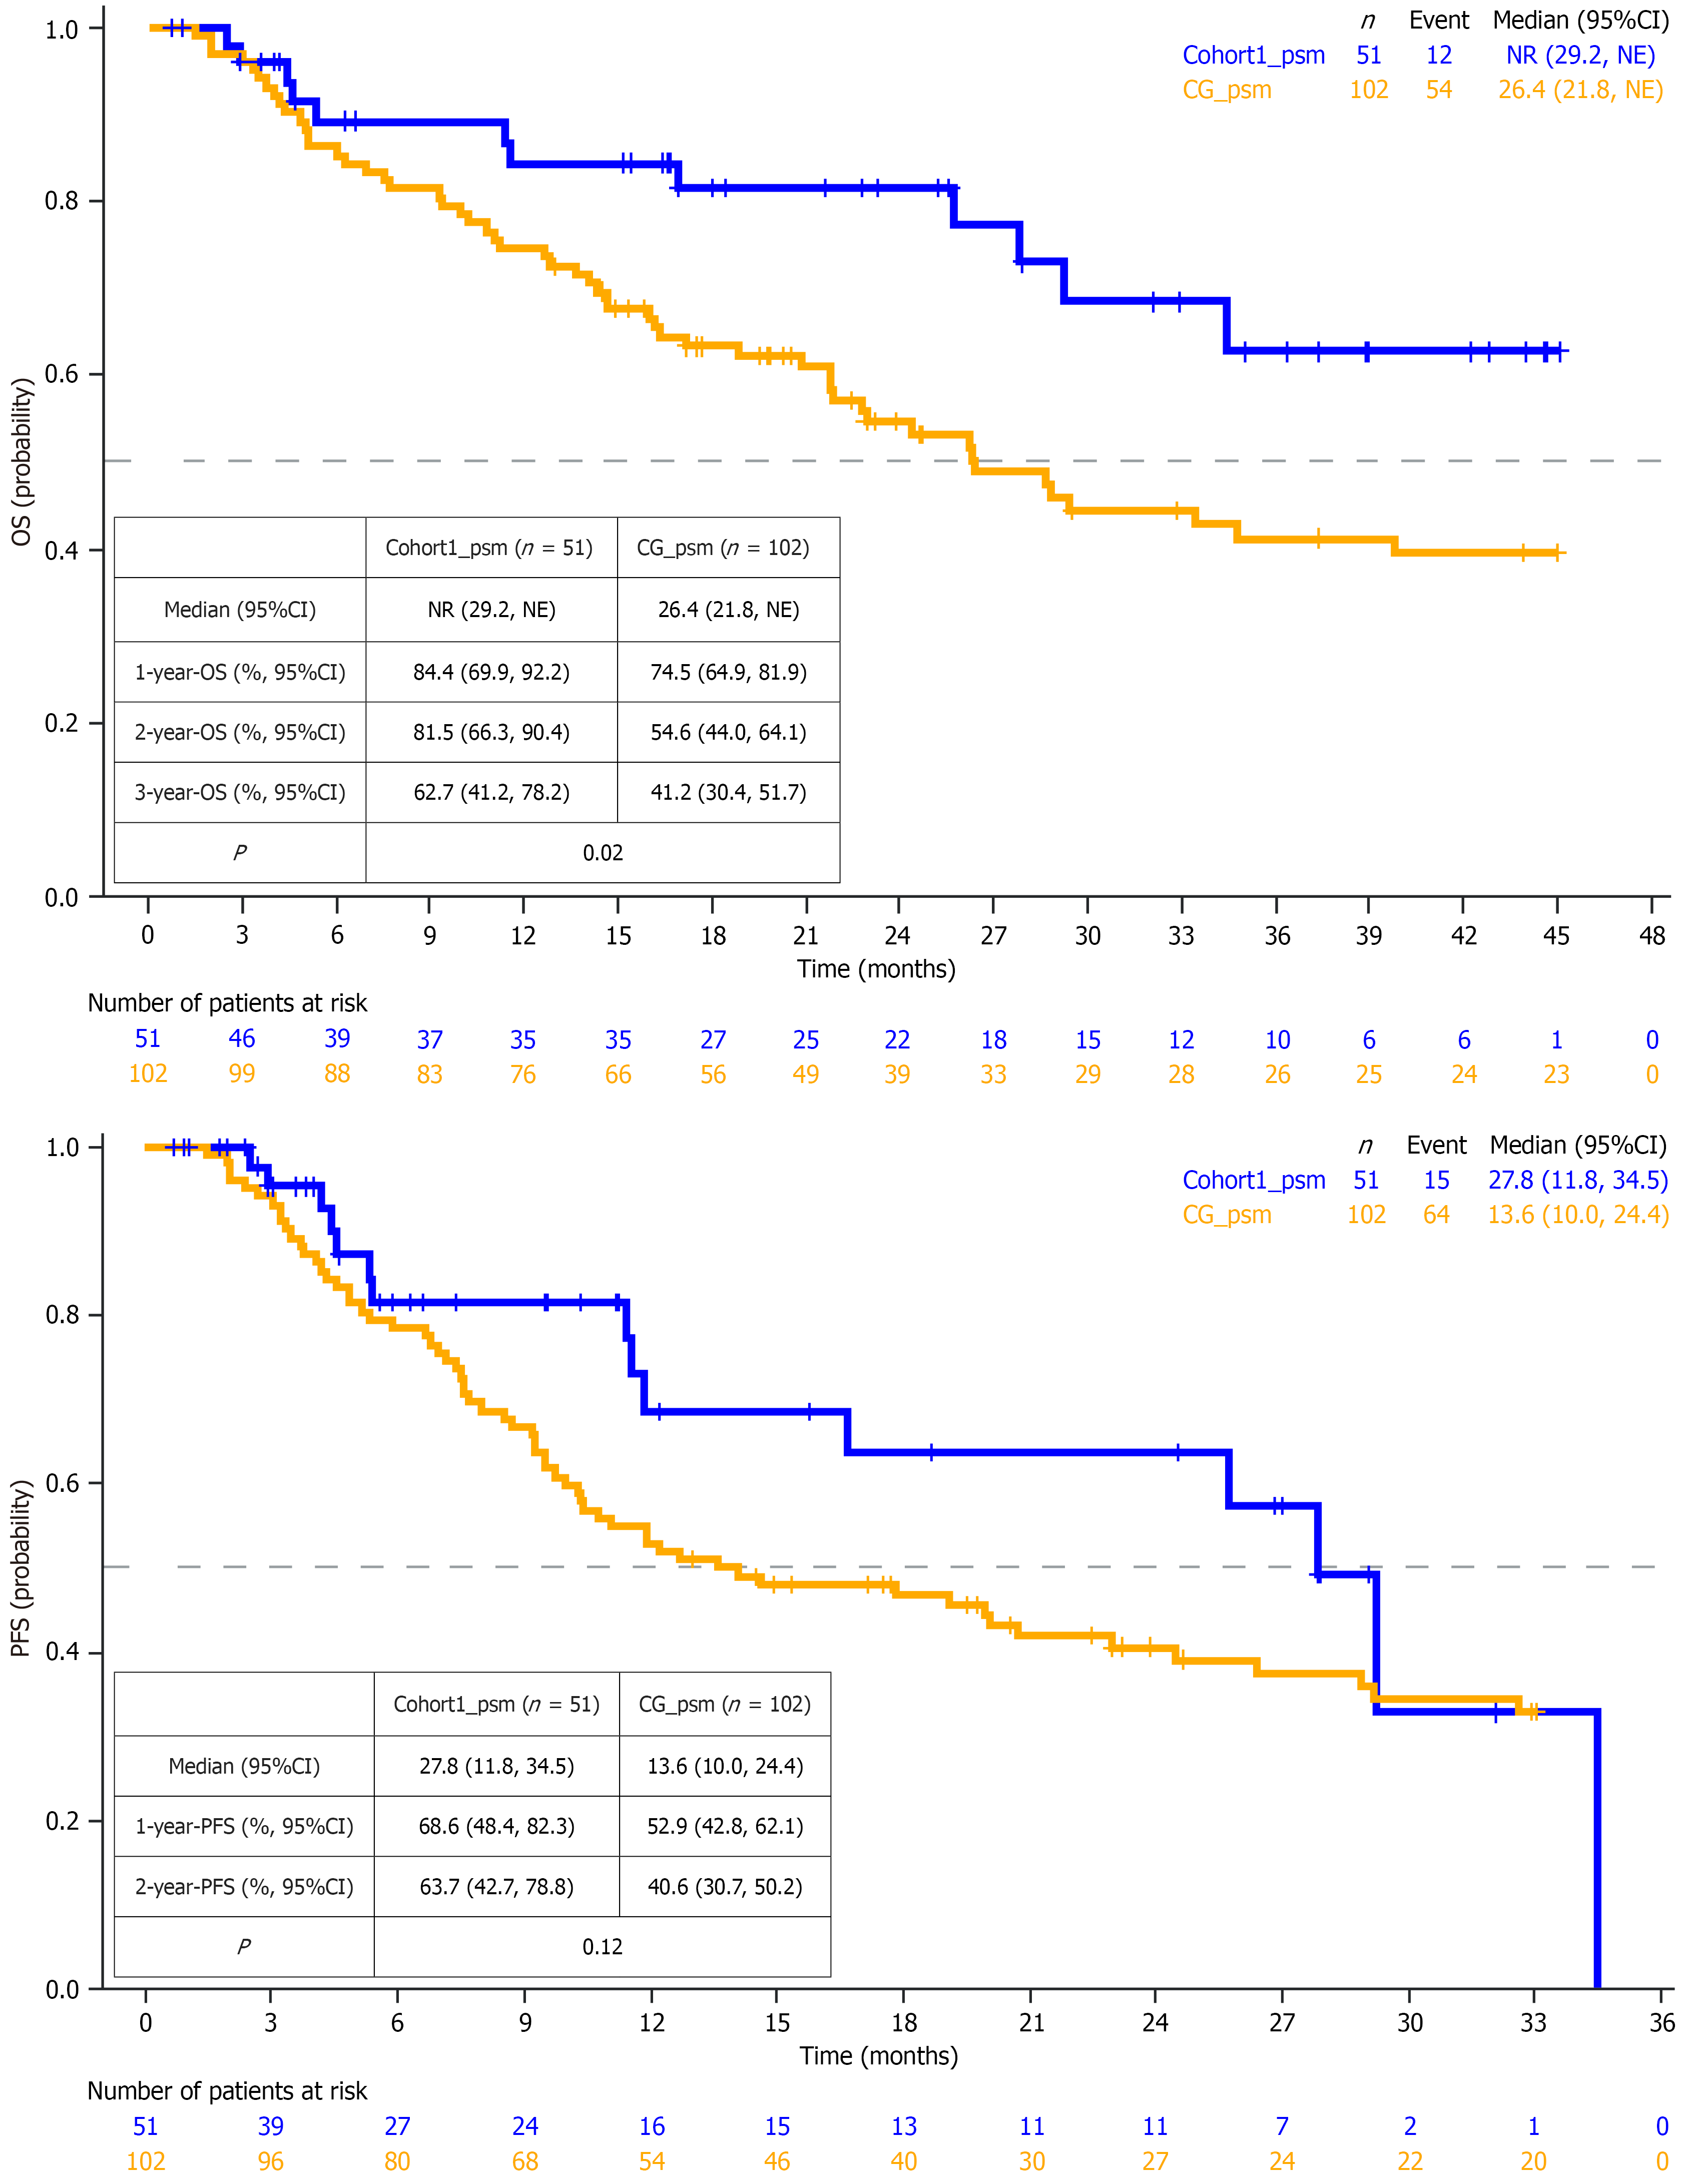
Figure 3 Overall survival and progression-free survival after propensity score matching in patients with locally advanced esophageal squamous cell carcinoma.
OS: Overall survival; PFS: Progression-free survival; NE: Not estimable; CI: Confidence interval; NR: Not reached; CG: Control group.
- Citation: Feng GJ, Fu CR, Wang F, Li JC, Jiang Y, Wang XY, Yang BH, Xu WC, Zhang YW, Cheng XY, Ge XL, Xia XJ, Xi HM, Zhao XS, Ma HB, Zhao XX, Wang X, Li BS. Anlotinib plus radiotherapy or chemoradiotherapy in locally advanced or advanced esophageal squamous cell carcinoma: A multicohort, real-world study. World J Gastroenterol 2027; 33(3): 123331
- URL: https://www.wjgnet.com/1007-9327/full/v33/i3/123331.htm
- DOI: https://dx.doi.org/10.3748/wjg.123331