
















Copyright: ©Author(s) 2027.
World J Gastroenterol. Jan 7, 2027; 33(1): 123590
Published online Jan 7, 2027. doi: 10.3748/wjg.123590
Published online Jan 7, 2027. doi: 10.3748/wjg.123590
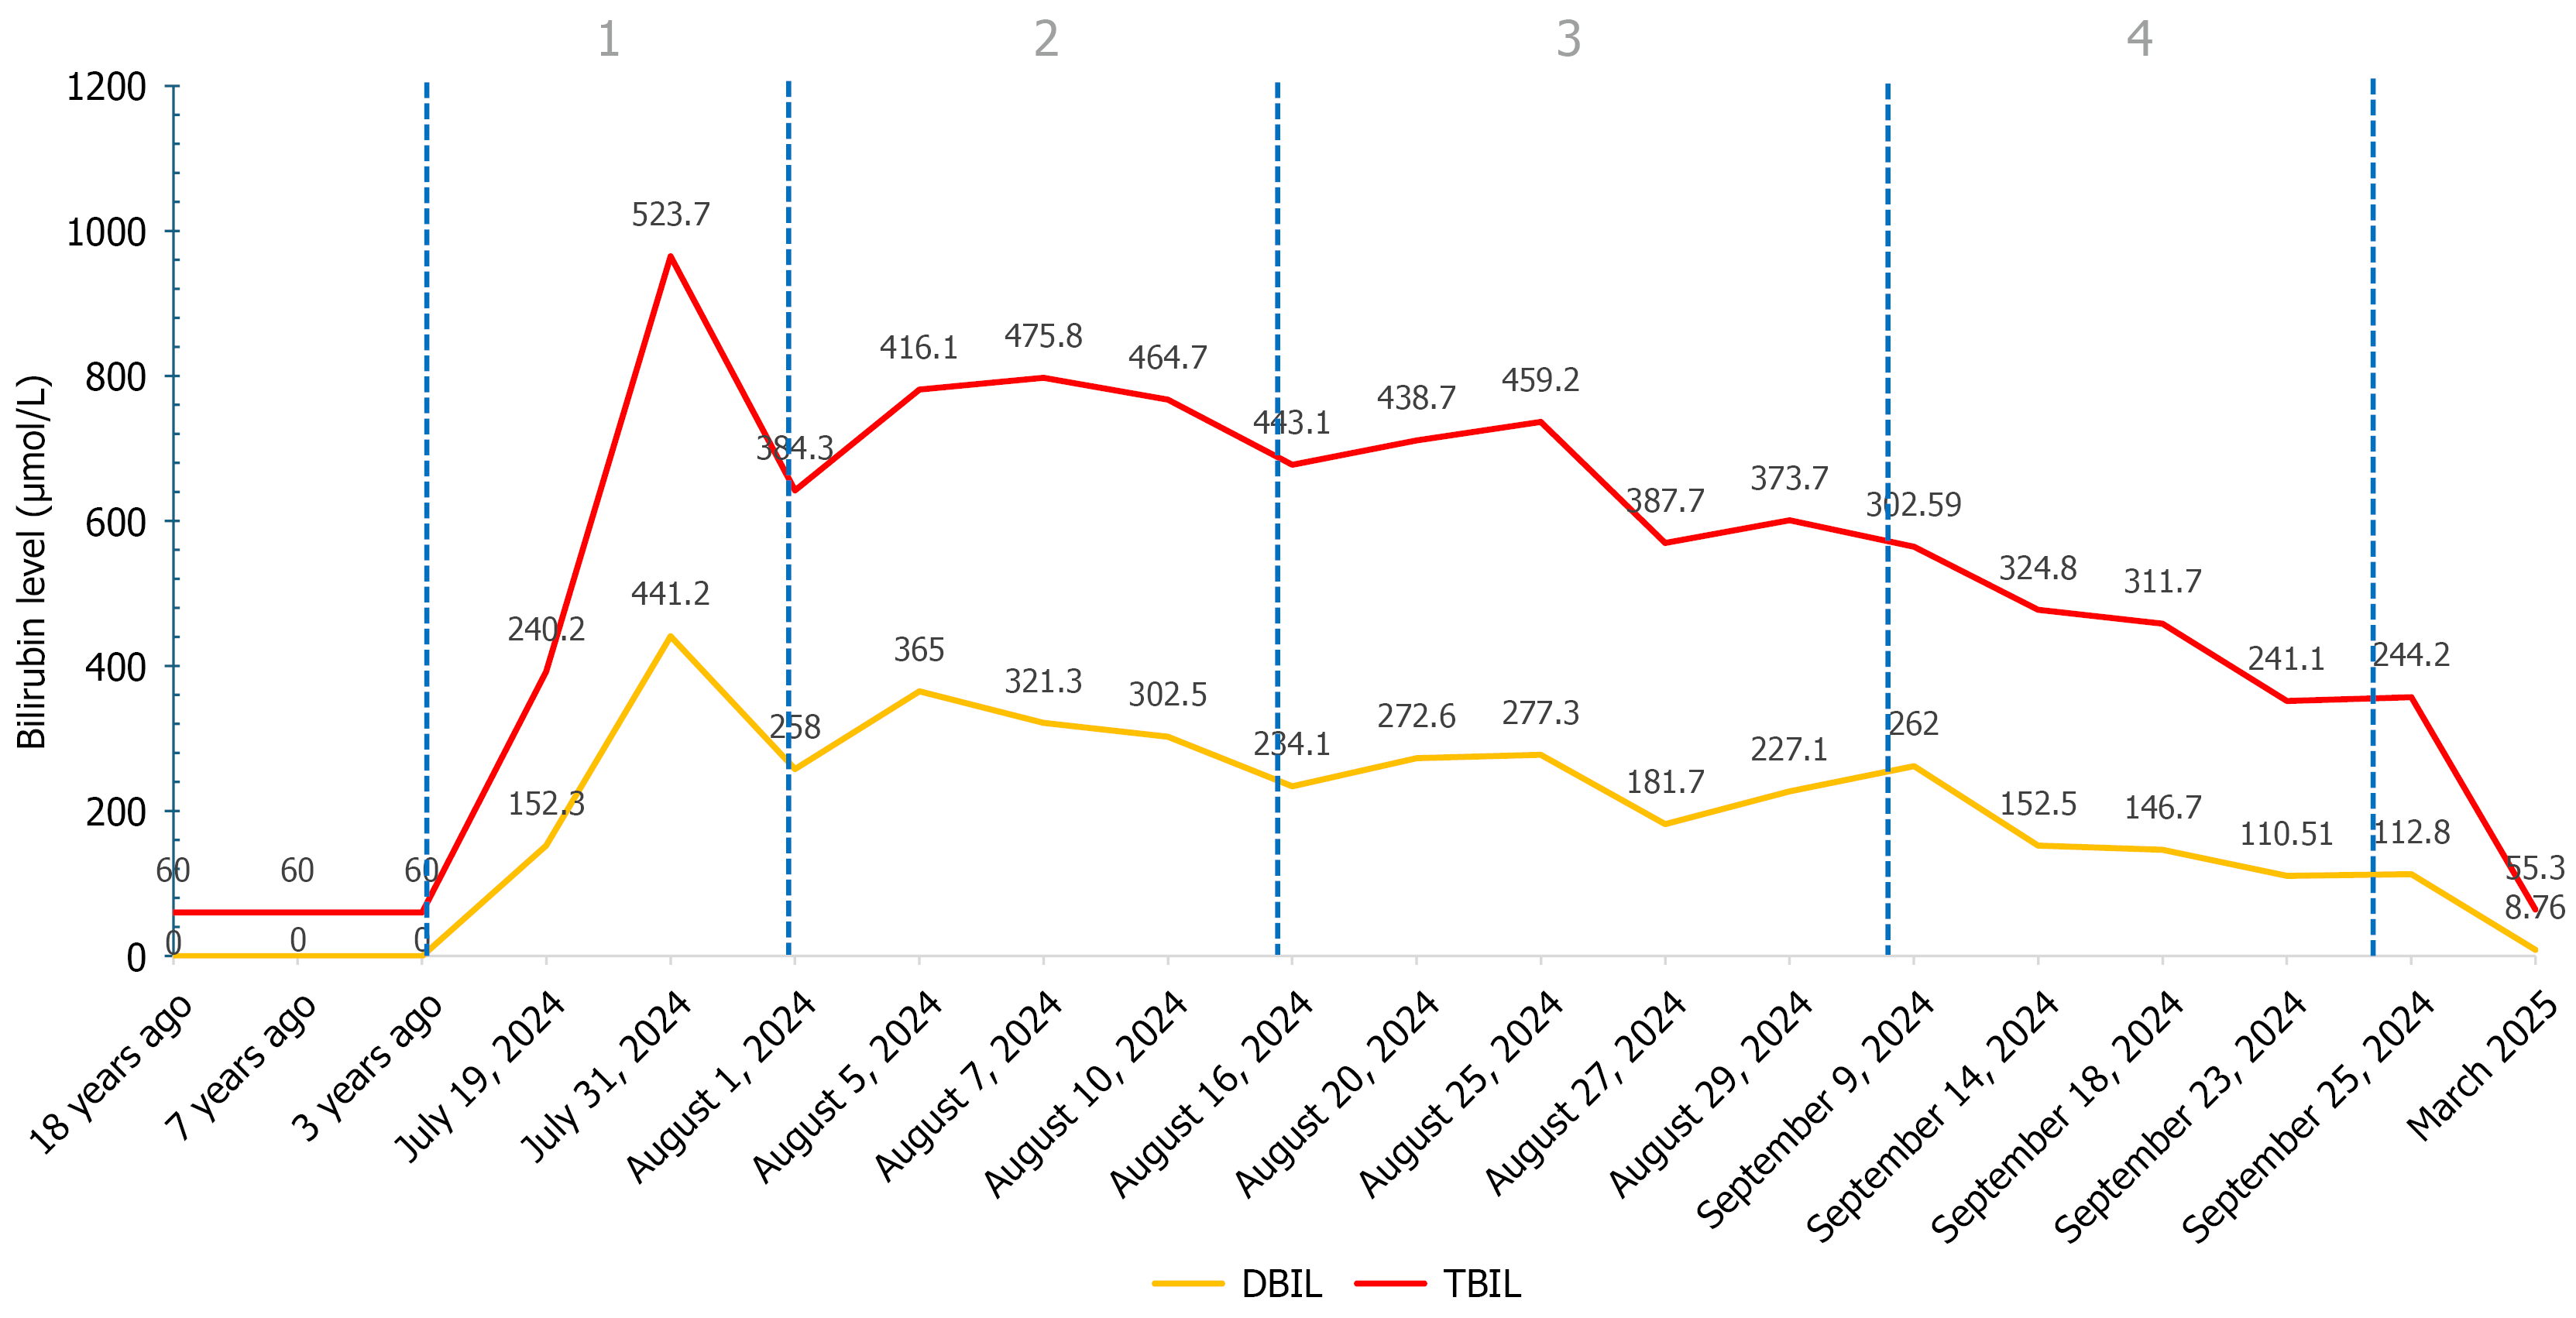
Figure 1 Dynamic changes of bilirubin during the course of the patient's illness.
DBIL: Direct bilirubin; TBIL: Total bilirubin.
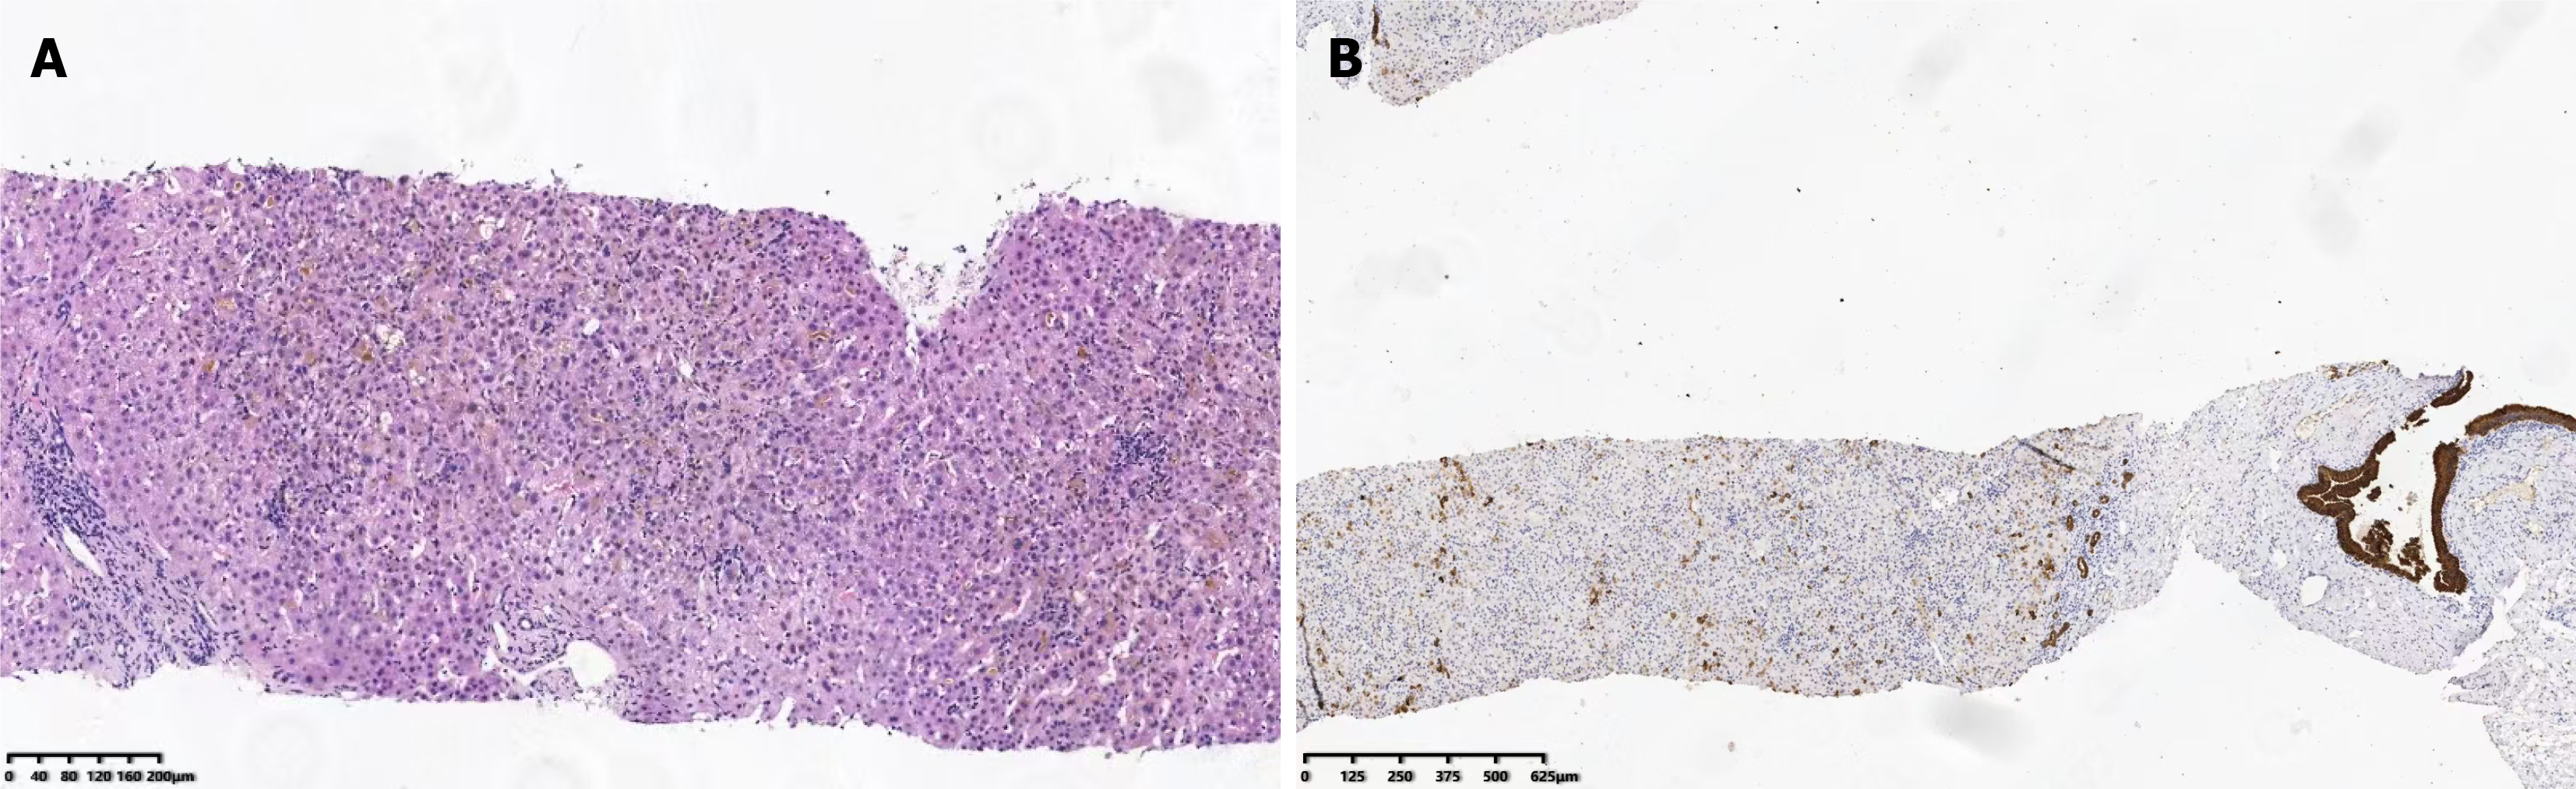
Figure 2 Representative histopathological findings of the liver biopsy.
A: Hematoxylin and eosin staining showed preserved hepatic plate architecture, prominent intrahepatocellular and canalicular cholestasis with bile thrombi, hepatocellular swelling and degeneration, and focal spotty necrosis; B: Cytokeratin 7 immunostaining highlighted biliary epithelial and ductular changes, supporting bile duct injury in a cholestatic pattern.
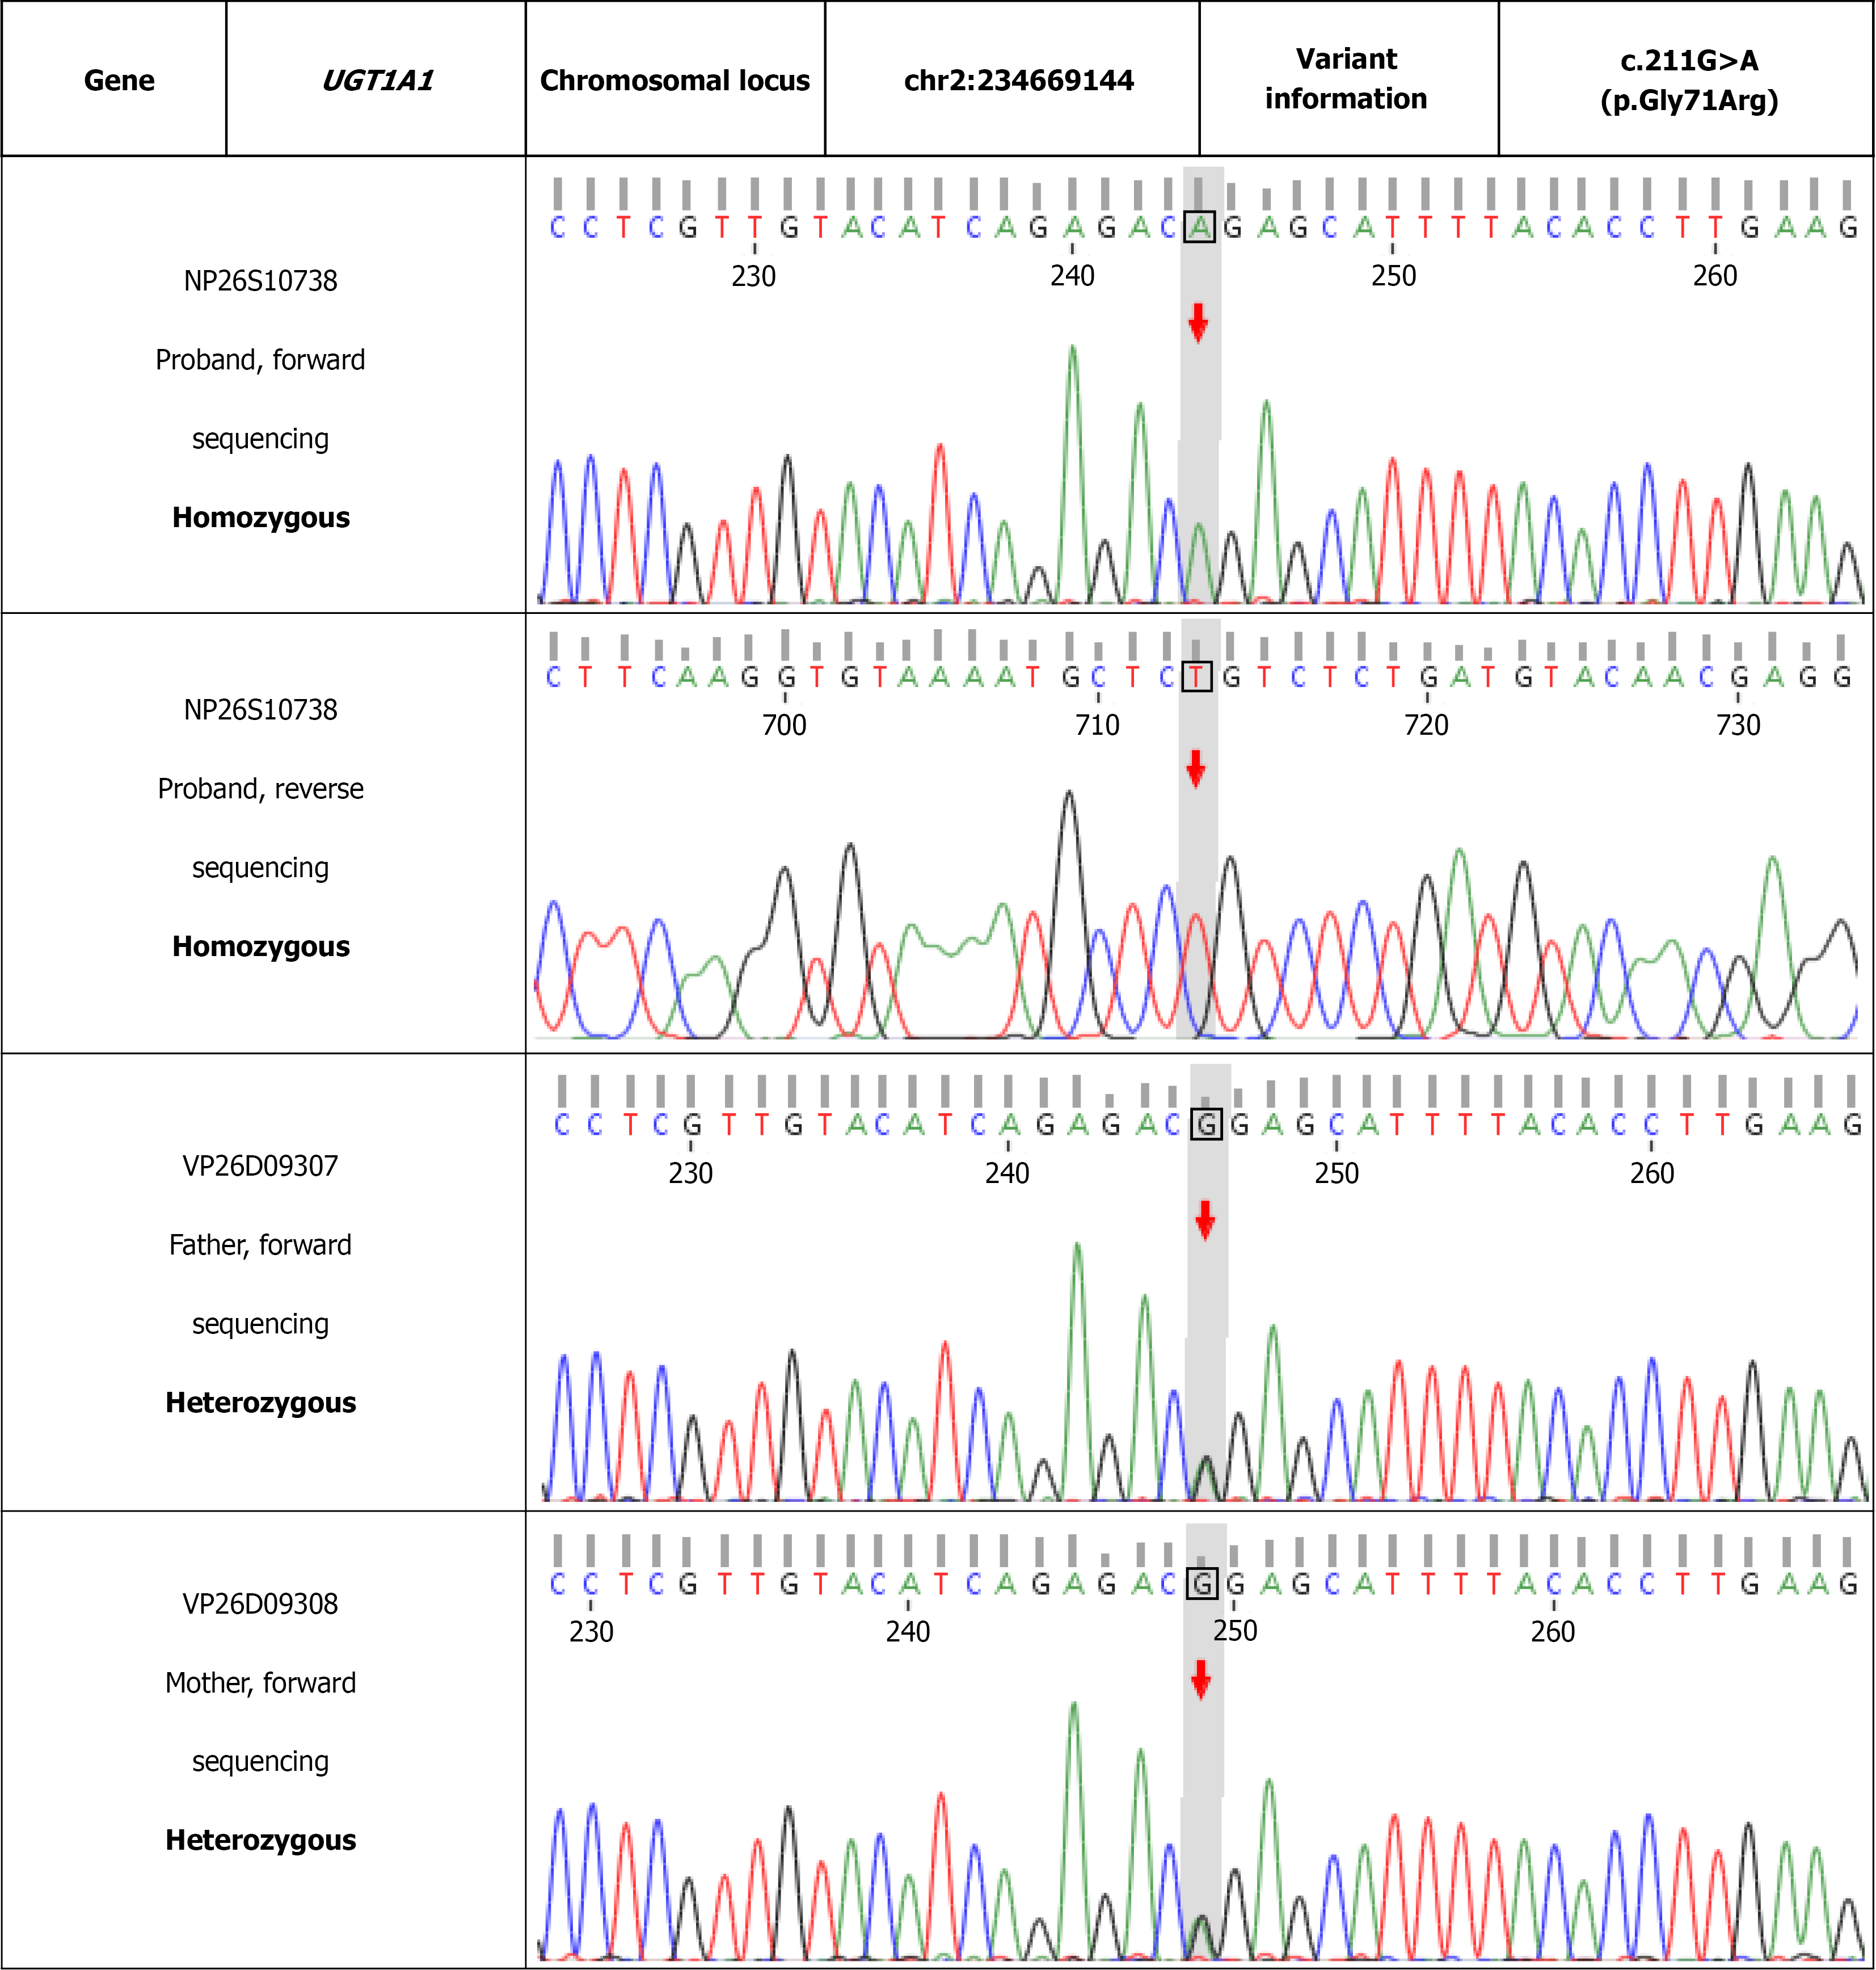
Figure 3 Genetic analysis of the UGT1A1 mutation.
Pedigree showing biparental inheritance of the c.211G>A variant. Sanger sequencing chromatograms confirming homozygosity in the proband (c.211A/A) and heterozygosity in both parents (c.211G/A).
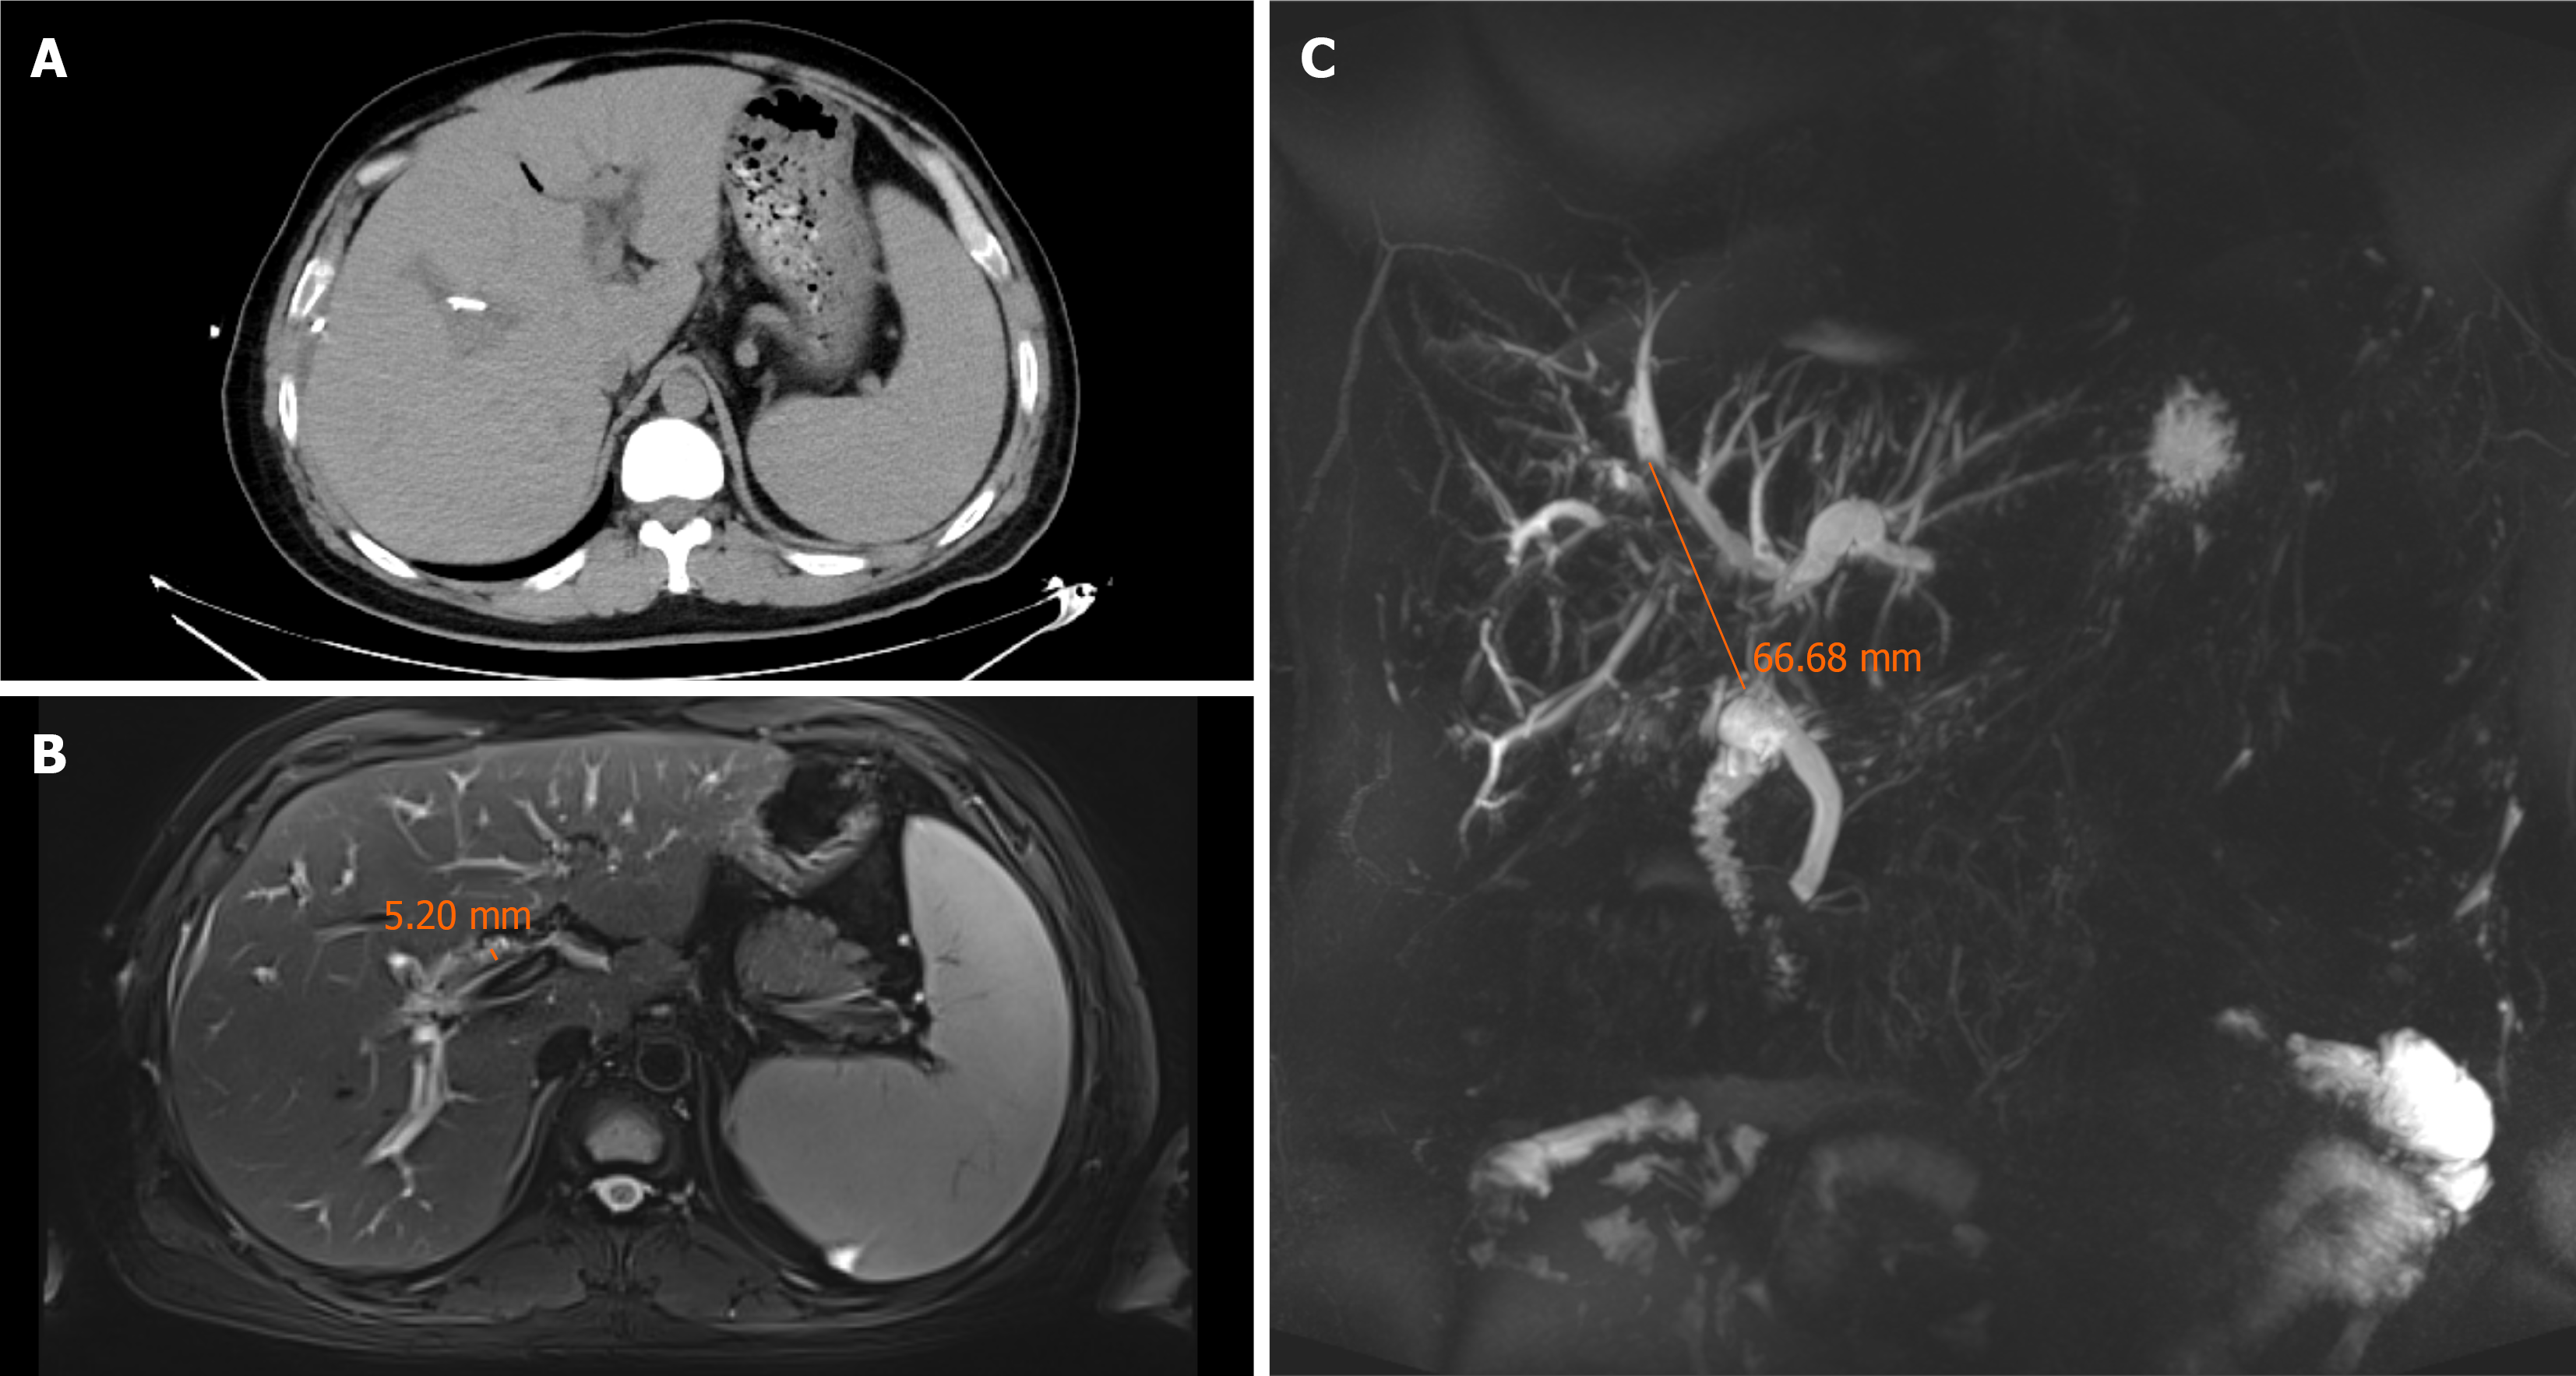
Figure 4 Abdominal computed tomography, magnetic resonance imaging, and magnetic resonance cholangiopancreatography findings before third endoscopic retrograde cholangiopancreatography.
A: Axial abdominal computed tomography shows pneumobilia in the intrahepatic bile ducts and dilatation of the portal vein; B: Axial abdominal magnetic resonance imaging shows multiple hypointense intraductal lesions within the hepatic ducts and common bile duct (CBD), with the largest measuring approximately 5.2 mm in diameter; C: Coronal maximum-intensity projection magnetic resonance cholan
- Citation: Cheng H, Hu LH, Wang GQ, Huo N, Wang Y. Gilbert syndrome masked by recurrent choledocholithiasis: A case report. World J Gastroenterol 2027; 33(1): 123590
- URL: https://www.wjgnet.com/1007-9327/full/v33/i1/123590.htm
- DOI: https://dx.doi.org/10.3748/wjg.123590