
















Copyright: ©Author(s) 2026.
World J Gastroenterol. Nov 14, 2026; 32(42): 121556
Published online Nov 14, 2026. doi: 10.3748/wjg.121556
Published online Nov 14, 2026. doi: 10.3748/wjg.121556
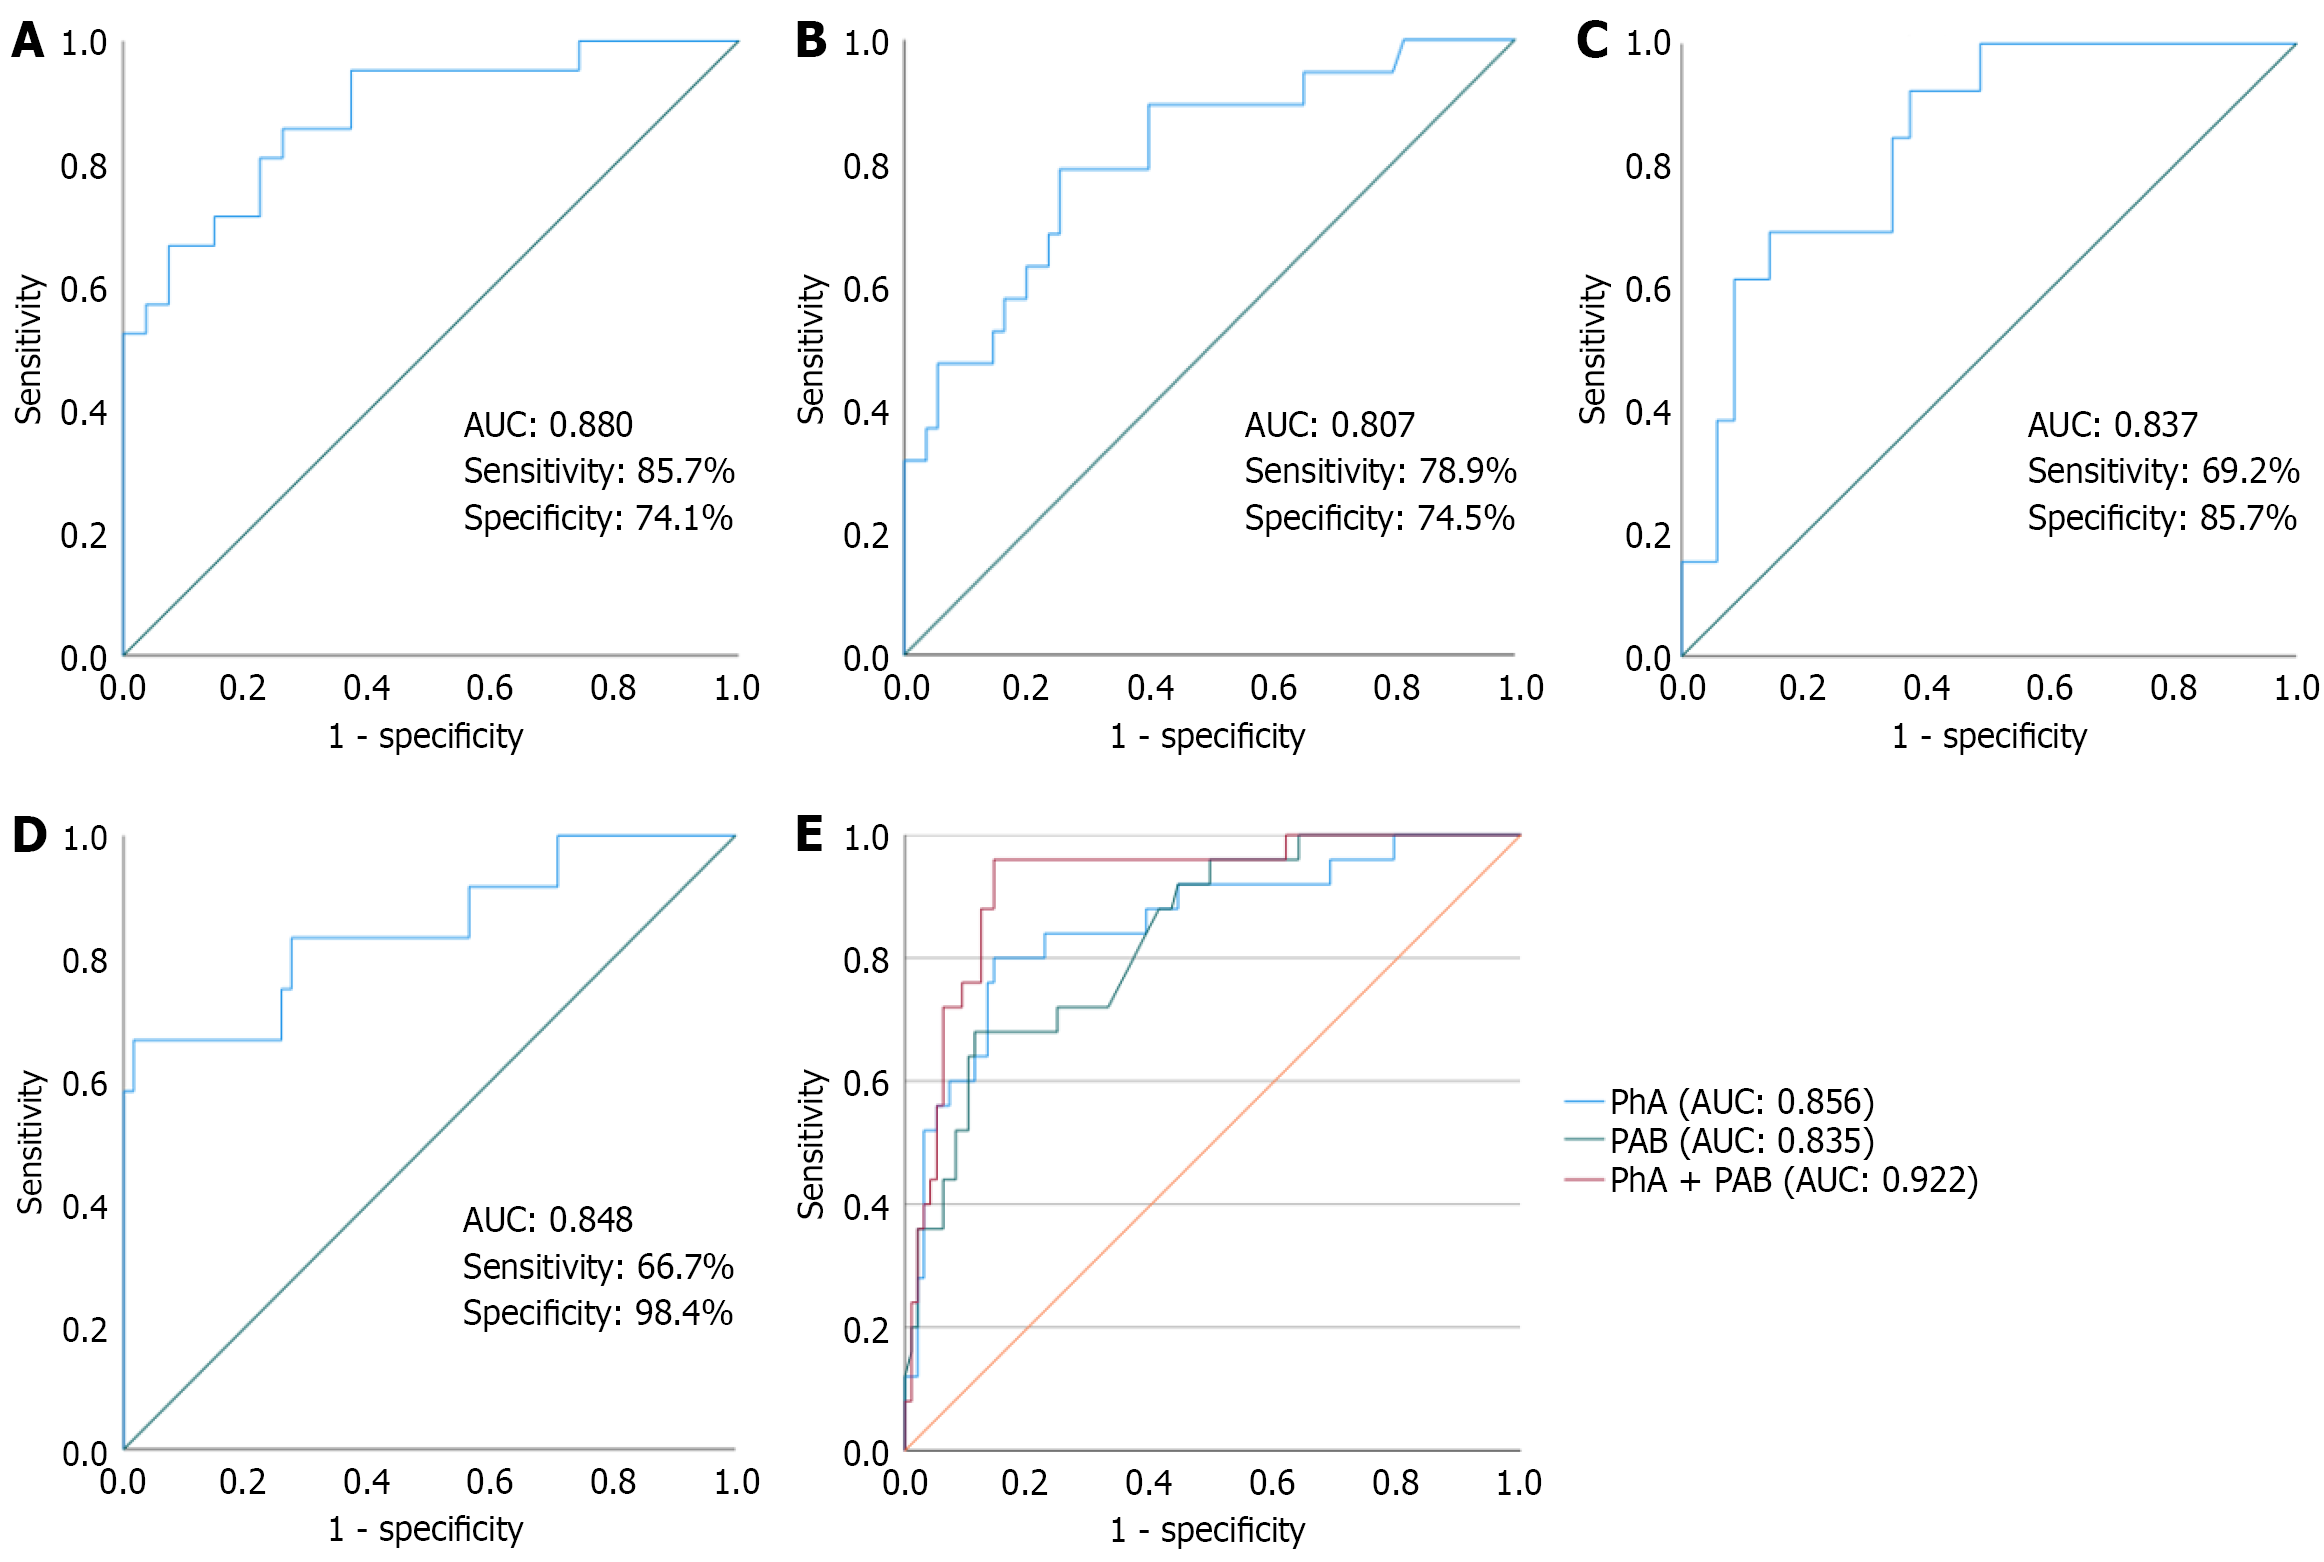
Figure 1 Receiver operating characteristic curves for malnutrition and sarcopenia in ulcerative colitis patients.
A: Phase angle (PhA) values for malnutrition in females; B: PhA values for malnutrition in males; C: PhA values for sarcopenia in females; D: PhA values for sarcopenia in males; E: Different predictive indicators value for sarcopenia. PhA: Phase angle; PAB: Prealbumin; AUC: Area under the curve.
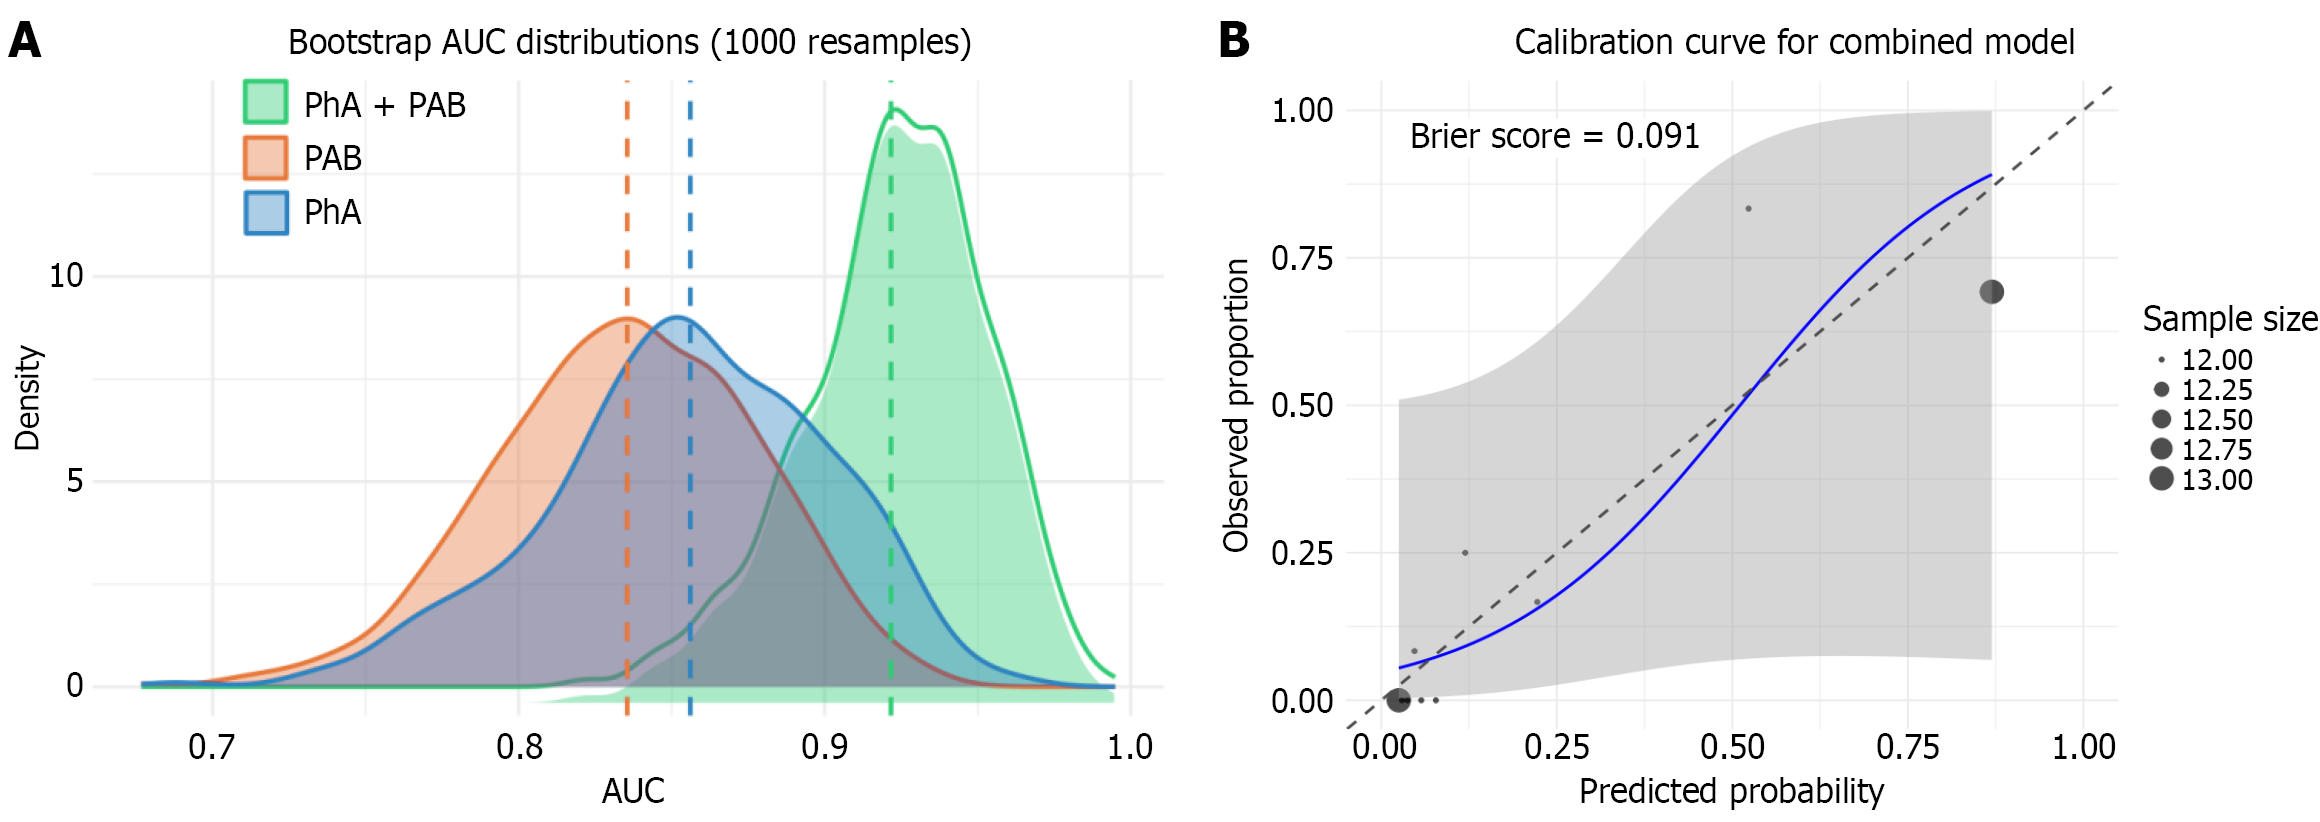
Figure 2 Bootstrap internal validation of the combined model for predicting sarcopenia.
A: Bootstrap area under the curve distributions based on 1000 resamples; B: Calibration curve for the combined model.
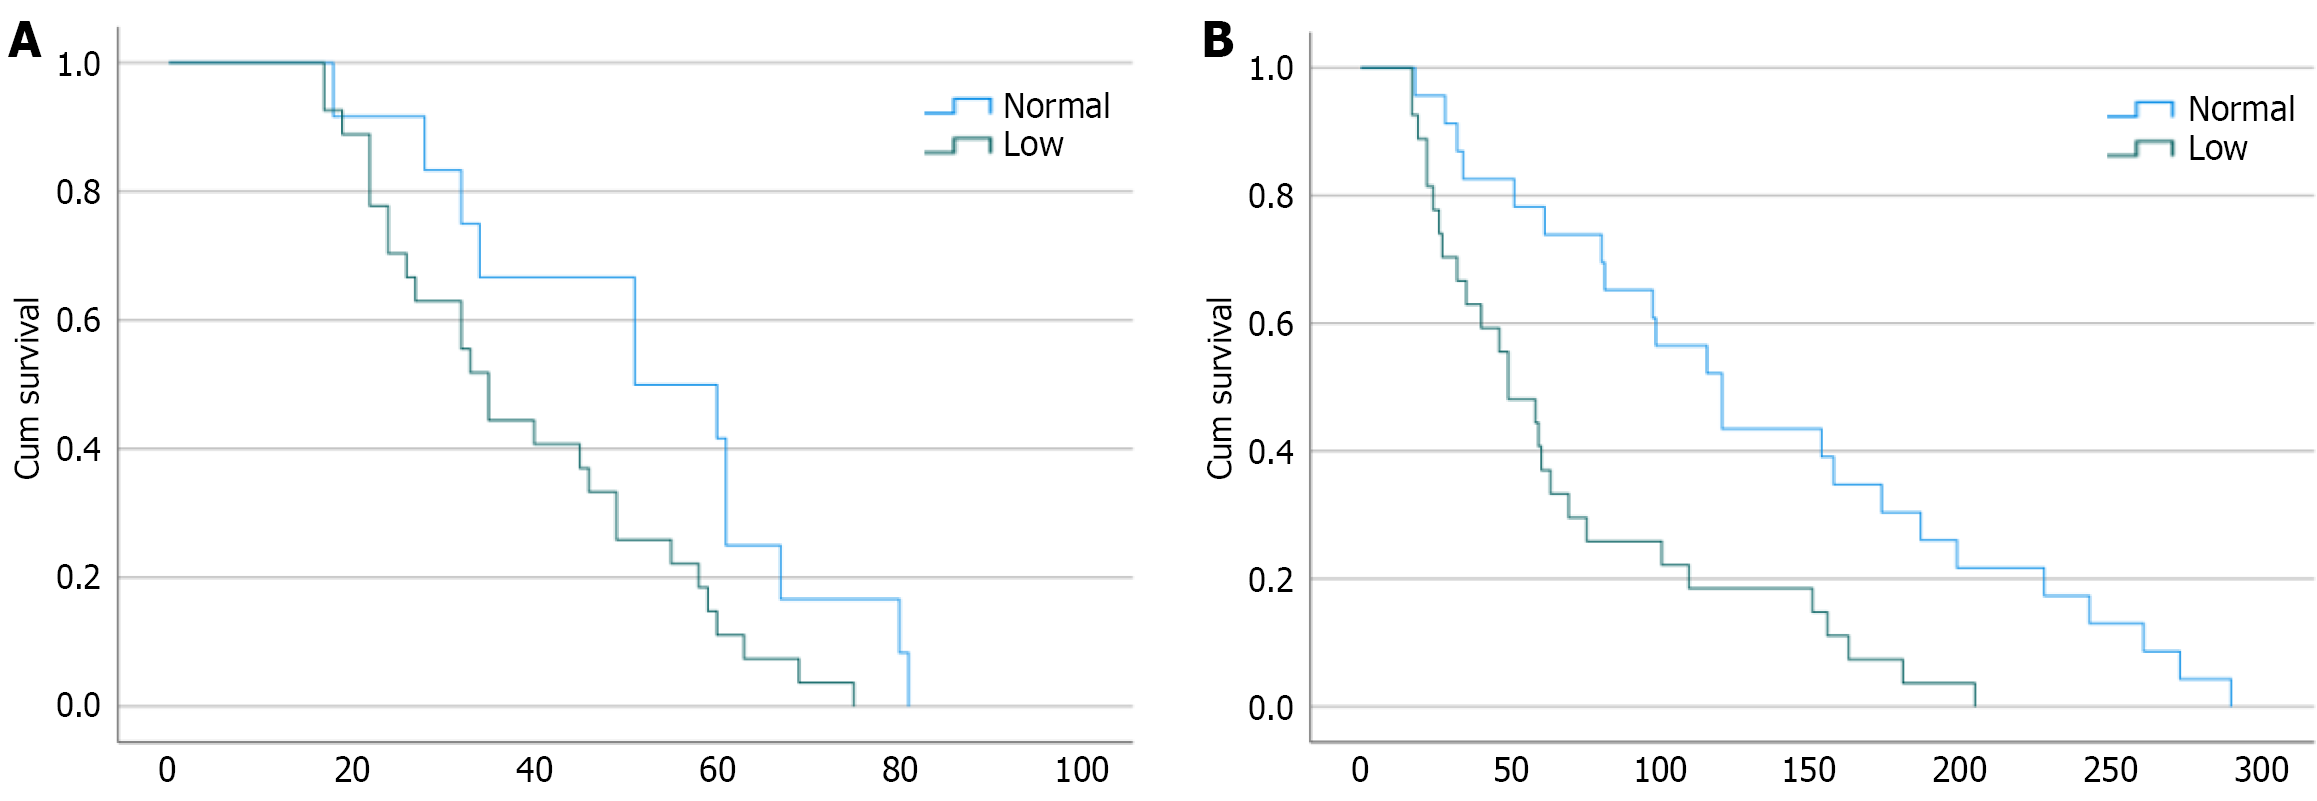
Figure 3 Kaplan-Meier curve for readmission intervals in ulcerative colitis patients.
A: Time between readmission during 12 weeks; B: Time between readmission during 54 weeks.
- Citation: Wang HY, Liu RJ, Wang YY, Wang DD, Zhang H, Zhang LJ, Jing X, Guo YJ, Li HQ, Liu AL, Ding XL. Phase angle as a predictor of malnutrition, sarcopenia, and adverse clinical outcomes in hospitalized patients with ulcerative colitis. World J Gastroenterol 2026; 32(42): 121556
- URL: https://www.wjgnet.com/1007-9327/full/v32/i42/121556.htm
- DOI: https://dx.doi.org/10.3748/wjg.121556