
















Copyright: ©Author(s) 2026.
World J Gastroenterol. Nov 14, 2026; 32(42): 120476
Published online Nov 14, 2026. doi: 10.3748/wjg.120476
Published online Nov 14, 2026. doi: 10.3748/wjg.120476
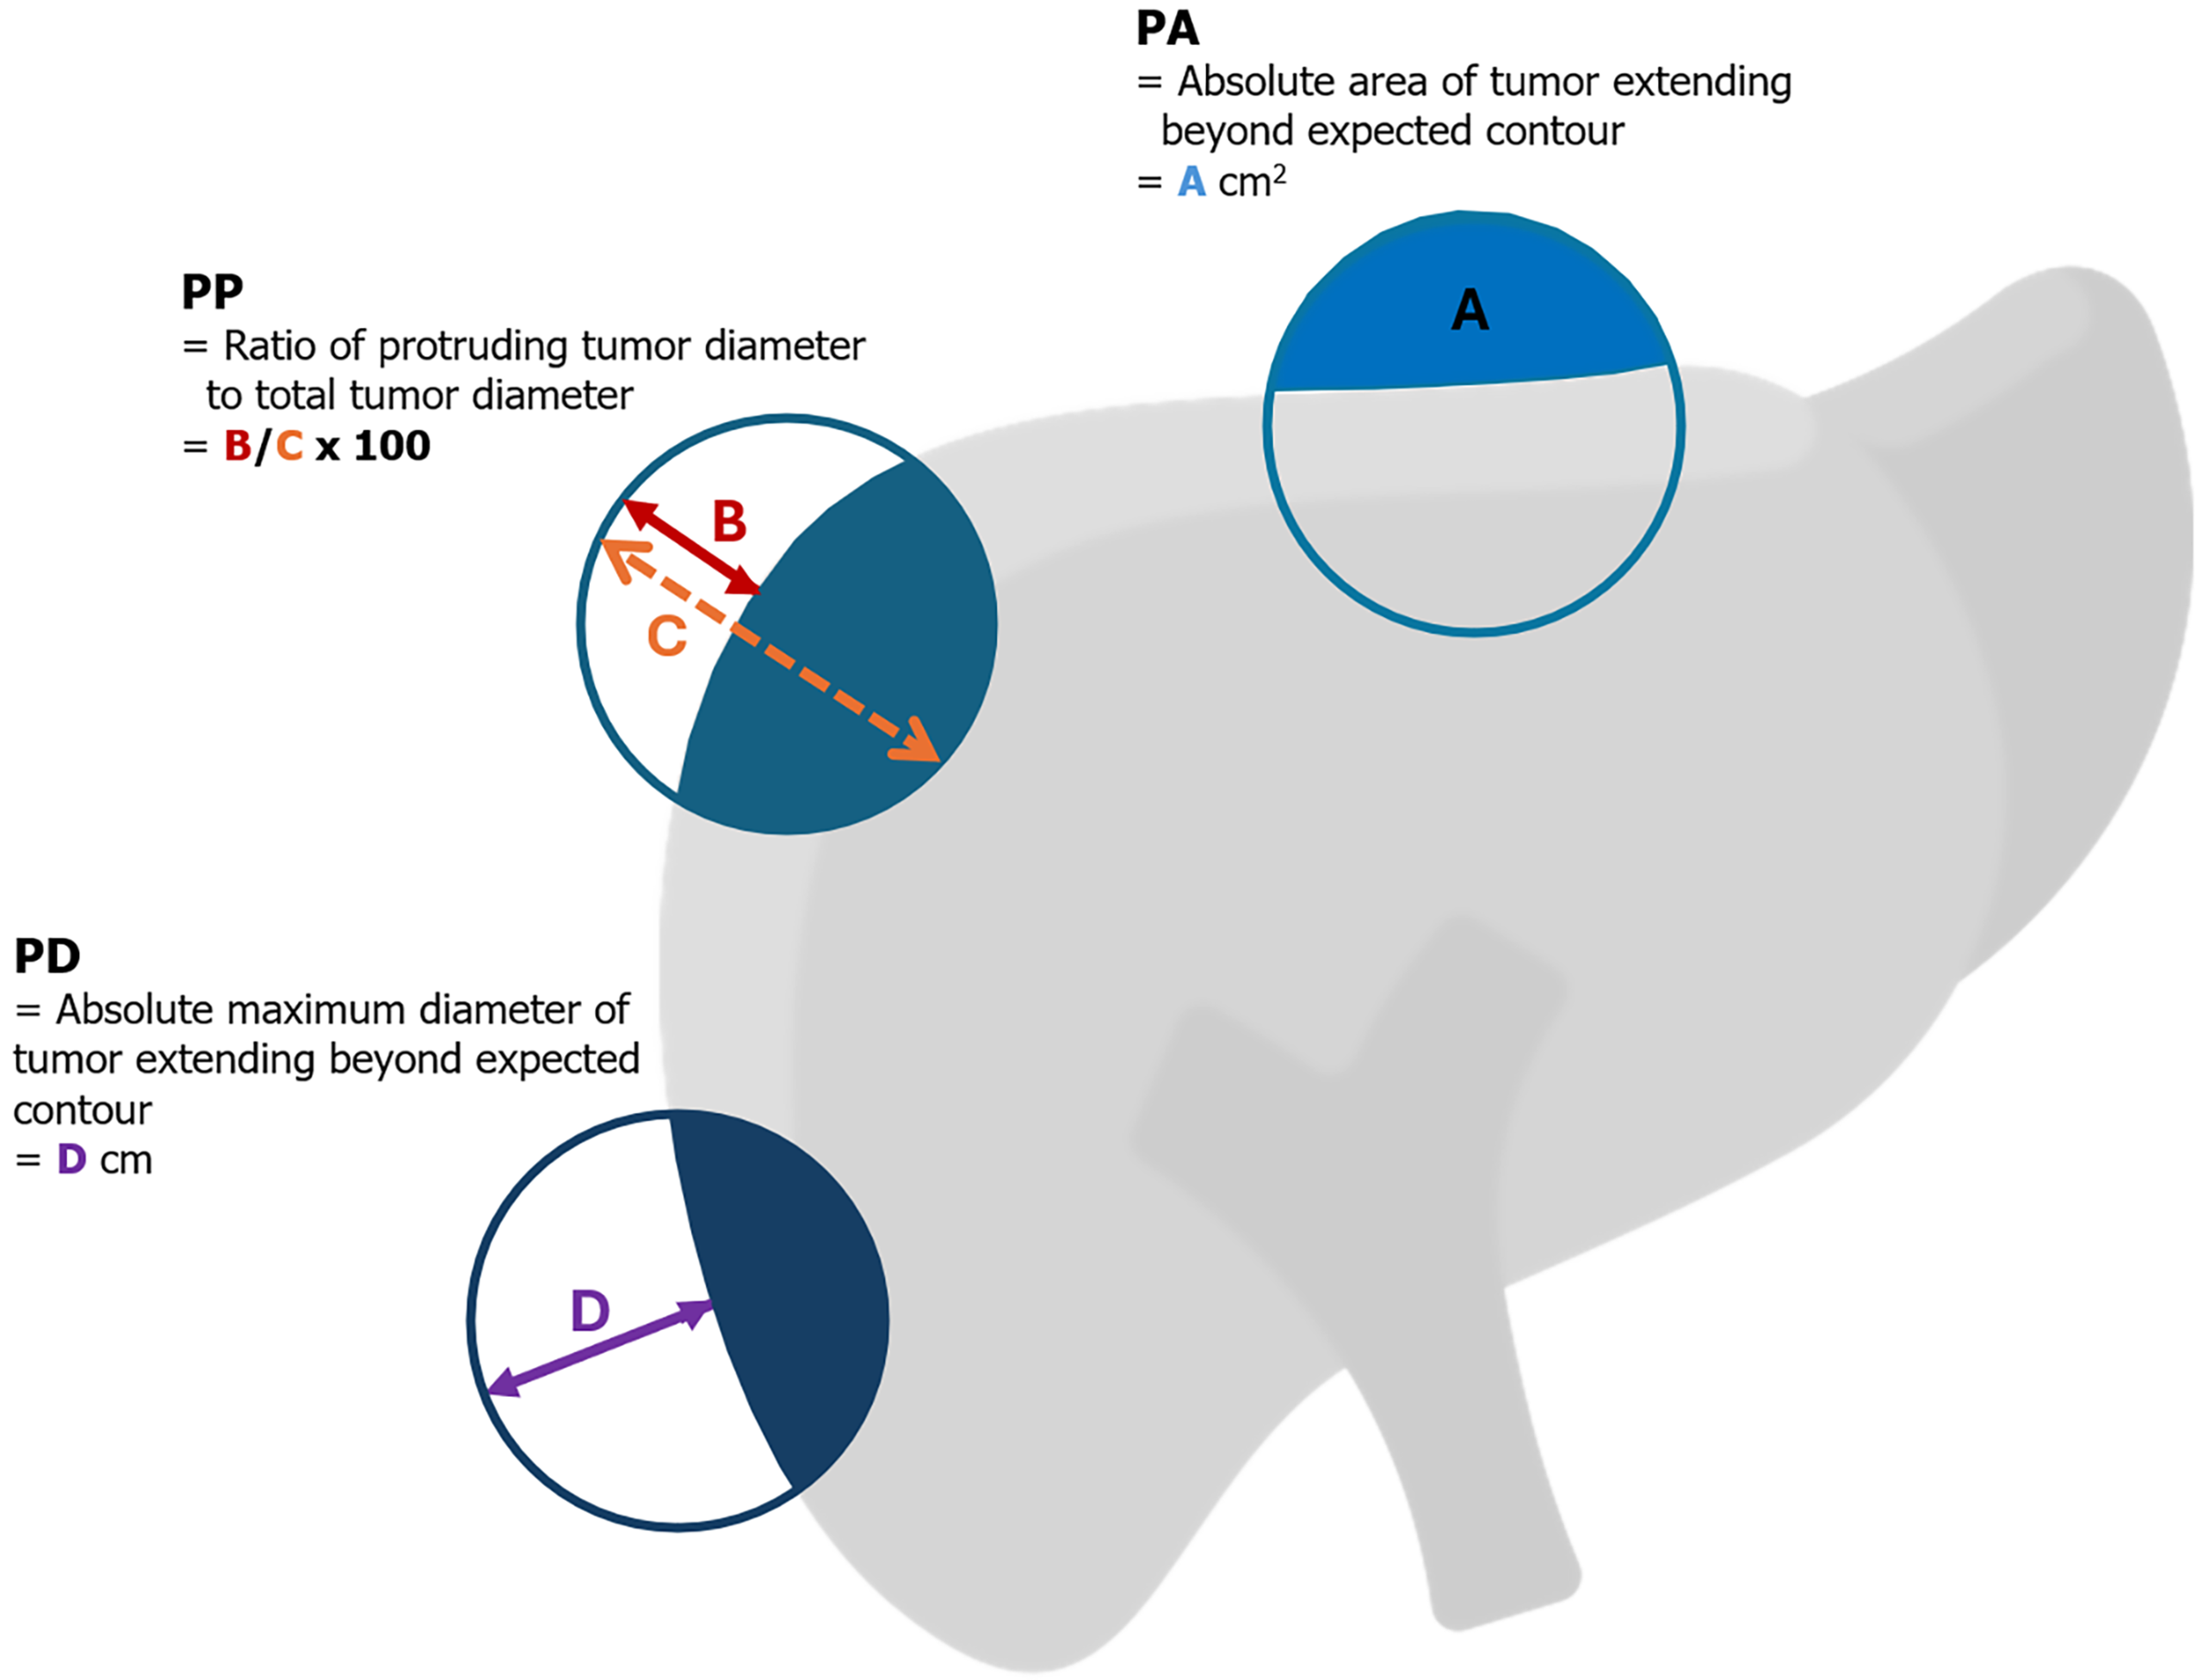
Figure 1 Schematic illustration of the three quantitative tumor protrusion assessment methods.
Protrusion area represents the absolute area of the tumor extending beyond the expected hepatic contour (A). Protrusion percentage is calculated as the ratio of the maximum protruding tumor diameter (B) to the maximum total tumor diameter (C). Protrusion diameter is the absolute maximum diameter of the protruding tumor portion (D). PA: Protrusion area; PP: Protrusion percentage; PD: Protrusion diameter.
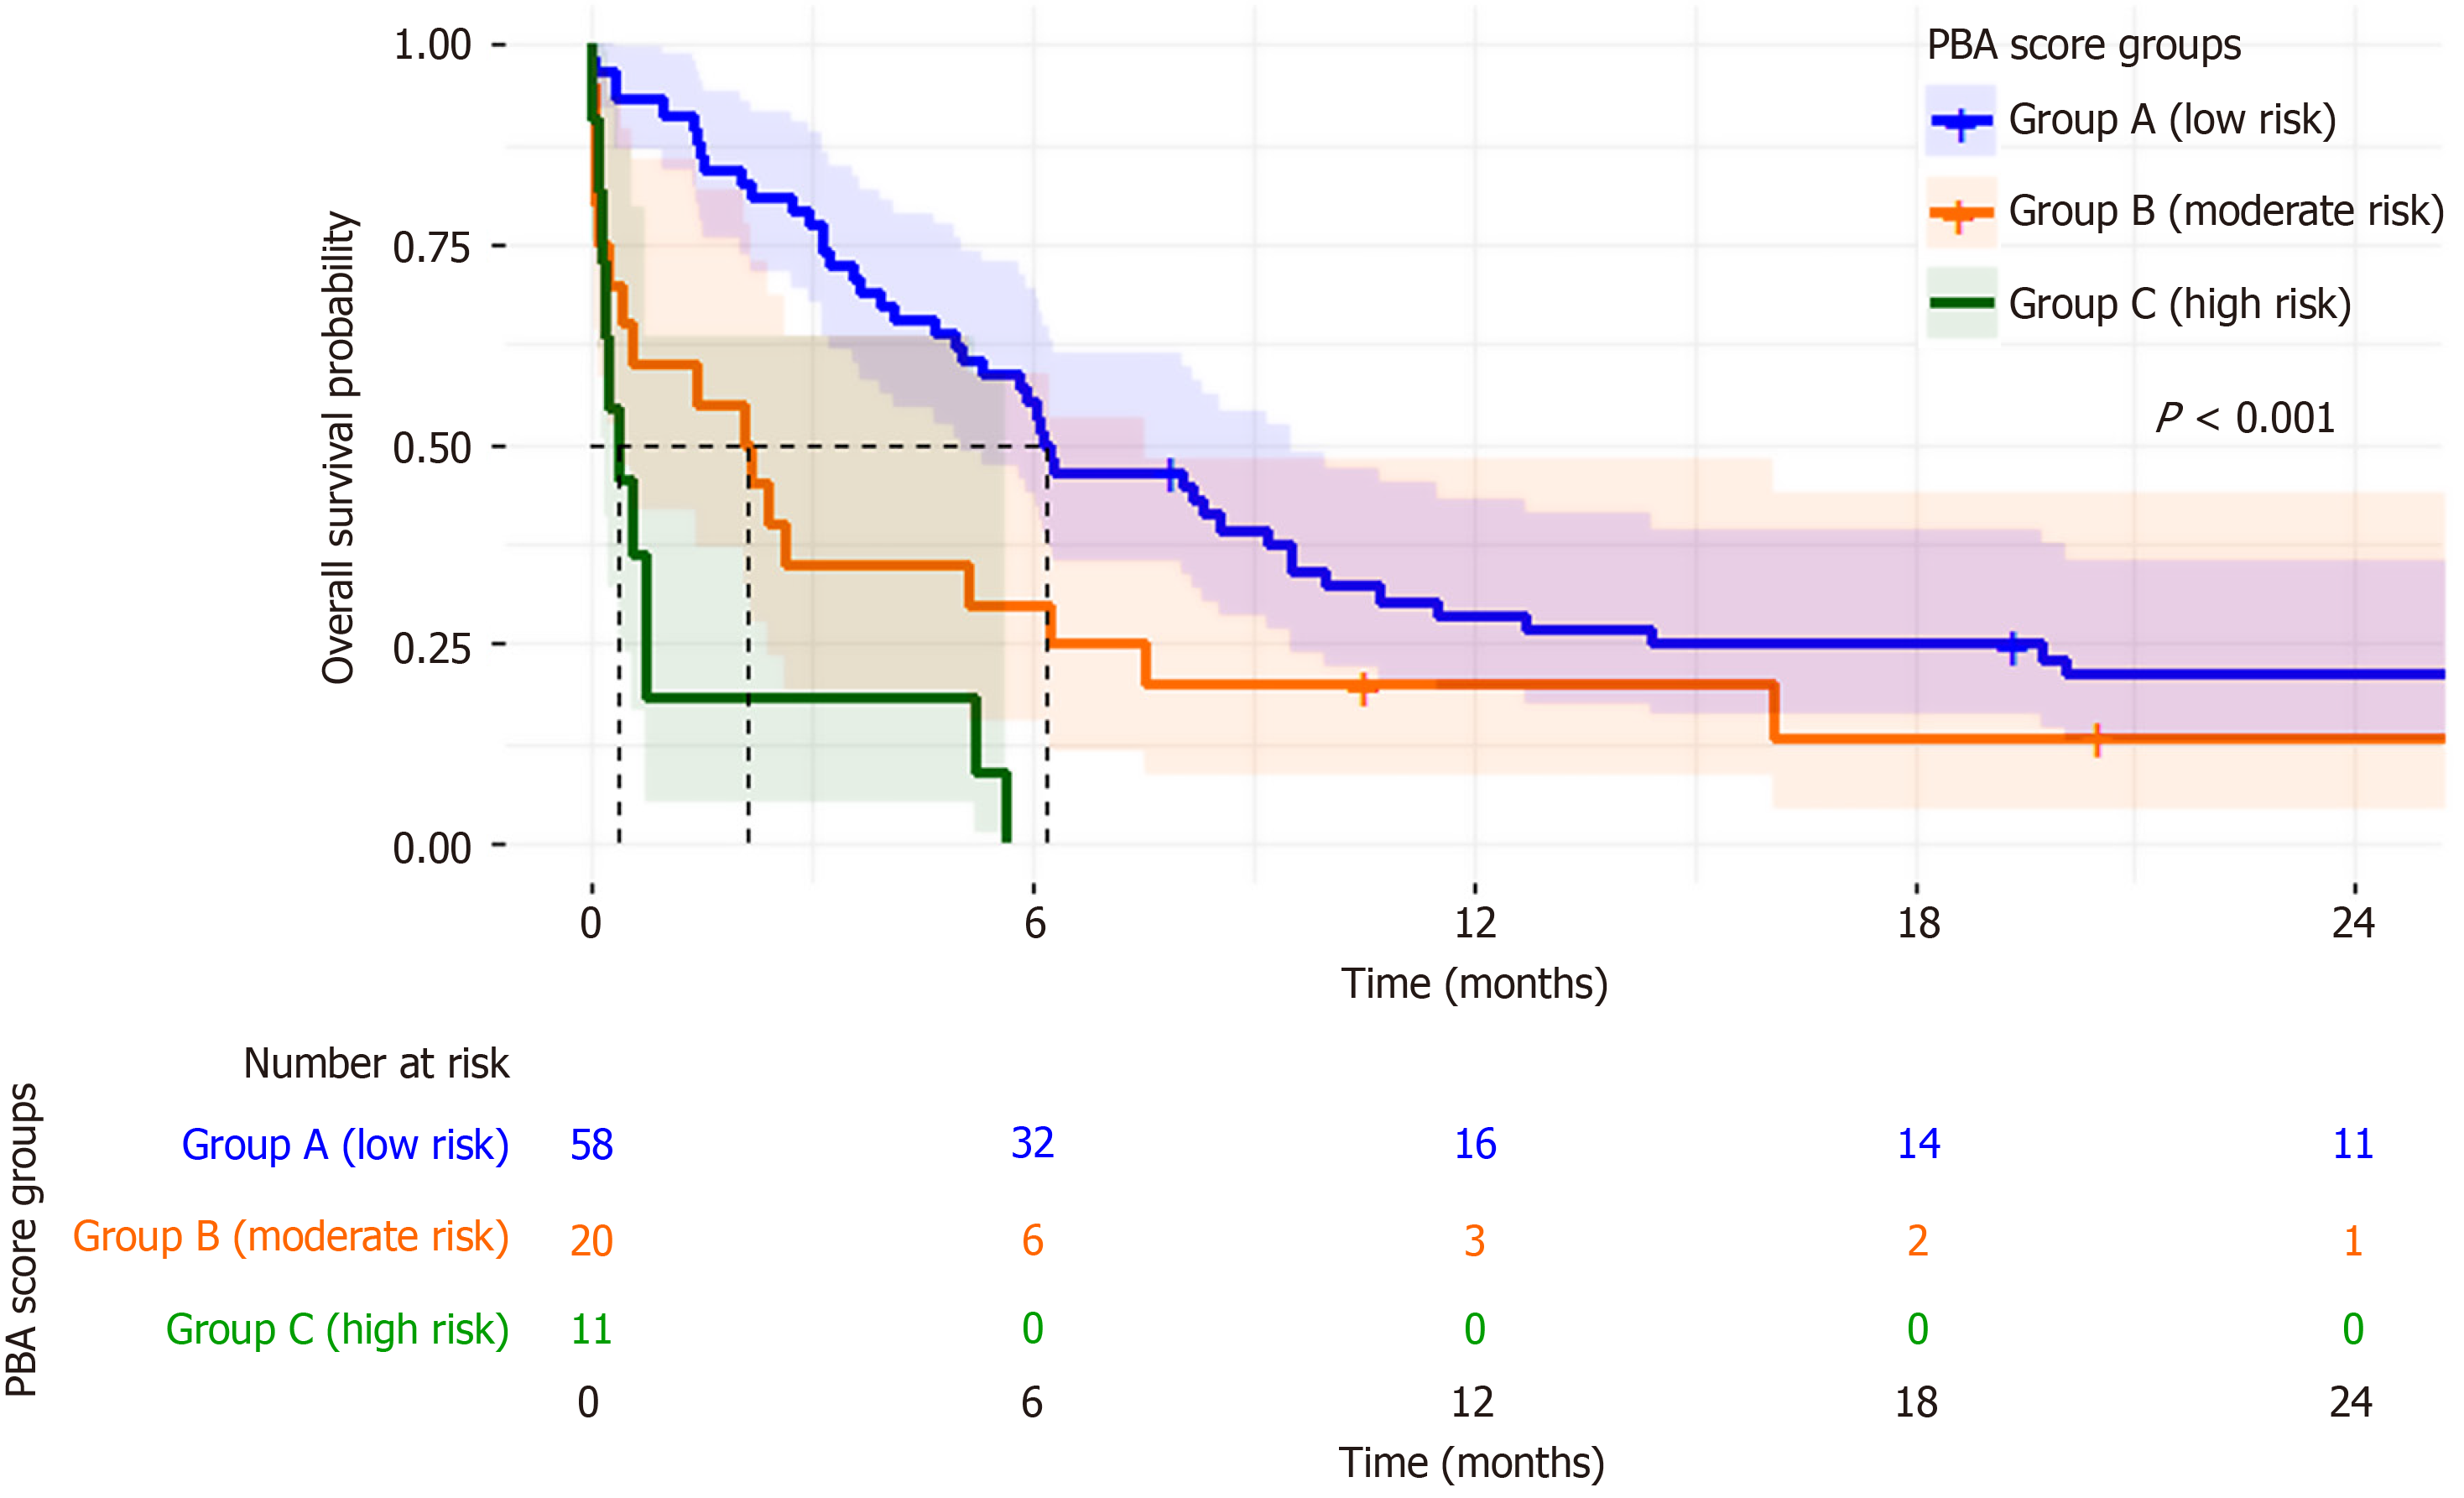
Figure 2 Kaplan-Meier survival curves.
Results demonstrate overall survival stratified by protrusion area-bilirubin-albumin score risk groups in patients with spontaneously ruptured hepatocellular carcinoma treated with emergency transarterial embolization/transarterial chemoembolization. PBA: Protrusion area-bilirubin-albumin.
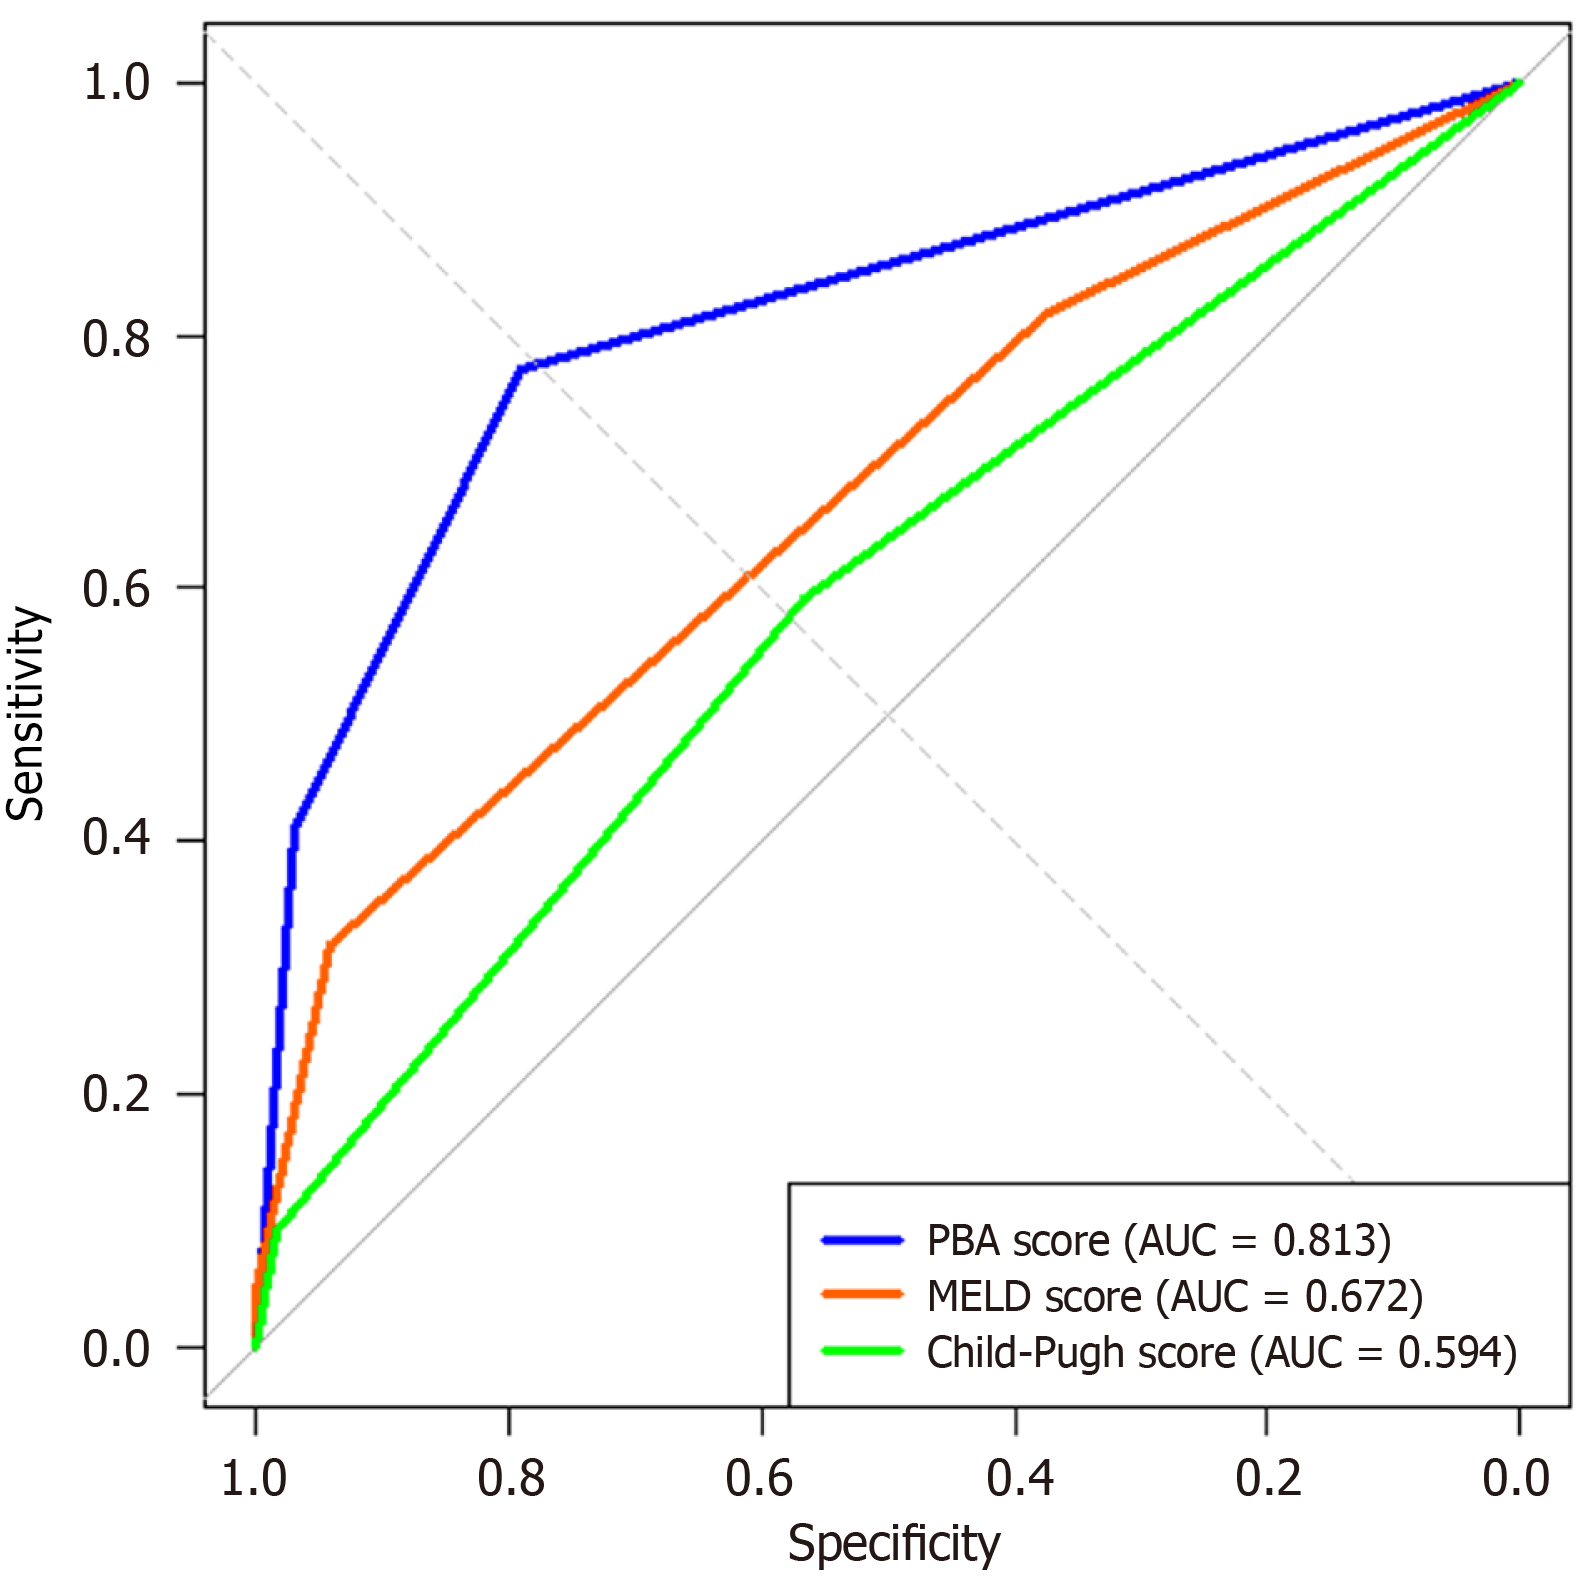
Figure 3 Receiver operating characteristic curve.
A comparison of protrusion area-bilirubin-albumin, model for end-stage liver disease, and Child-Pugh scores for 30-day mortality prediction. PBA: Protrusion area-bilirubin-albumin; MELD: Model for end-stage liver disease; AUC: Area under the receiver operating characteristic curve.
- Citation: Ajanakitti W, Bannangkoon K, Tubtawee T, Ina N. Tumor protrusion assessment and clinical integration for enhanced mortality risk prediction in spontaneously ruptured hepatocellular carcinoma. World J Gastroenterol 2026; 32(42): 120476
- URL: https://www.wjgnet.com/1007-9327/full/v32/i42/120476.htm
- DOI: https://dx.doi.org/10.3748/wjg.120476