
















Copyright: ©Author(s) 2026.
World J Gastroenterol. Oct 28, 2026; 32(40): 116827
Published online Oct 28, 2026. doi: 10.3748/wjg.116827
Published online Oct 28, 2026. doi: 10.3748/wjg.116827
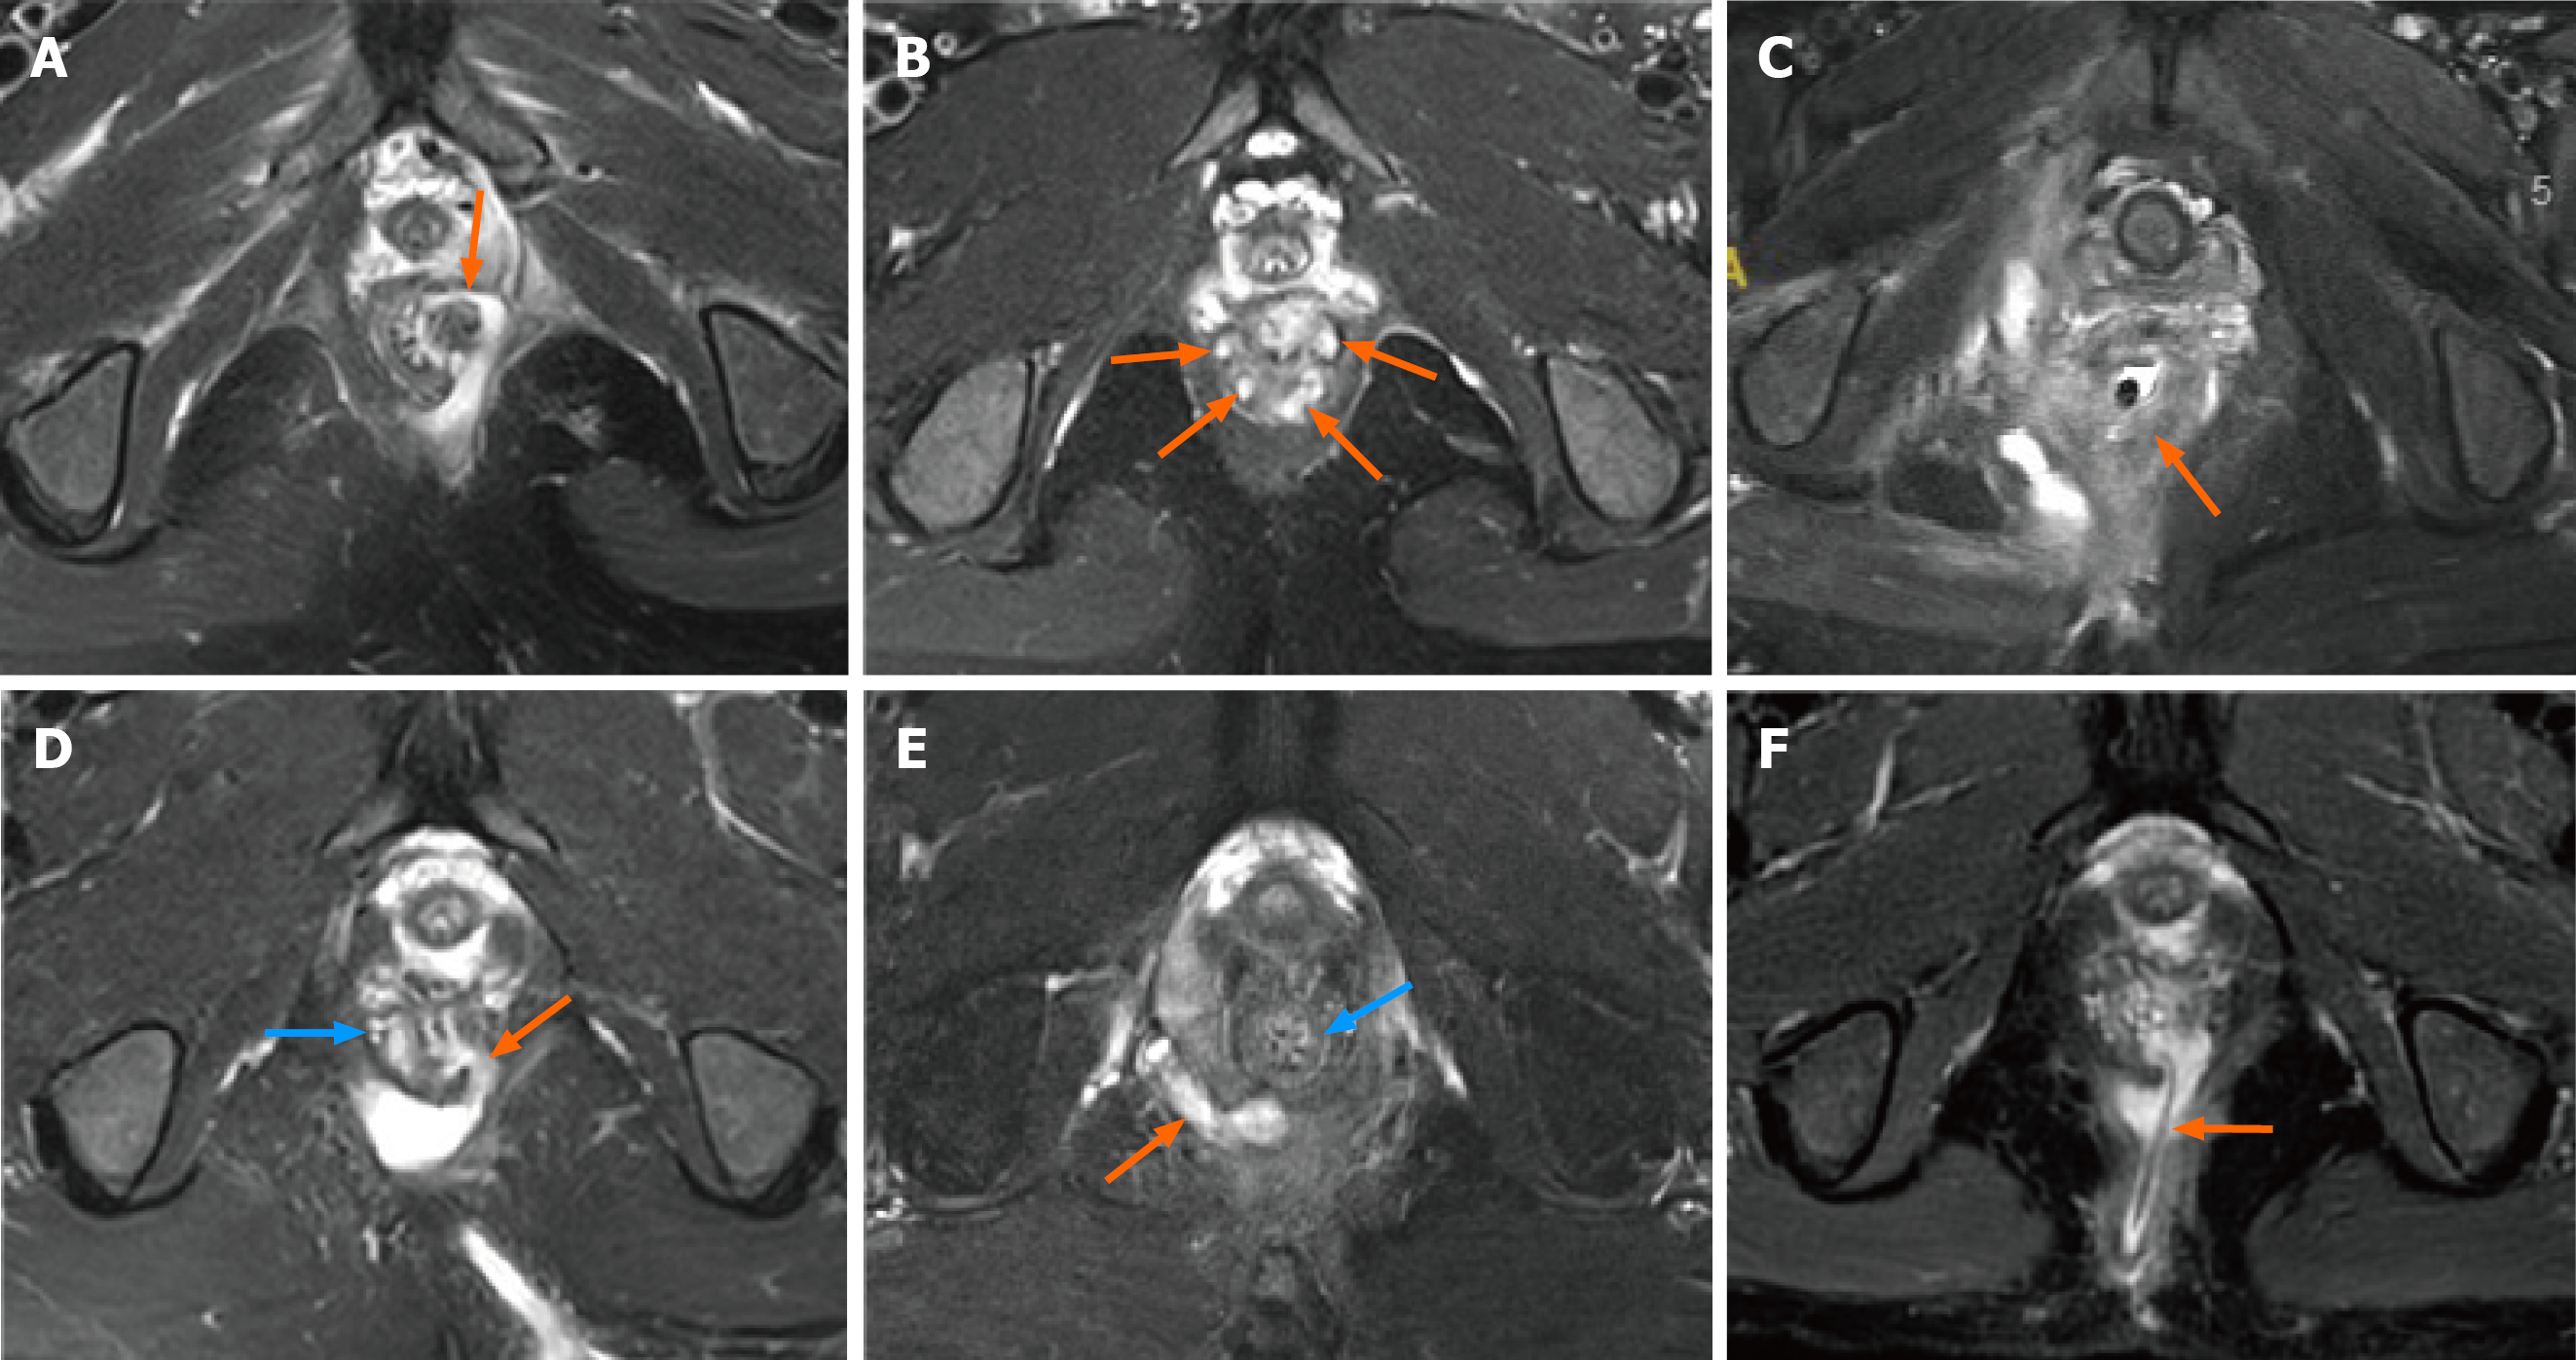
Figure 1 Magnetic resonance imaging T2-weighted fat saturation of perianal fistula in Crohn’s disease and cryptoglandular anal fistula.
A: Transmural inflammation, the fistula originates from the mucosal layer, penetrates the submucosal and internal anal sphincters (orange arrow) to the intersphincter space or external sphincter complex; B: Active proctitis, multiple submucosal and internal anal sphincter inflammation (orange arrows); C: Thickened rectal wall (at 10.0 mm); D: Transmural inflammation (orange arrow) and submucosal and internal anal sphincter inflammation (blue arrow); E: High transsphincteric cryptoglandular anal fistula (orange arrow), the source of infection is located in the intersphincter space at the 6 o’clock position, and the submucosal and internal anal sphincters are not involoved (blue arrow); F: The presence of a seton drainage at the time of magnetic resonance imaging shows a transmural appearance (orange arrow).
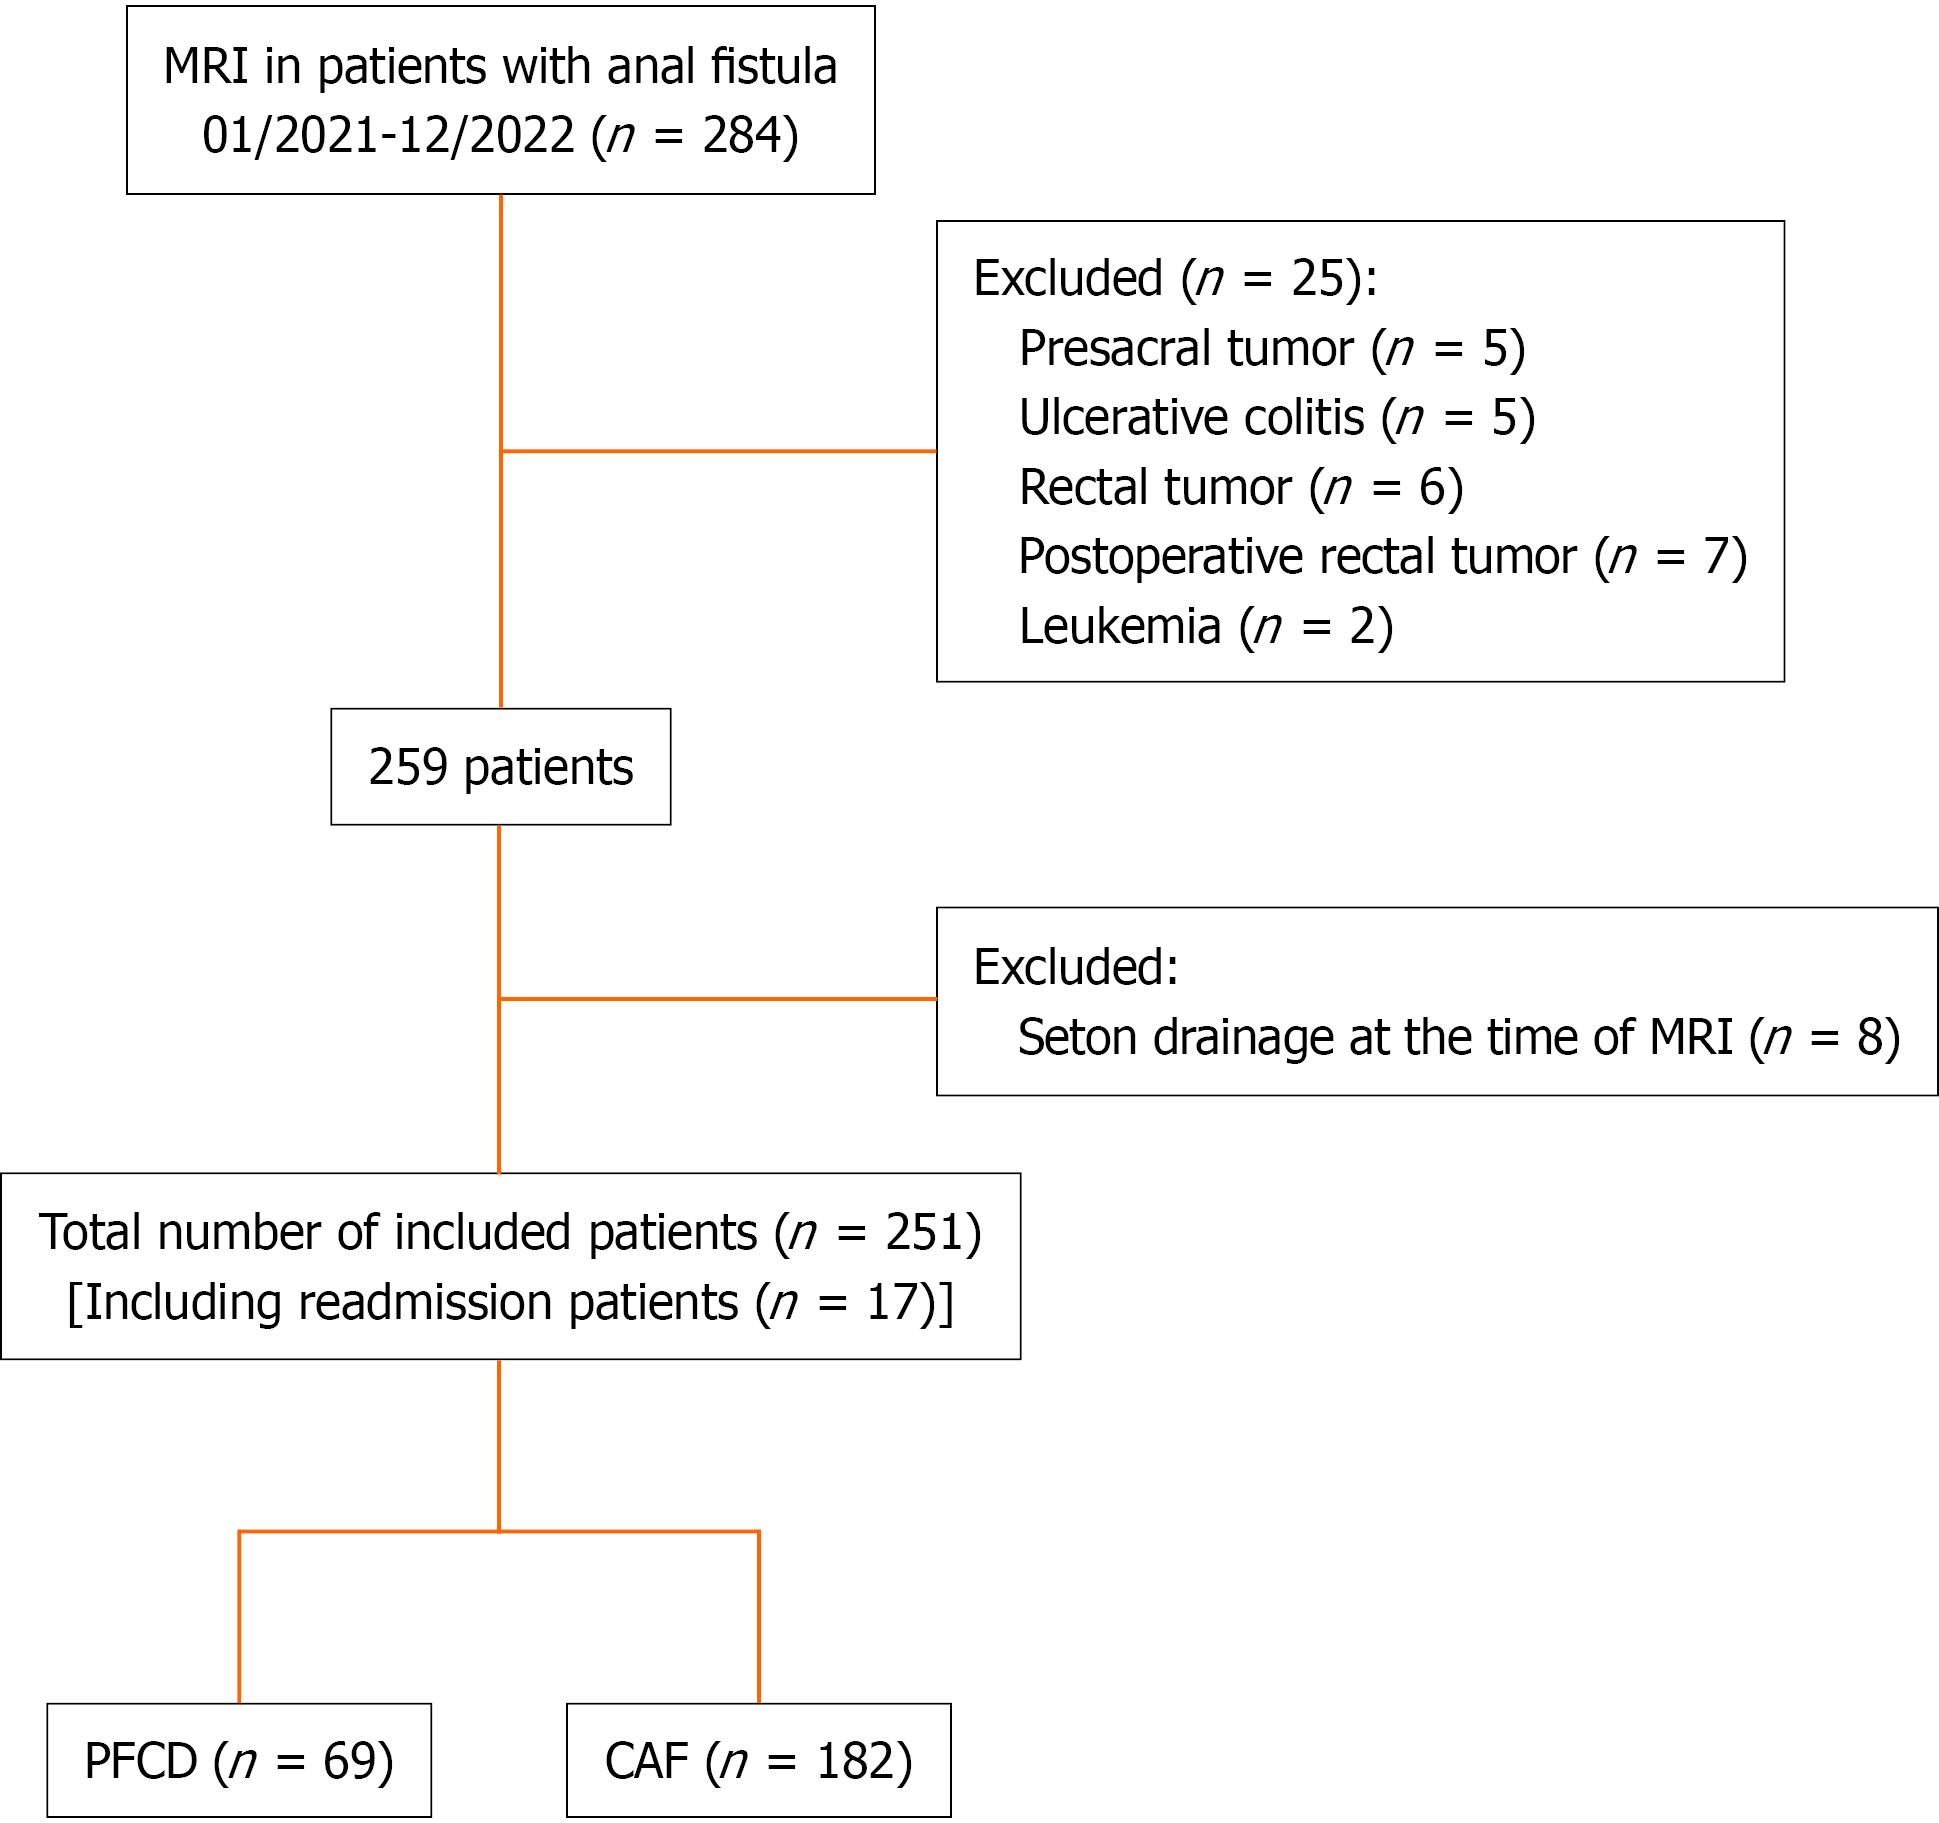
Figure 2 Flow chart of the study population.
CAF: Cryptoglandular anal fistula; MRI: Magnetic resonance imaging; PFCD: Perianal fistula in Crohn’s disease.
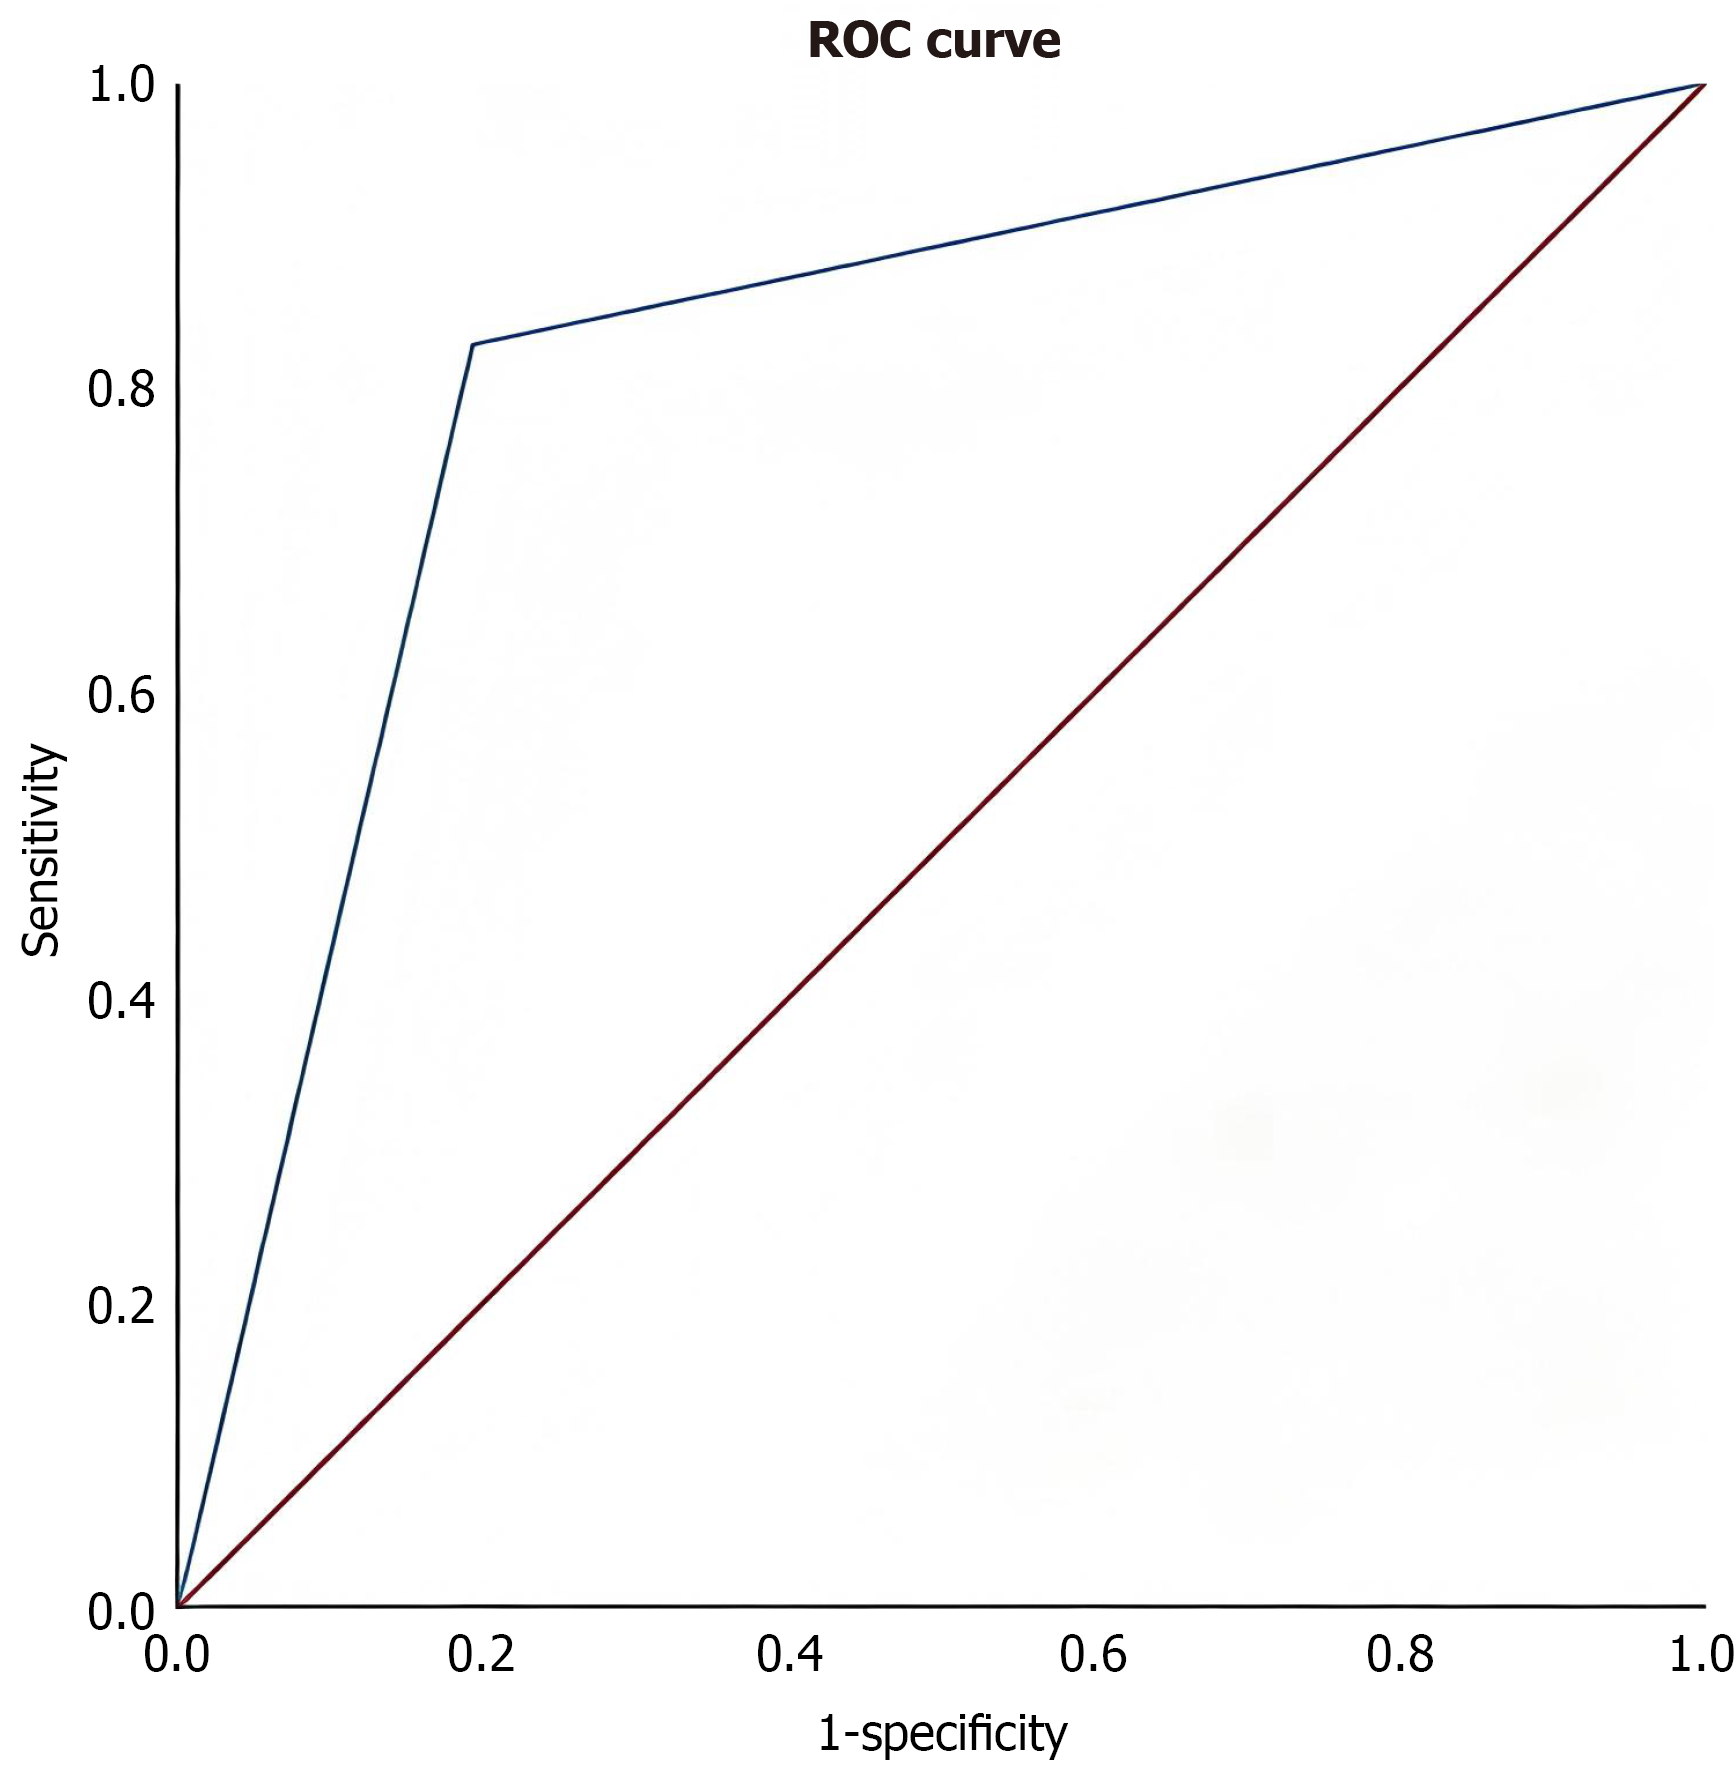
Figure 3 Receiver-operating characteristic curve showing the area under the curve of the predictive model.
The area under the curve of the receiver-operating characteristic was 0.818 (95%CI: 0.757-0.879; SE = 0.031). ROC: Receiver-operating characteristic.
- Citation: Xu ZP, Li L, Sun GD, Wu YY, Cai EW, Wen K, Shao WJ, Chen YG. Magnetic resonance imaging predicts perianal fistula in Crohn’s disease. World J Gastroenterol 2026; 32(40): 116827
- URL: https://www.wjgnet.com/1007-9327/full/v32/i40/116827.htm
- DOI: https://dx.doi.org/10.3748/wjg.116827