Copyright
©The Author(s) 2025.
World J Gastroenterol. Jun 7, 2025; 31(21): 105895
Published online Jun 7, 2025. doi: 10.3748/wjg.v31.i21.105895
Published online Jun 7, 2025. doi: 10.3748/wjg.v31.i21.105895
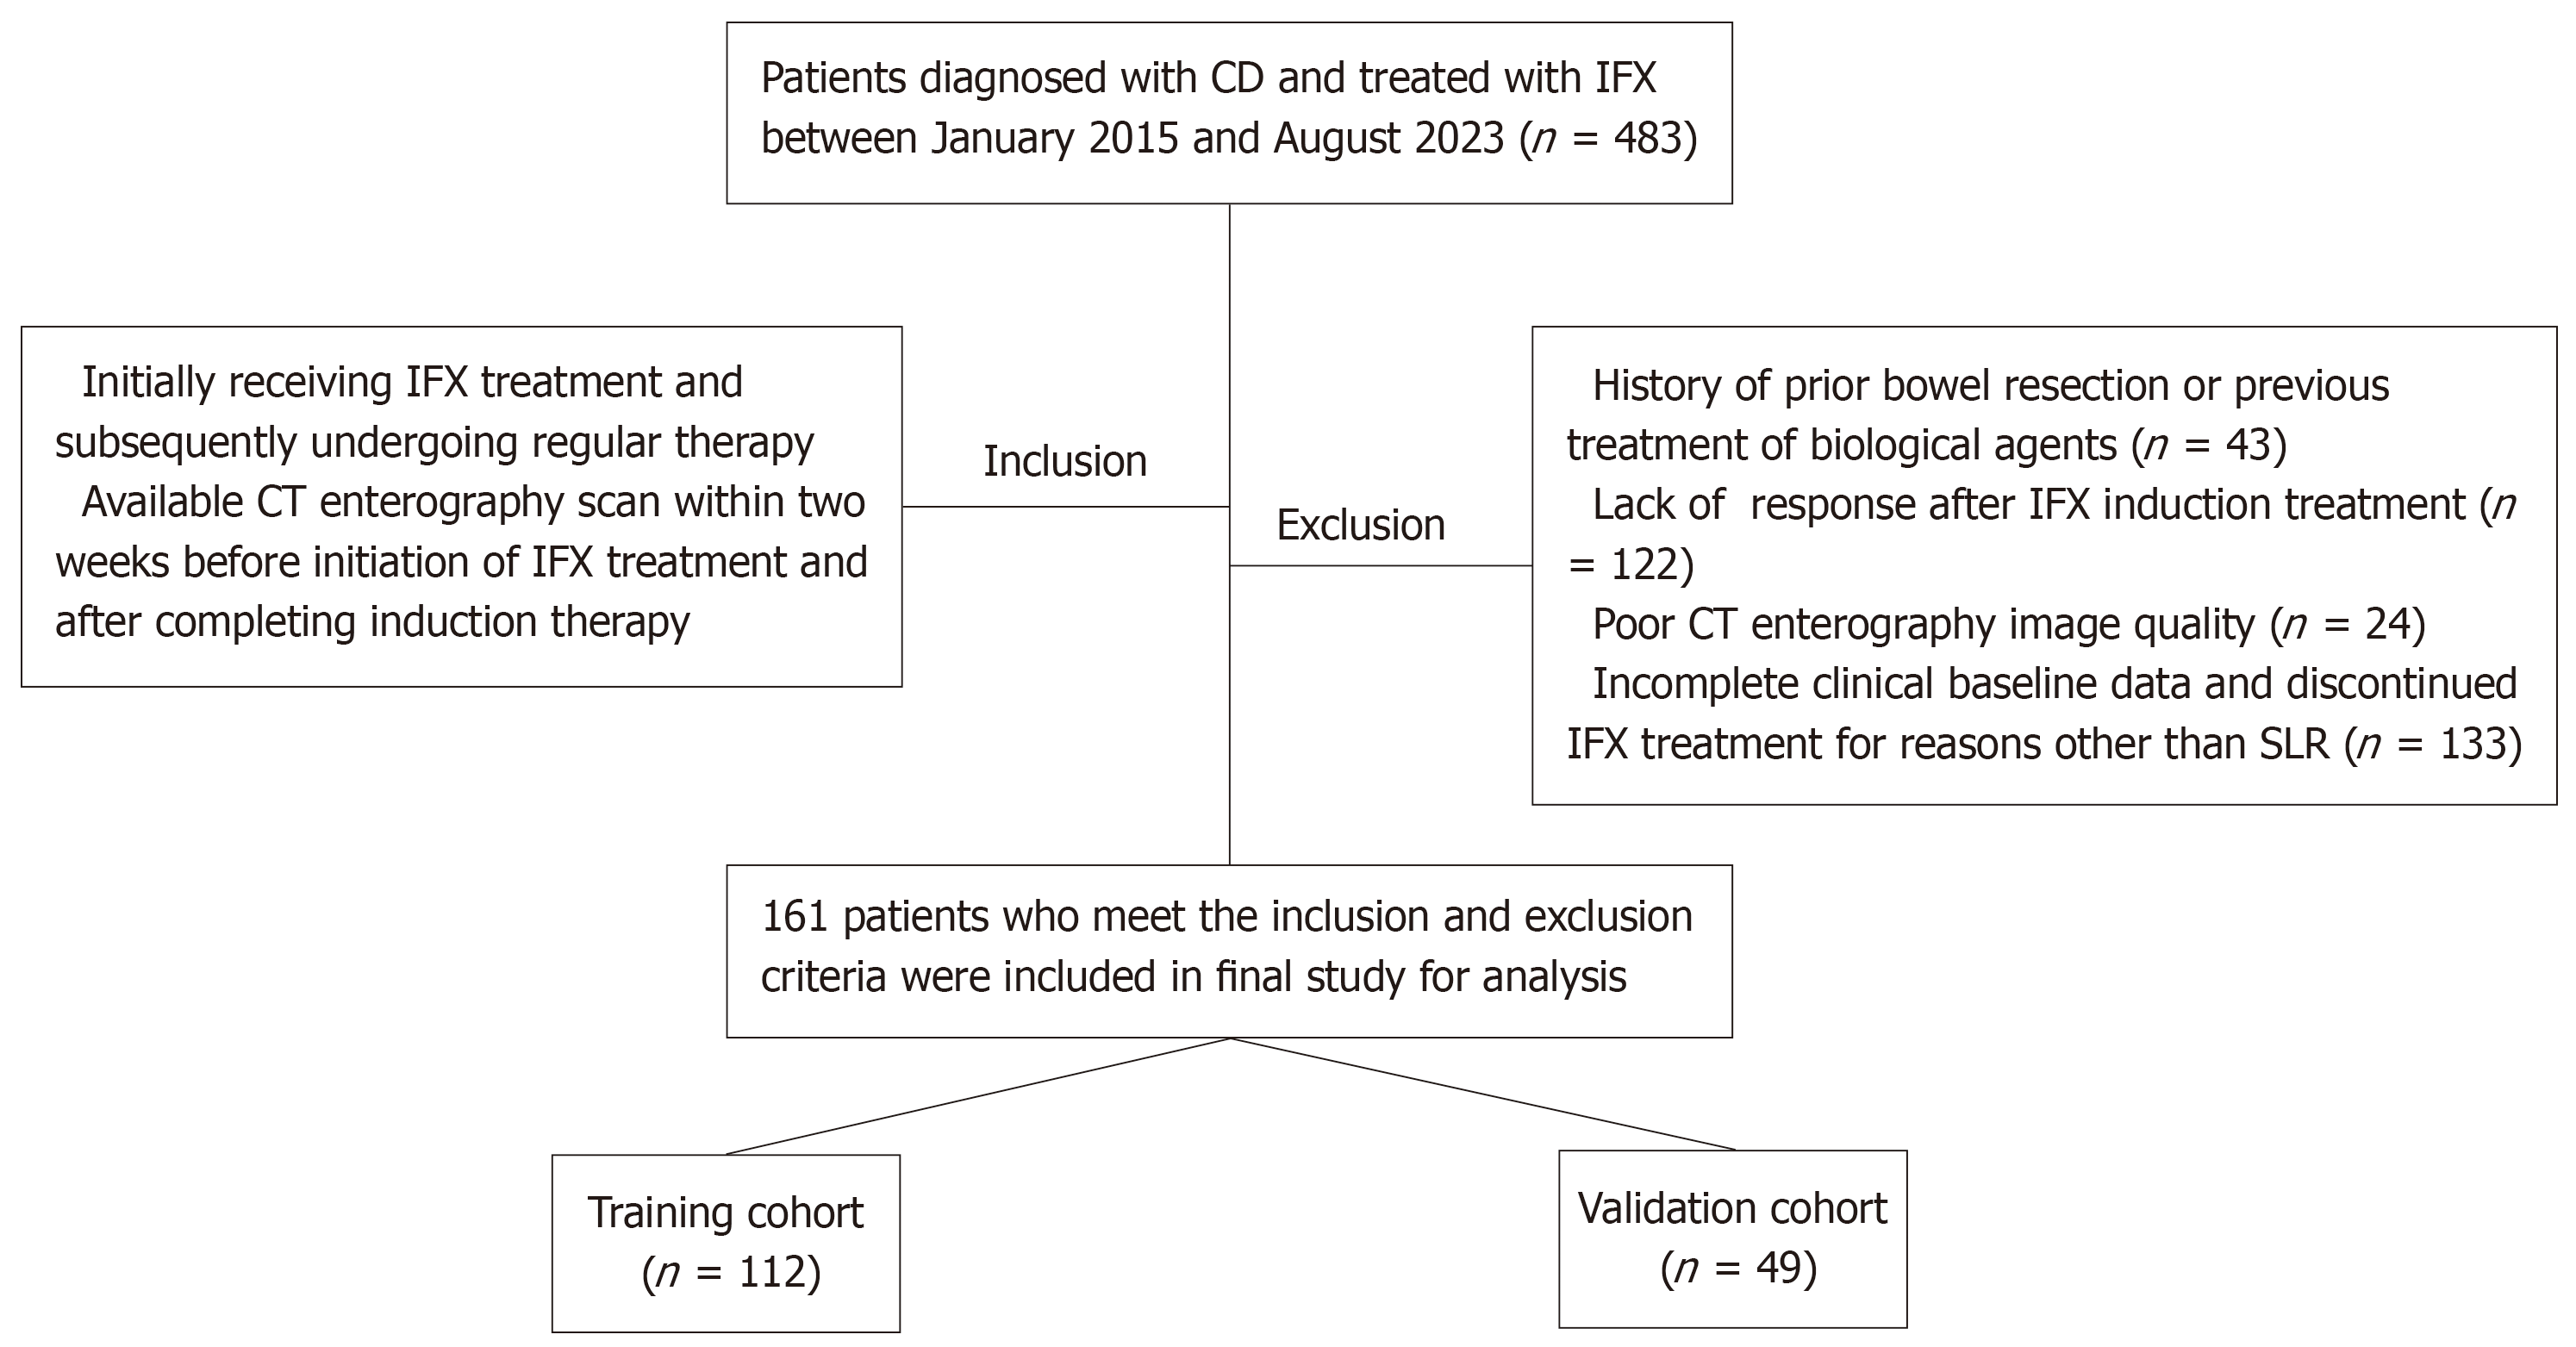
Figure 1 Flowchart of patient recruitment.
CD: Crohn’s disease; IFX: Infliximab; CT: Computed tomography; SLR: Secondary loss of response.
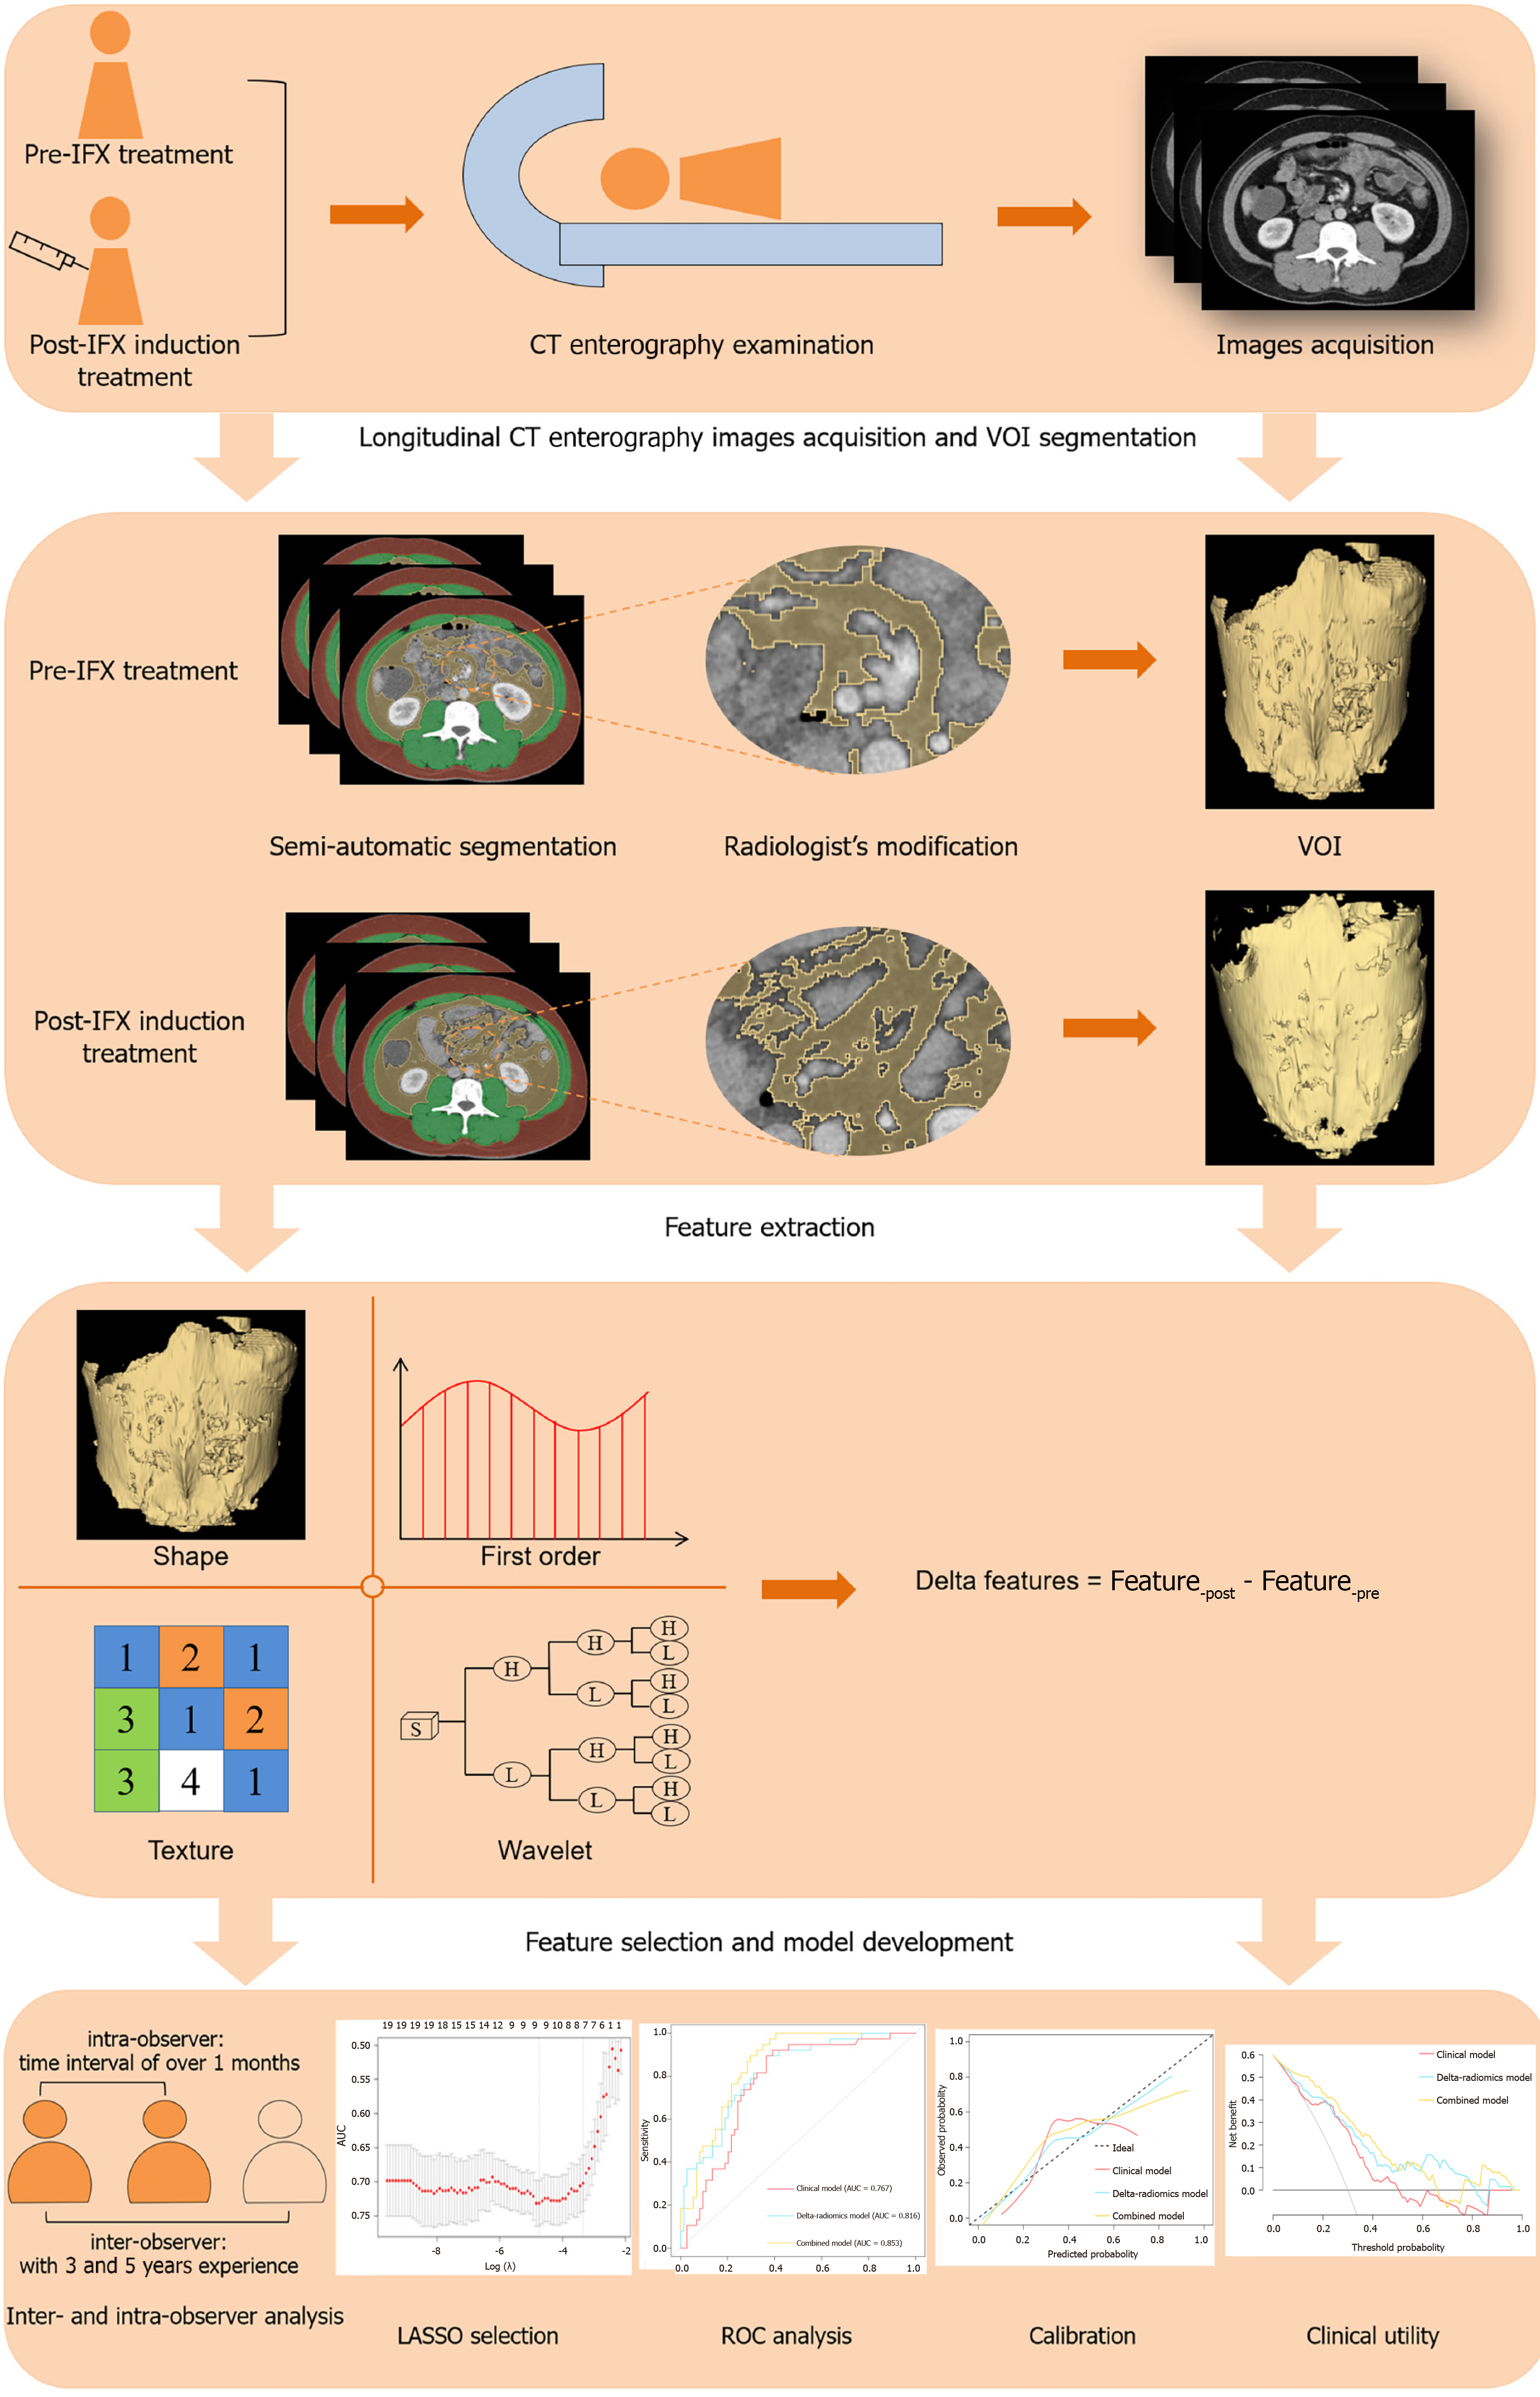
Figure 2 The study design and workflow of radiomics analysis.
IFX: Infliximab; CT: Computed tomography; VOI: Volume of interest; LASSO: Least absolute shrinkage and selection operator; ROC: Receiver operating characteristic curves.
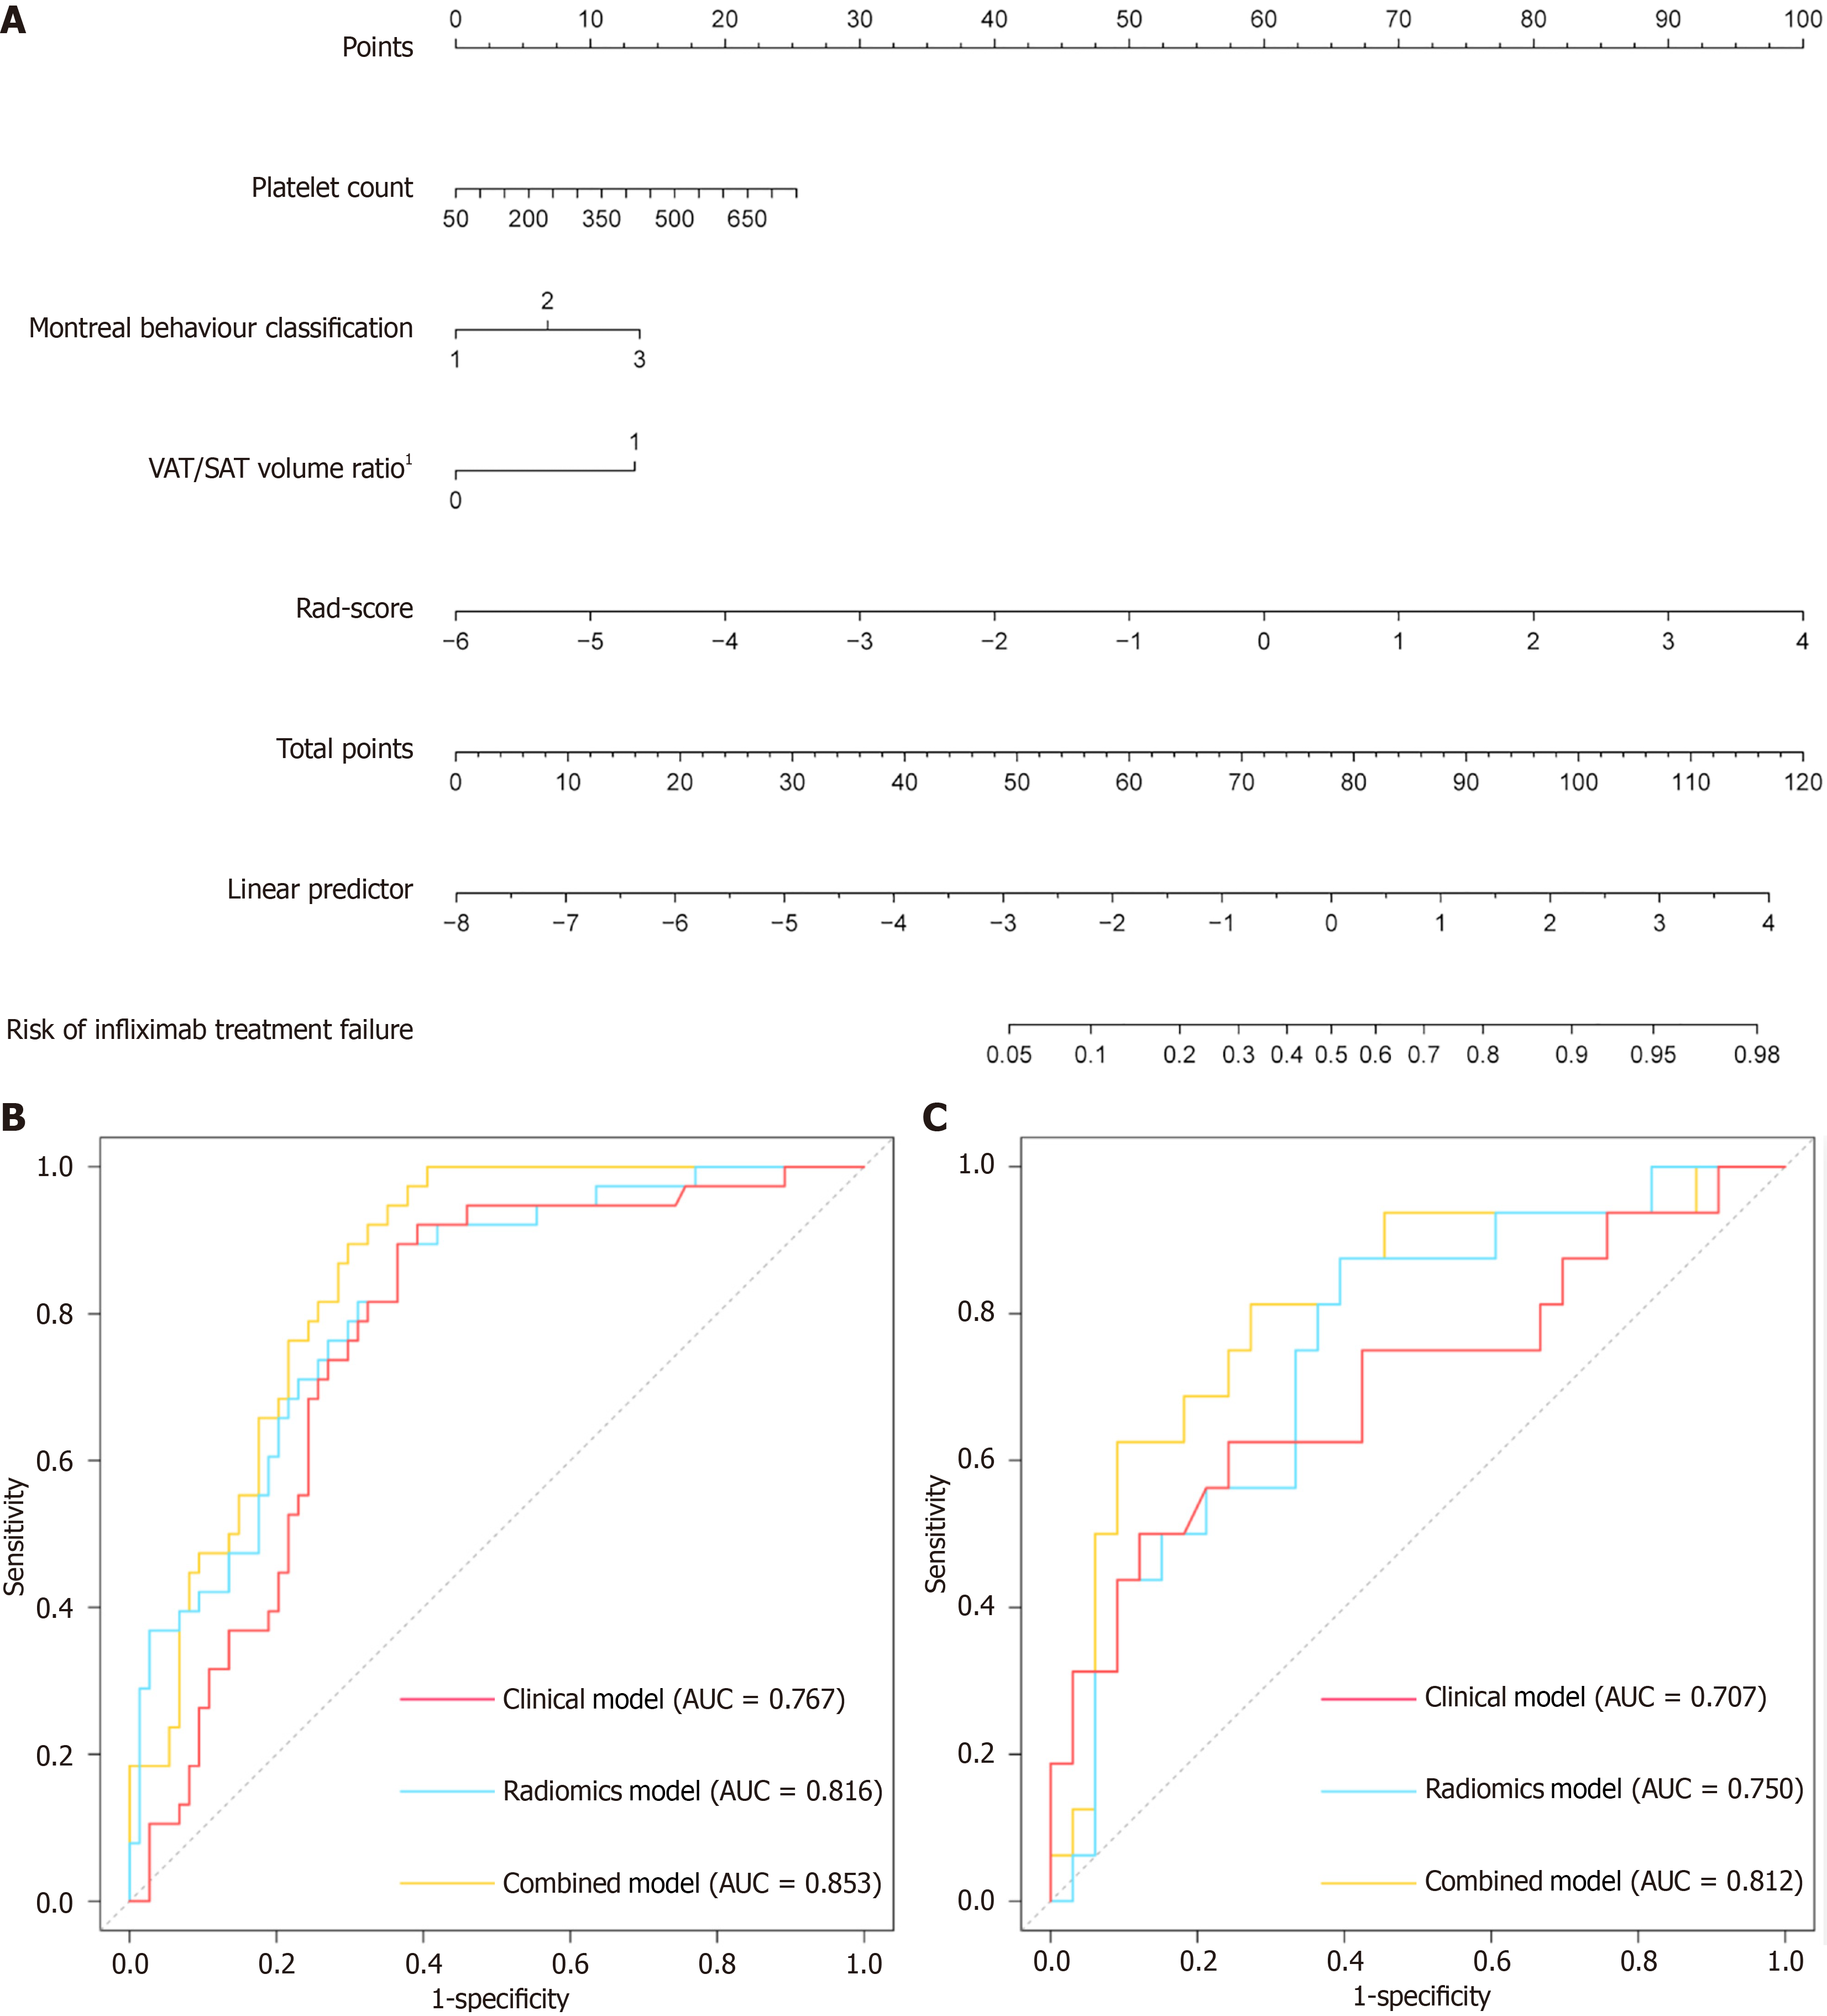
Figure 3 Establishment of the combined model and predictive performance of models for predicting secondary loss of response.
A: The developed nomogram of combined model scaled by the proportional regression coefficient of each predictor; B and C: Receiver operating characteristic curves of the clinical model, delta-radiomics model and combined model in the training cohort (B) and the validation cohort (C). VAT: Visceral adipose tissue; SAT: Subcutaneous adipose tissue; AUC: Area under the receiver operating characteristic curve. 1VAT/SAT volume ratio prior to infliximab treatment.
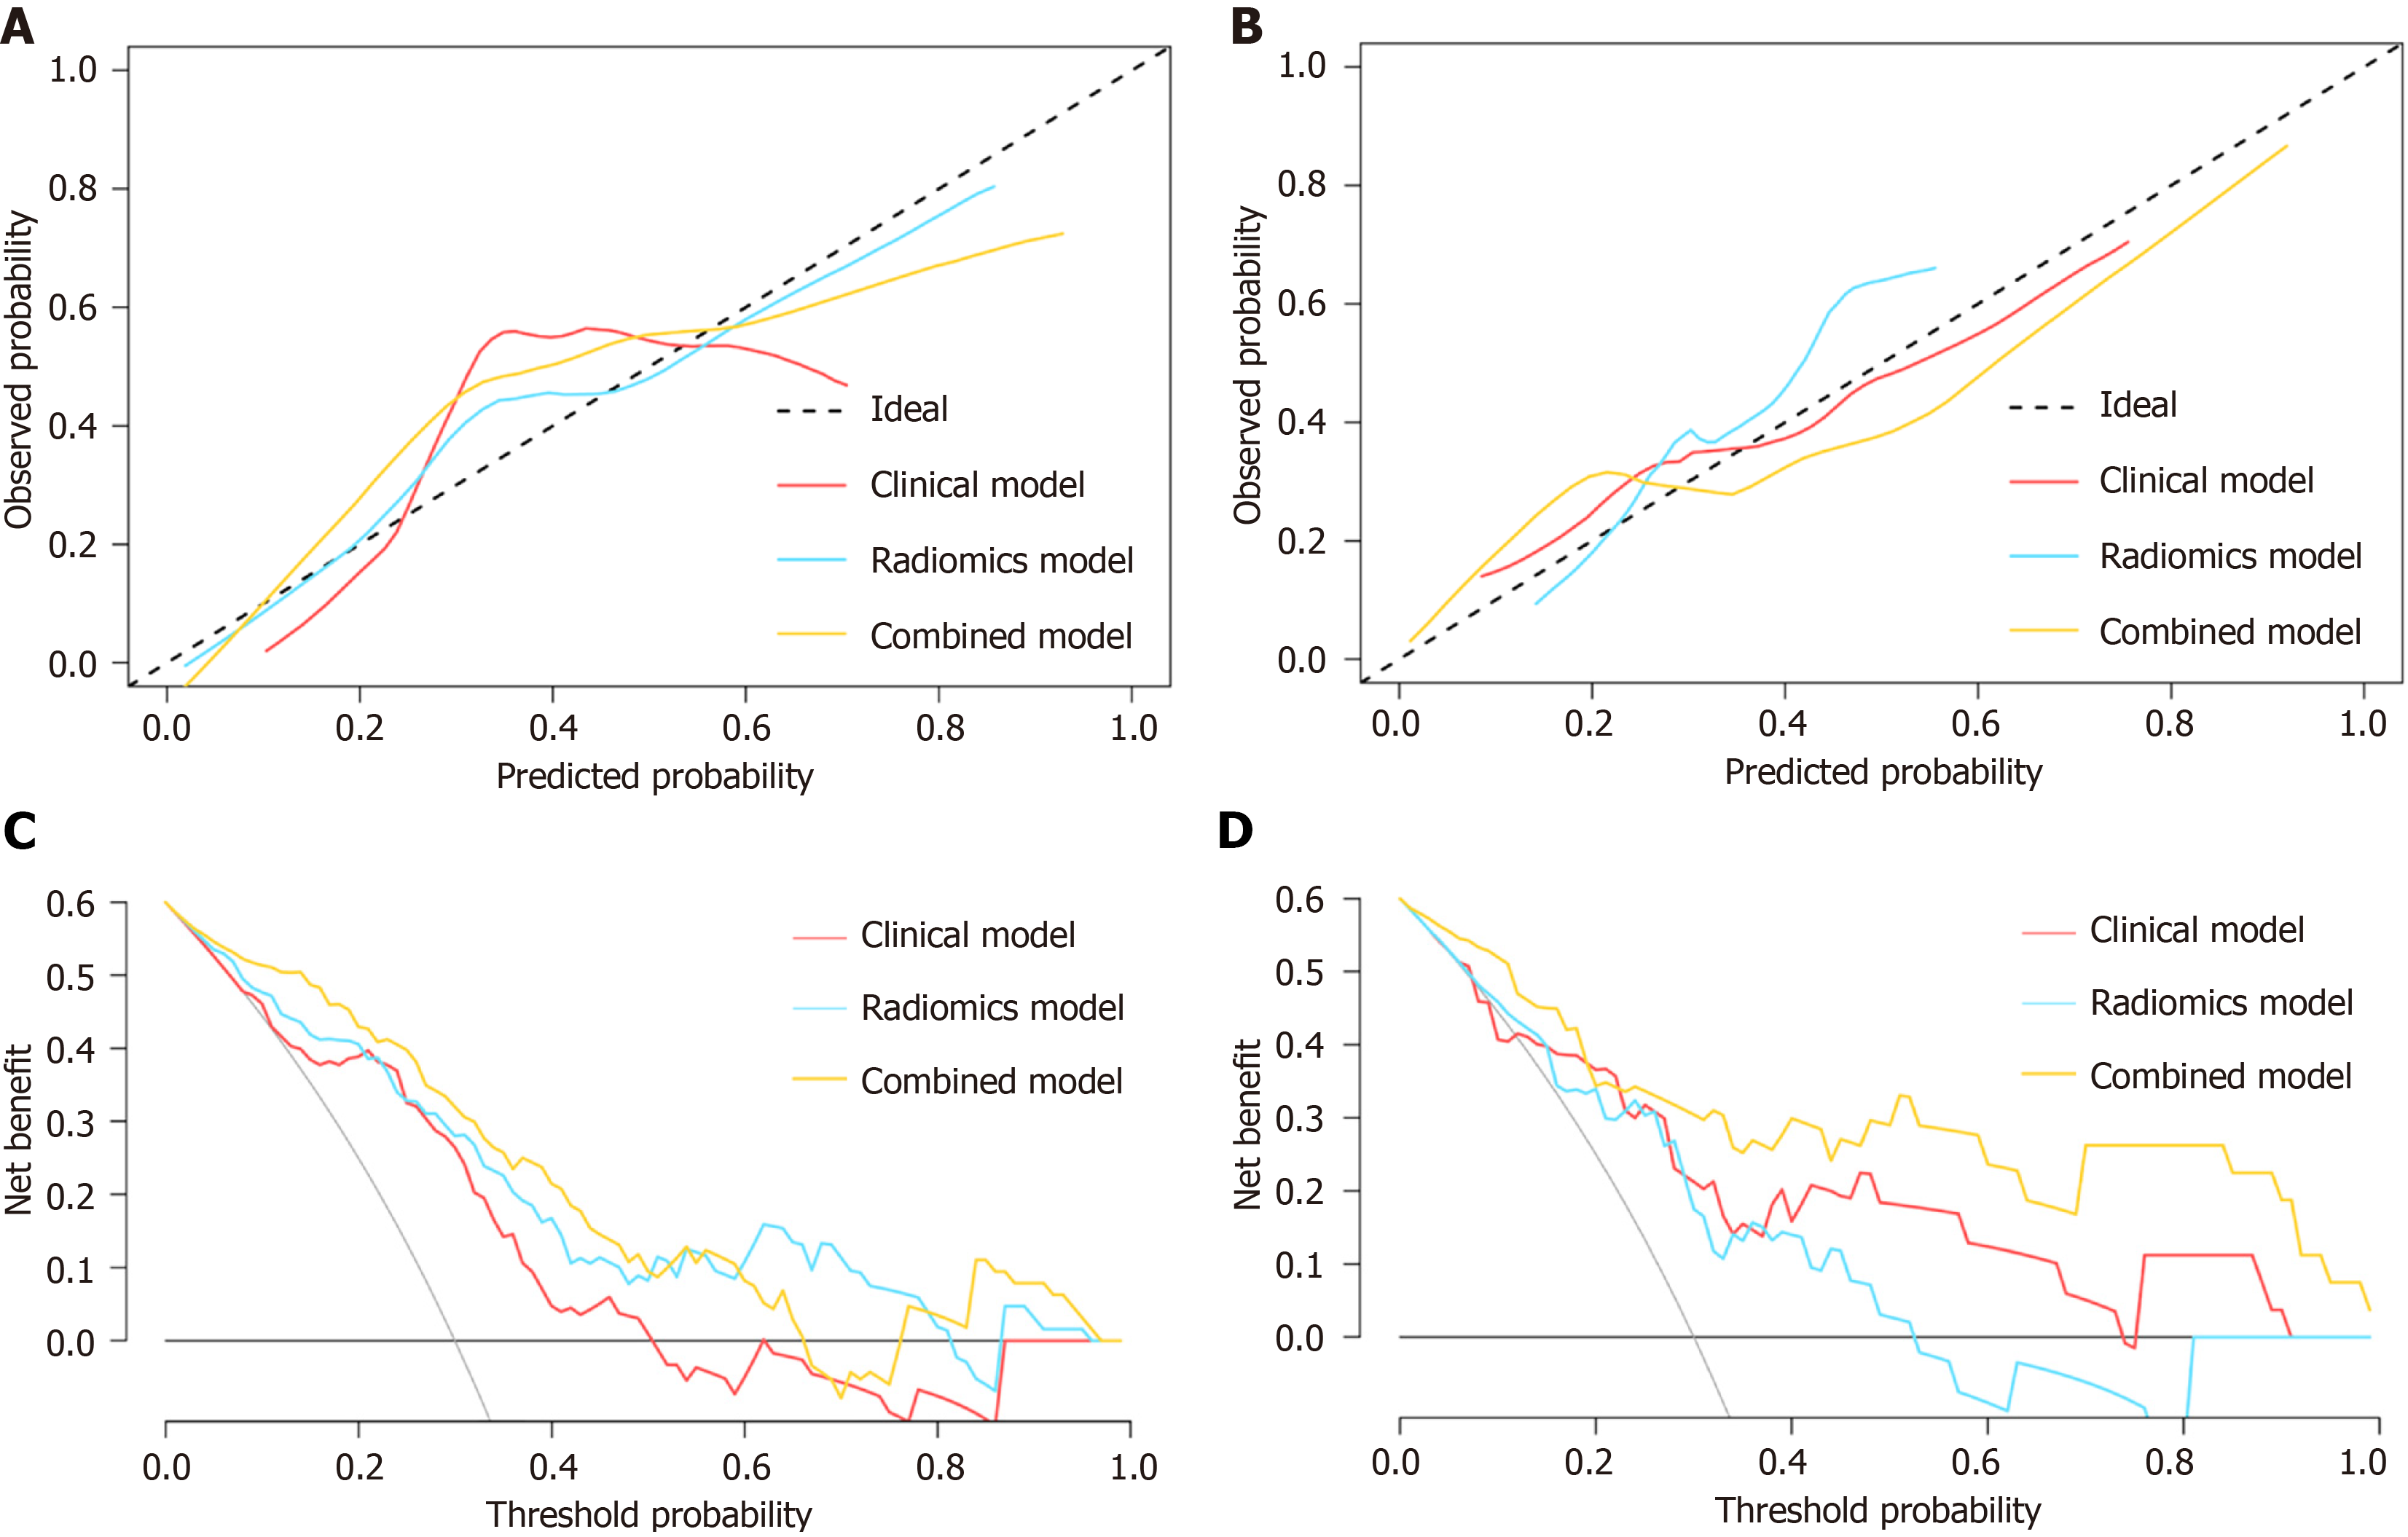
Figure 4 Calibration and clinical utility of models for predicting secondary loss of response to infliximab in patients with Crohn’s disease.
A and B: Calibration plots for clinical model, delta-radiomics model and combined model in the training cohort (A) and the validation cohort (B); C and D: Decision curve analysis for these three models in the training cohort (C) and the validation cohort (D).
- Citation: Li X, Song FL, He HF, Zeng SM, Feng ZC, Rong PF. Longitudinal computed tomography-based delta-radiomics of visceral adipose tissue predicts infliximab secondary loss of response in Crohn’s disease patients. World J Gastroenterol 2025; 31(21): 105895
- URL: https://www.wjgnet.com/1007-9327/full/v31/i21/105895.htm
- DOI: https://dx.doi.org/10.3748/wjg.v31.i21.105895


