Copyright
©The Author(s) 2024.
World J Gastroenterol. Feb 28, 2024; 30(8): 881-900
Published online Feb 28, 2024. doi: 10.3748/wjg.v30.i8.881
Published online Feb 28, 2024. doi: 10.3748/wjg.v30.i8.881
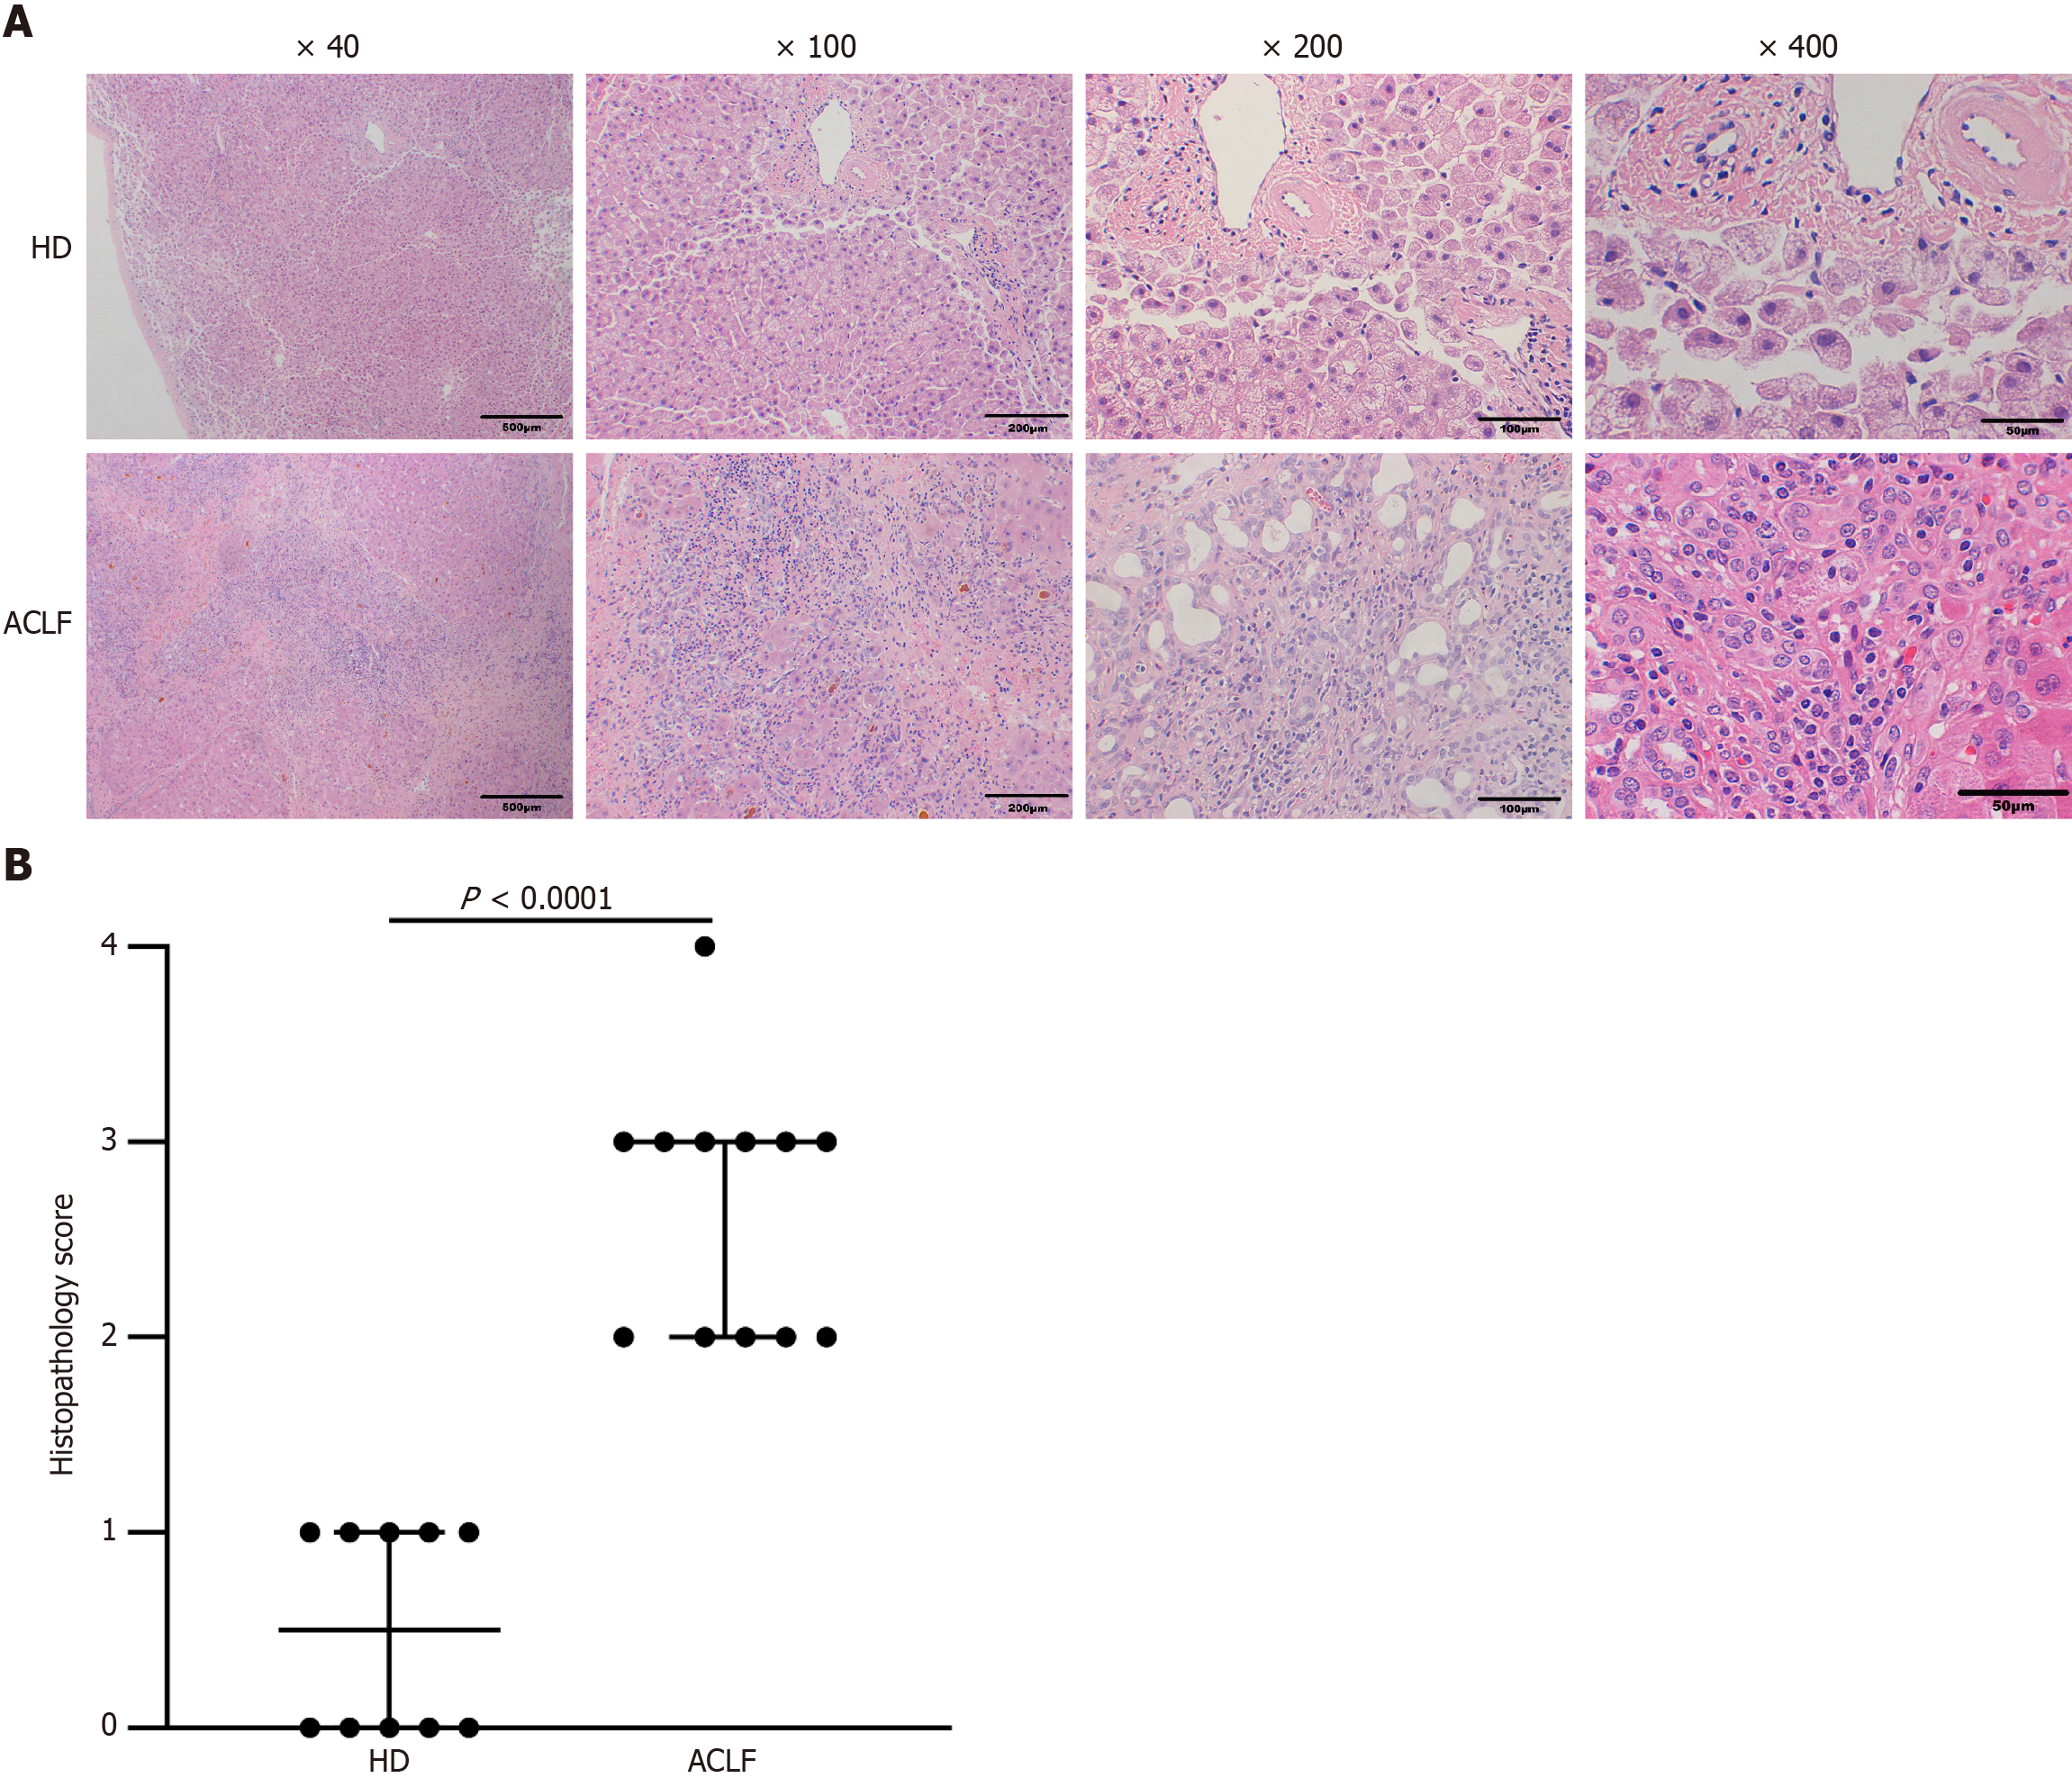
Figure 1 Liver histopathology in healthy donors and patients with acute-on-chronic liver failure.
A: HE staining of the liver tissue from healthy donors (n = 10) and patients with acute-on-chronic liver failure (n = 12); B: Histopathological Scoring. Data were compared using Mann-Whitney test. ACLF: Acute-on-chronic liver failure; HD: Healthy donor.
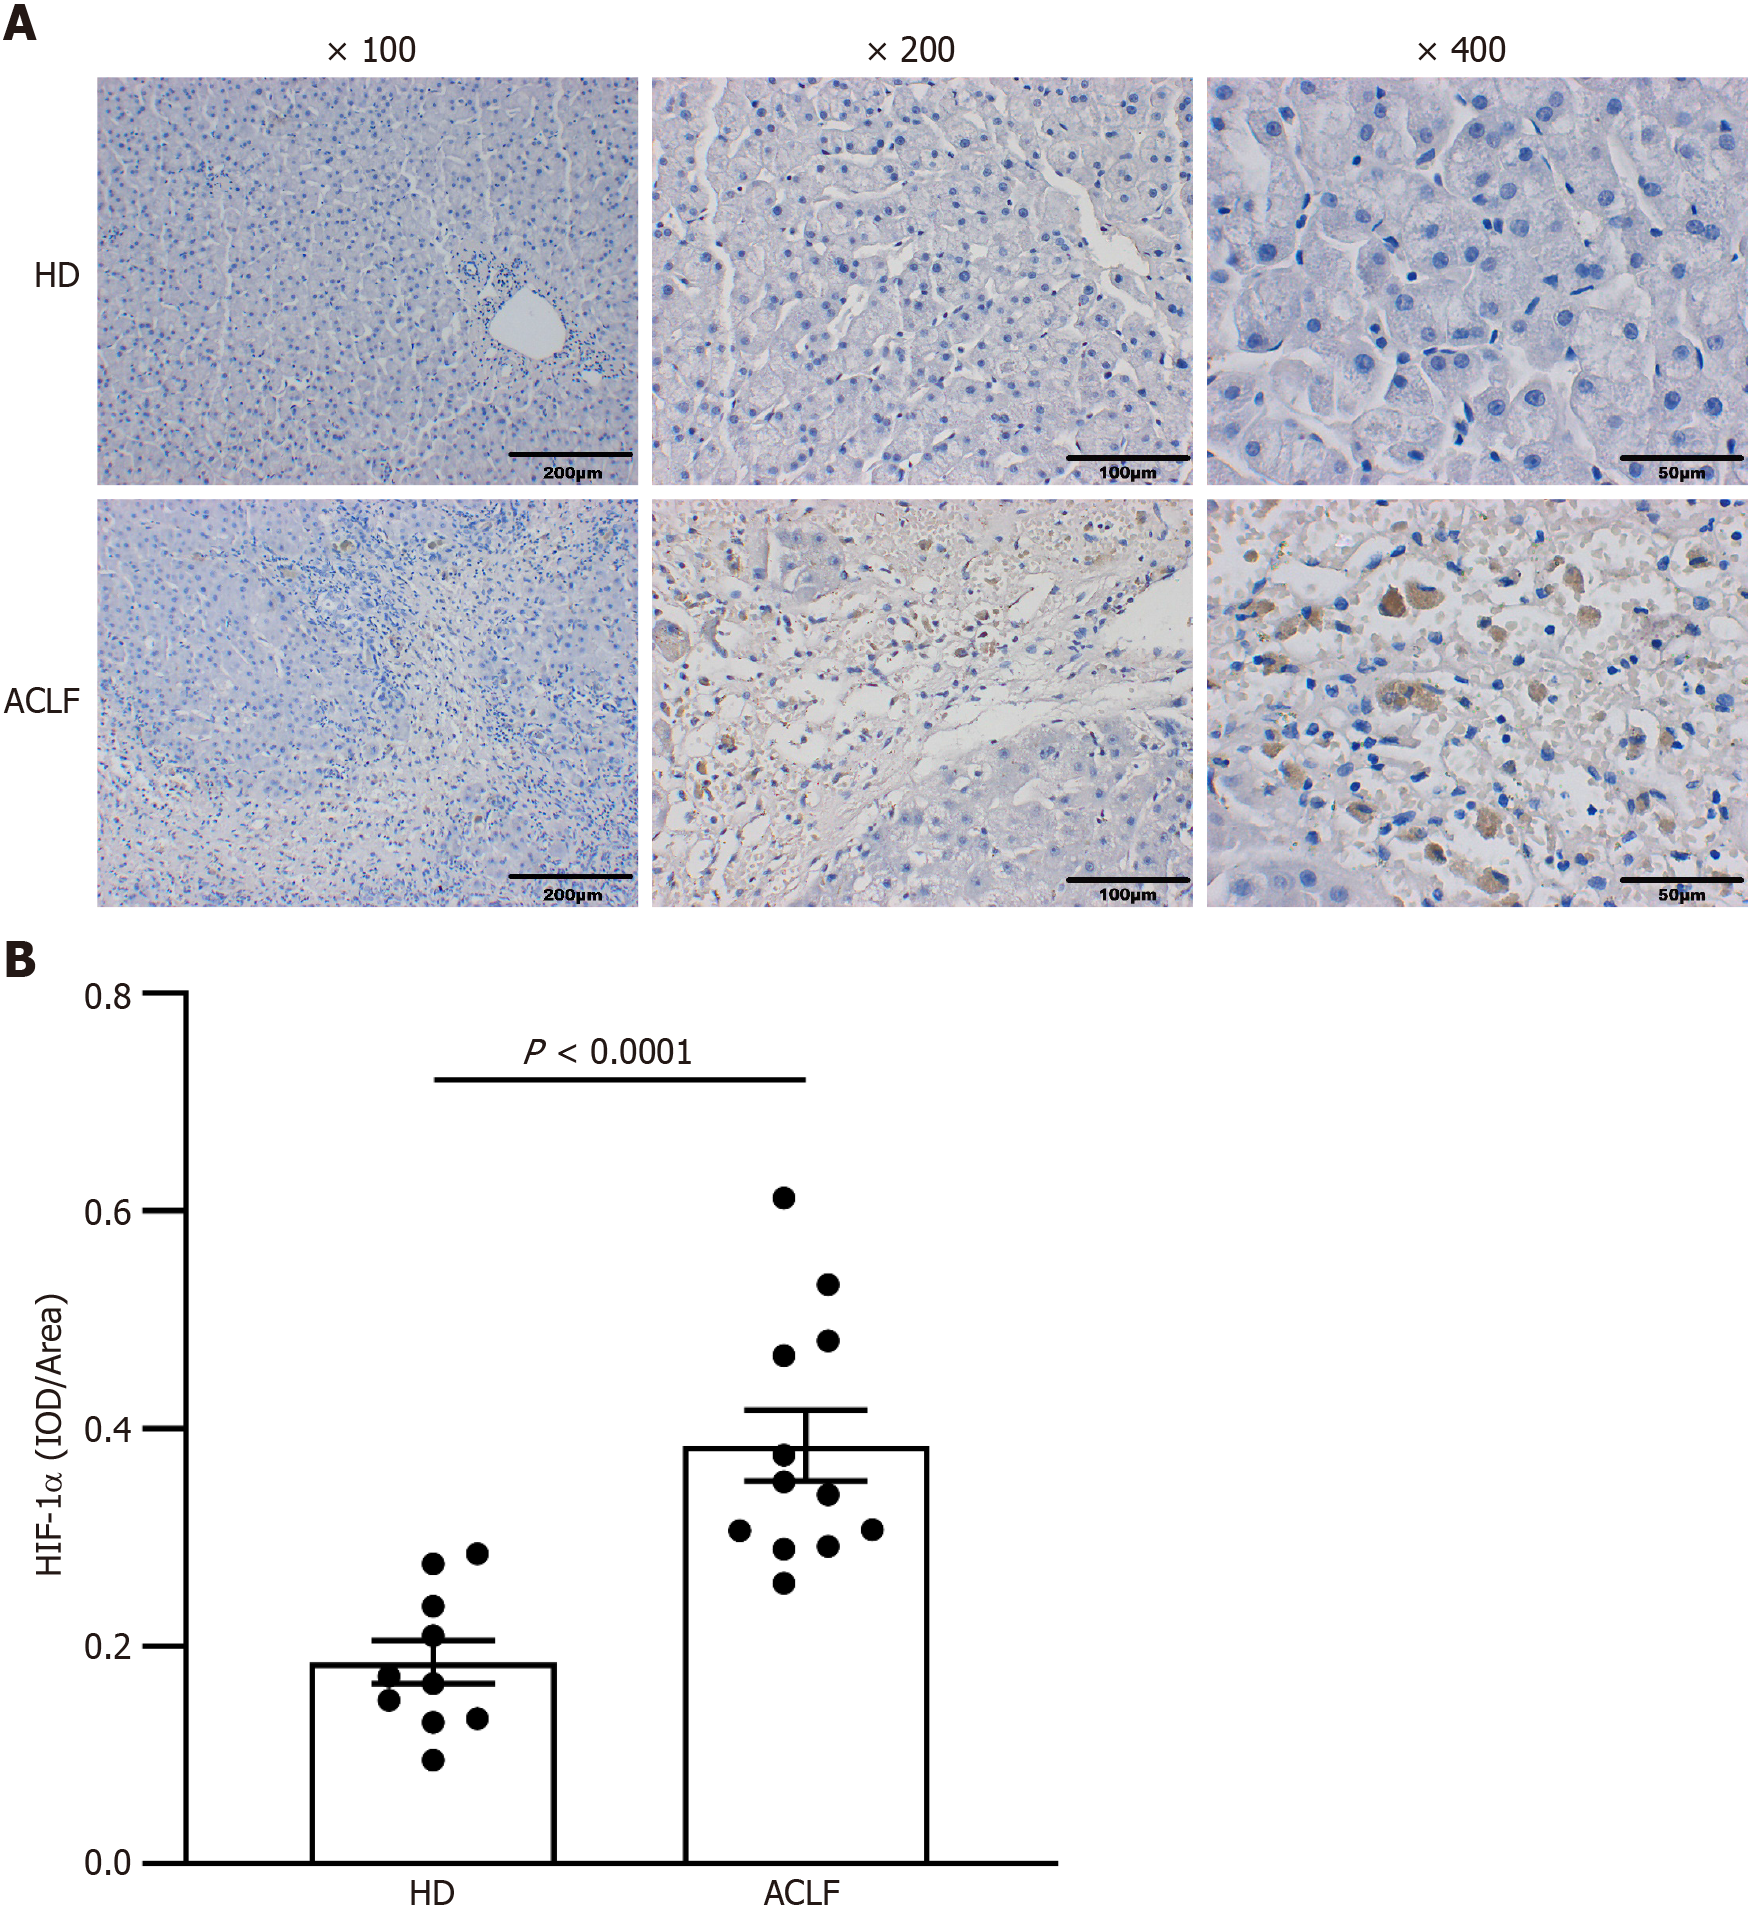
Figure 2 Expression of hypoxia-inducible factor-1α increased in the liver tissues of patients with acute-on-chronic liver failure.
A: Immunohistochemical staining of hypoxia-inducible factor-1α (HIF-1α); B: Semi-quantitative analysis of HIF-1α expression. Data were compared using unpaired student’s t-test. ACLF: Acute-on-chronic liver failure; HD: Healthy donor; HIF-1α: Hypoxia-inducible factor-1α.
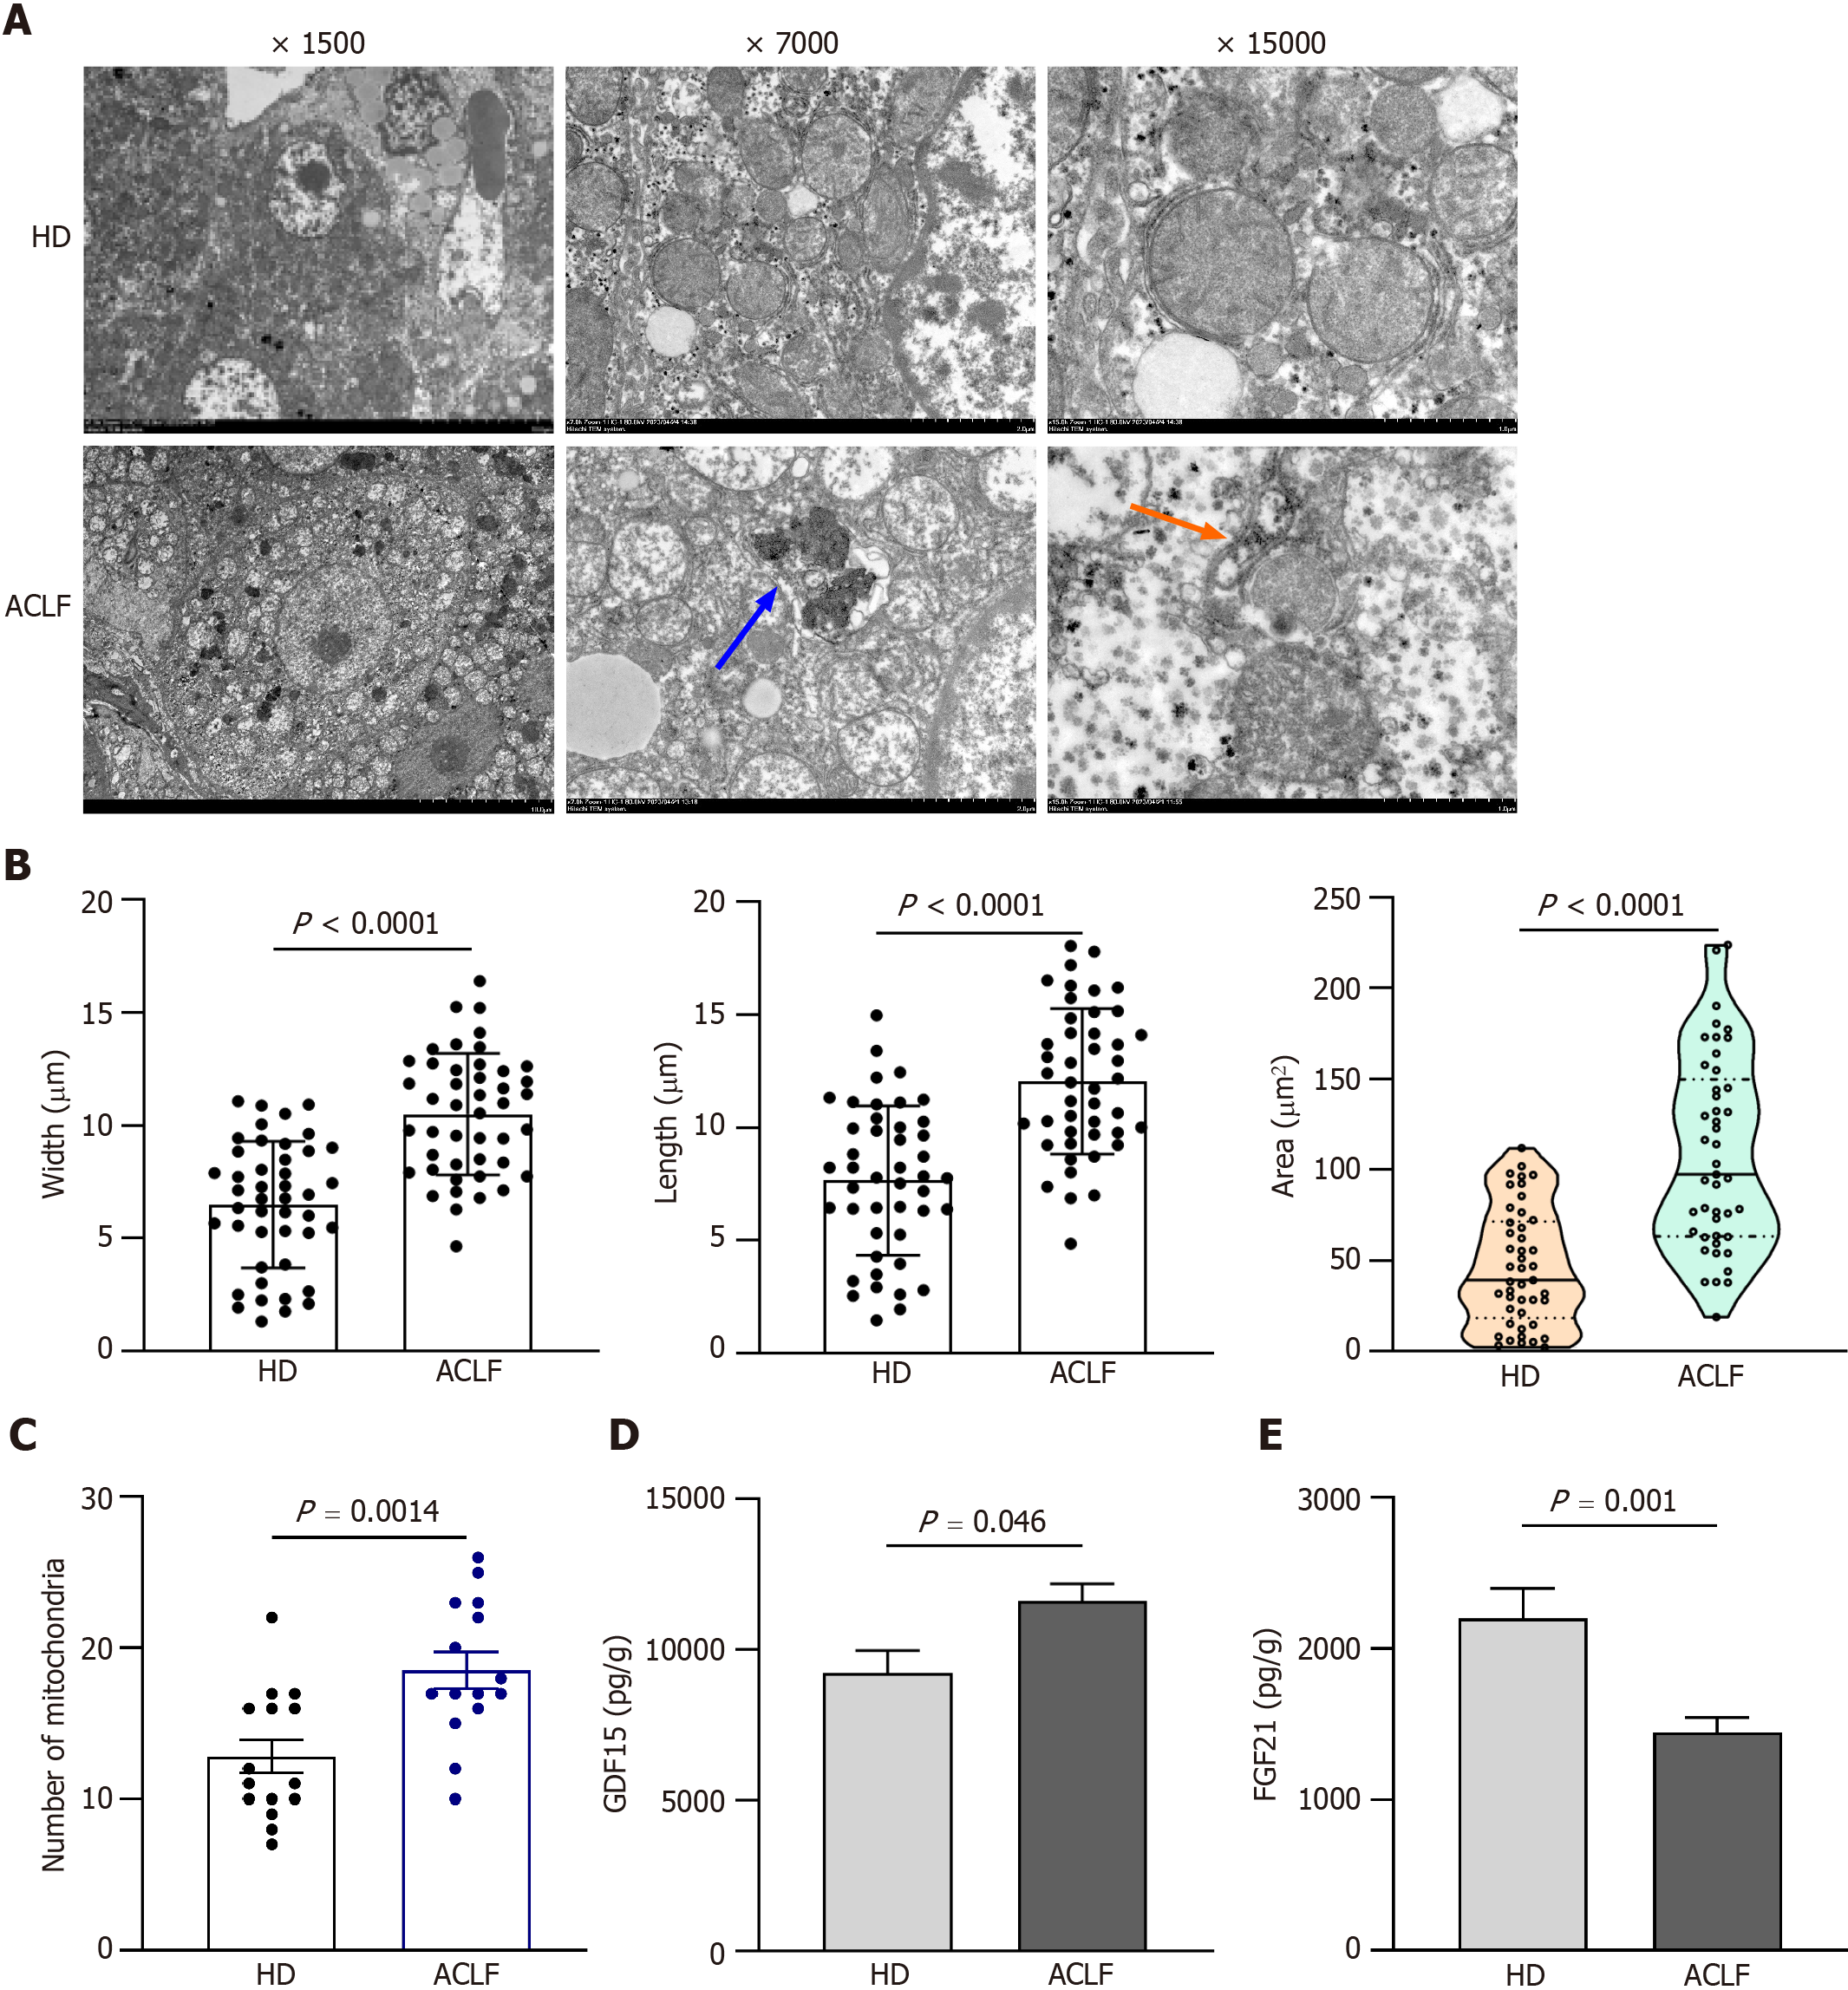
Figure 3 Mitochondrial morphology and function in the liver of patients with acute-on-chronic liver failure.
A: Representative electron microscopy images of hepatic mitochondria from 3 patients with acute-on-chronic liver failure (ACLF) and 3 healthy donors (HDs). Orange arrows indicate autophagosome; the blue arrow indicates autophagic lysosome; B: Length, width, and area of each mitochondrion; C: Number of mitochondria at original magnification of 7000 ; D: Growth differentiation factor 15 levels in liver homogenates of 12 HDs and 17 patients with ACLF; E: Fibroblast growth factor 21 levels in liver homogenates. Data with normal distribution were compared using unpaired student’s t-test, and the Mann-Whitney test was used for non-normal data. ACLF: Acute-on-chronic liver failure; HD: Healthy donor; GDF15: Growth differentiation factor 15; FGF21: Fibroblast growth factor 21.
Figure 4 Metabolic profiles of the liver of patients with acute-on-chronic liver failure.
A: Orthogonal partial least squares-discriminant analysis scatter plot; B: Permutation tests; C: Hierarchical clustergram of organic acid metabolites; D: Volcano plot comparing organic acid metabolites between patients with acute-on-chronic liver failure (n = 17) and healthy donors (n = 12); E: Quantitative analysis of differentially expressed organic acid metabolites; F: Kyoto Encylopedia of Genes and Genomes pathway enrichment analysis. Data with normal distribution were compared using unpaired student’s t-test, and the Mann-Whitney test was used for non-normal data. ACLF: Acute-on-chronic liver failure; HD: Healthy donor.
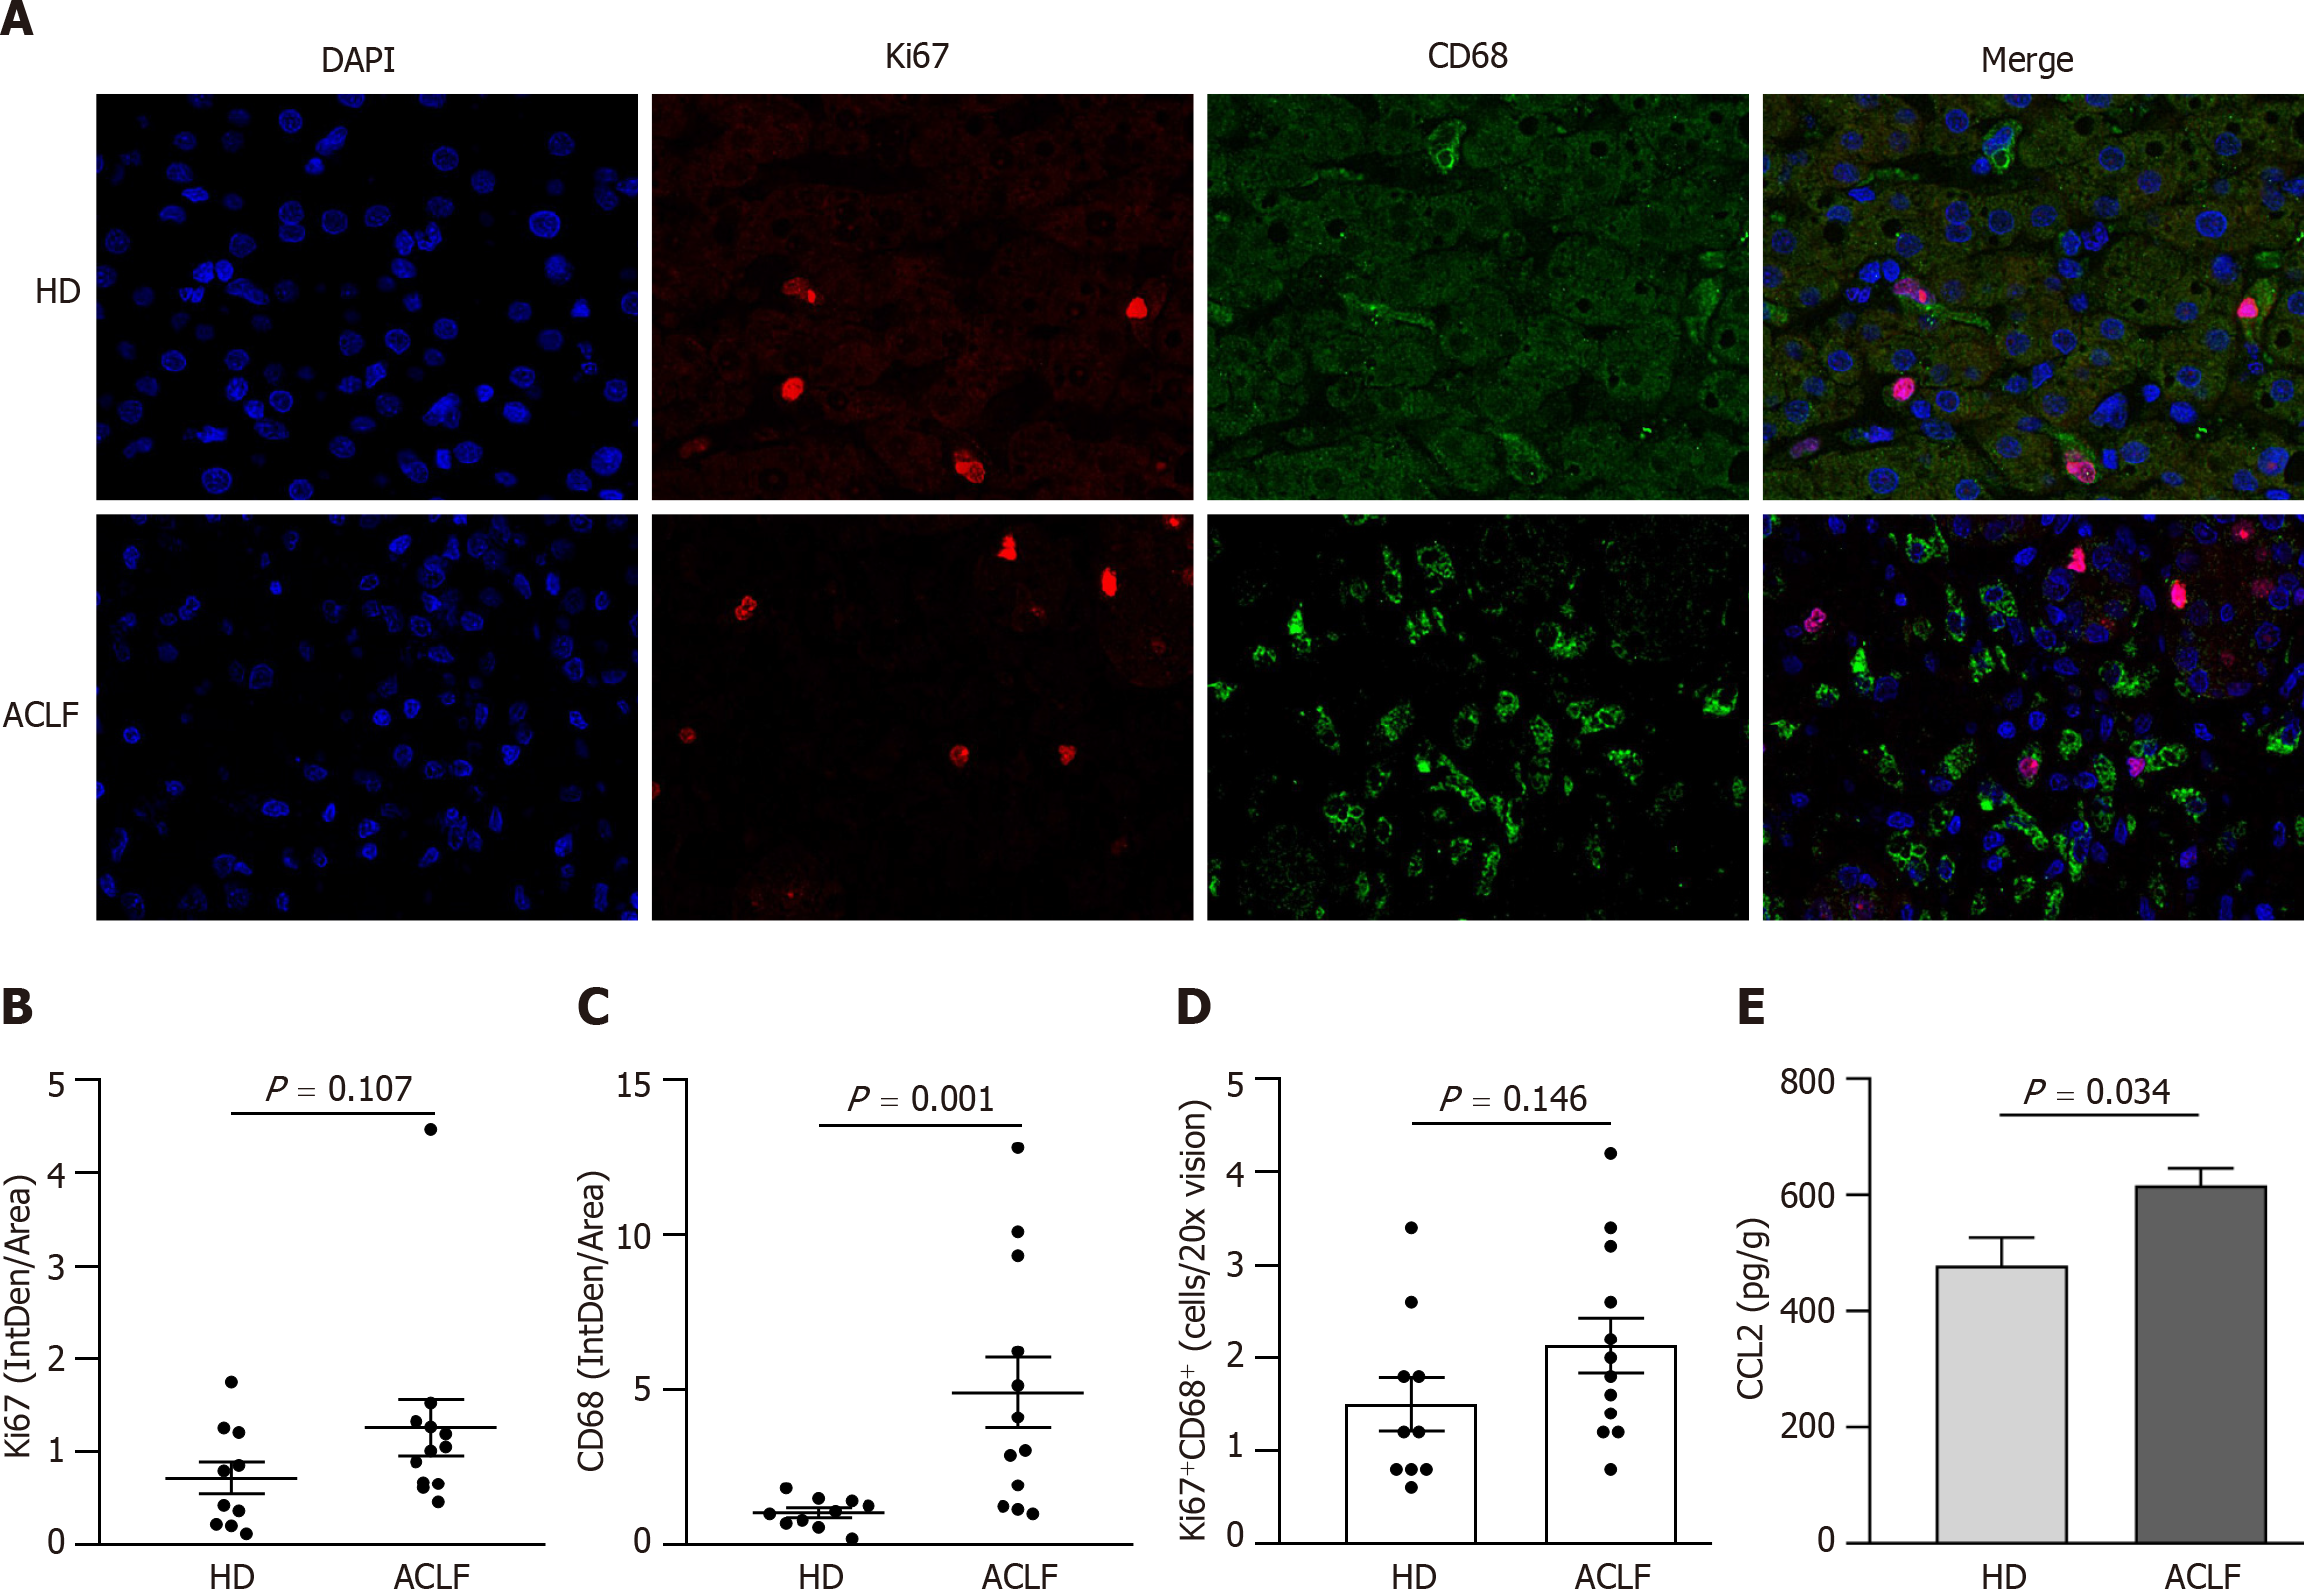
Figure 5 Macrophages were widely activated in the liver of patients with acute-on-chronic liver failure.
A: Representative microscopic images of the double immunofluorescence staining of Ki67 and CD68 in the liver (400 fold). The red fluorescence signal represented Ki67; the green fluorescence signal represented CD68; and the blue fluorescence signal represented DAPI; B: Ki67 immunofluorescence intensity in the liver of healthy donors (n = 10) and patients with acute-on-chronic liver failure (n = 12); C: CD68 immunofluorescence intensity in the liver; D: The mean number of Ki67+ CD68+-positive cells in five × 200 fields; E: Chemokine C-C motif ligand 2 levels in liver homogenates. Data with normal distribution were compared using unpaired student’s t-test, and the Mann-Whitney test was used for non-normal data. ACLF: Acute-on-chronic liver failure; HD: Healthy donor.
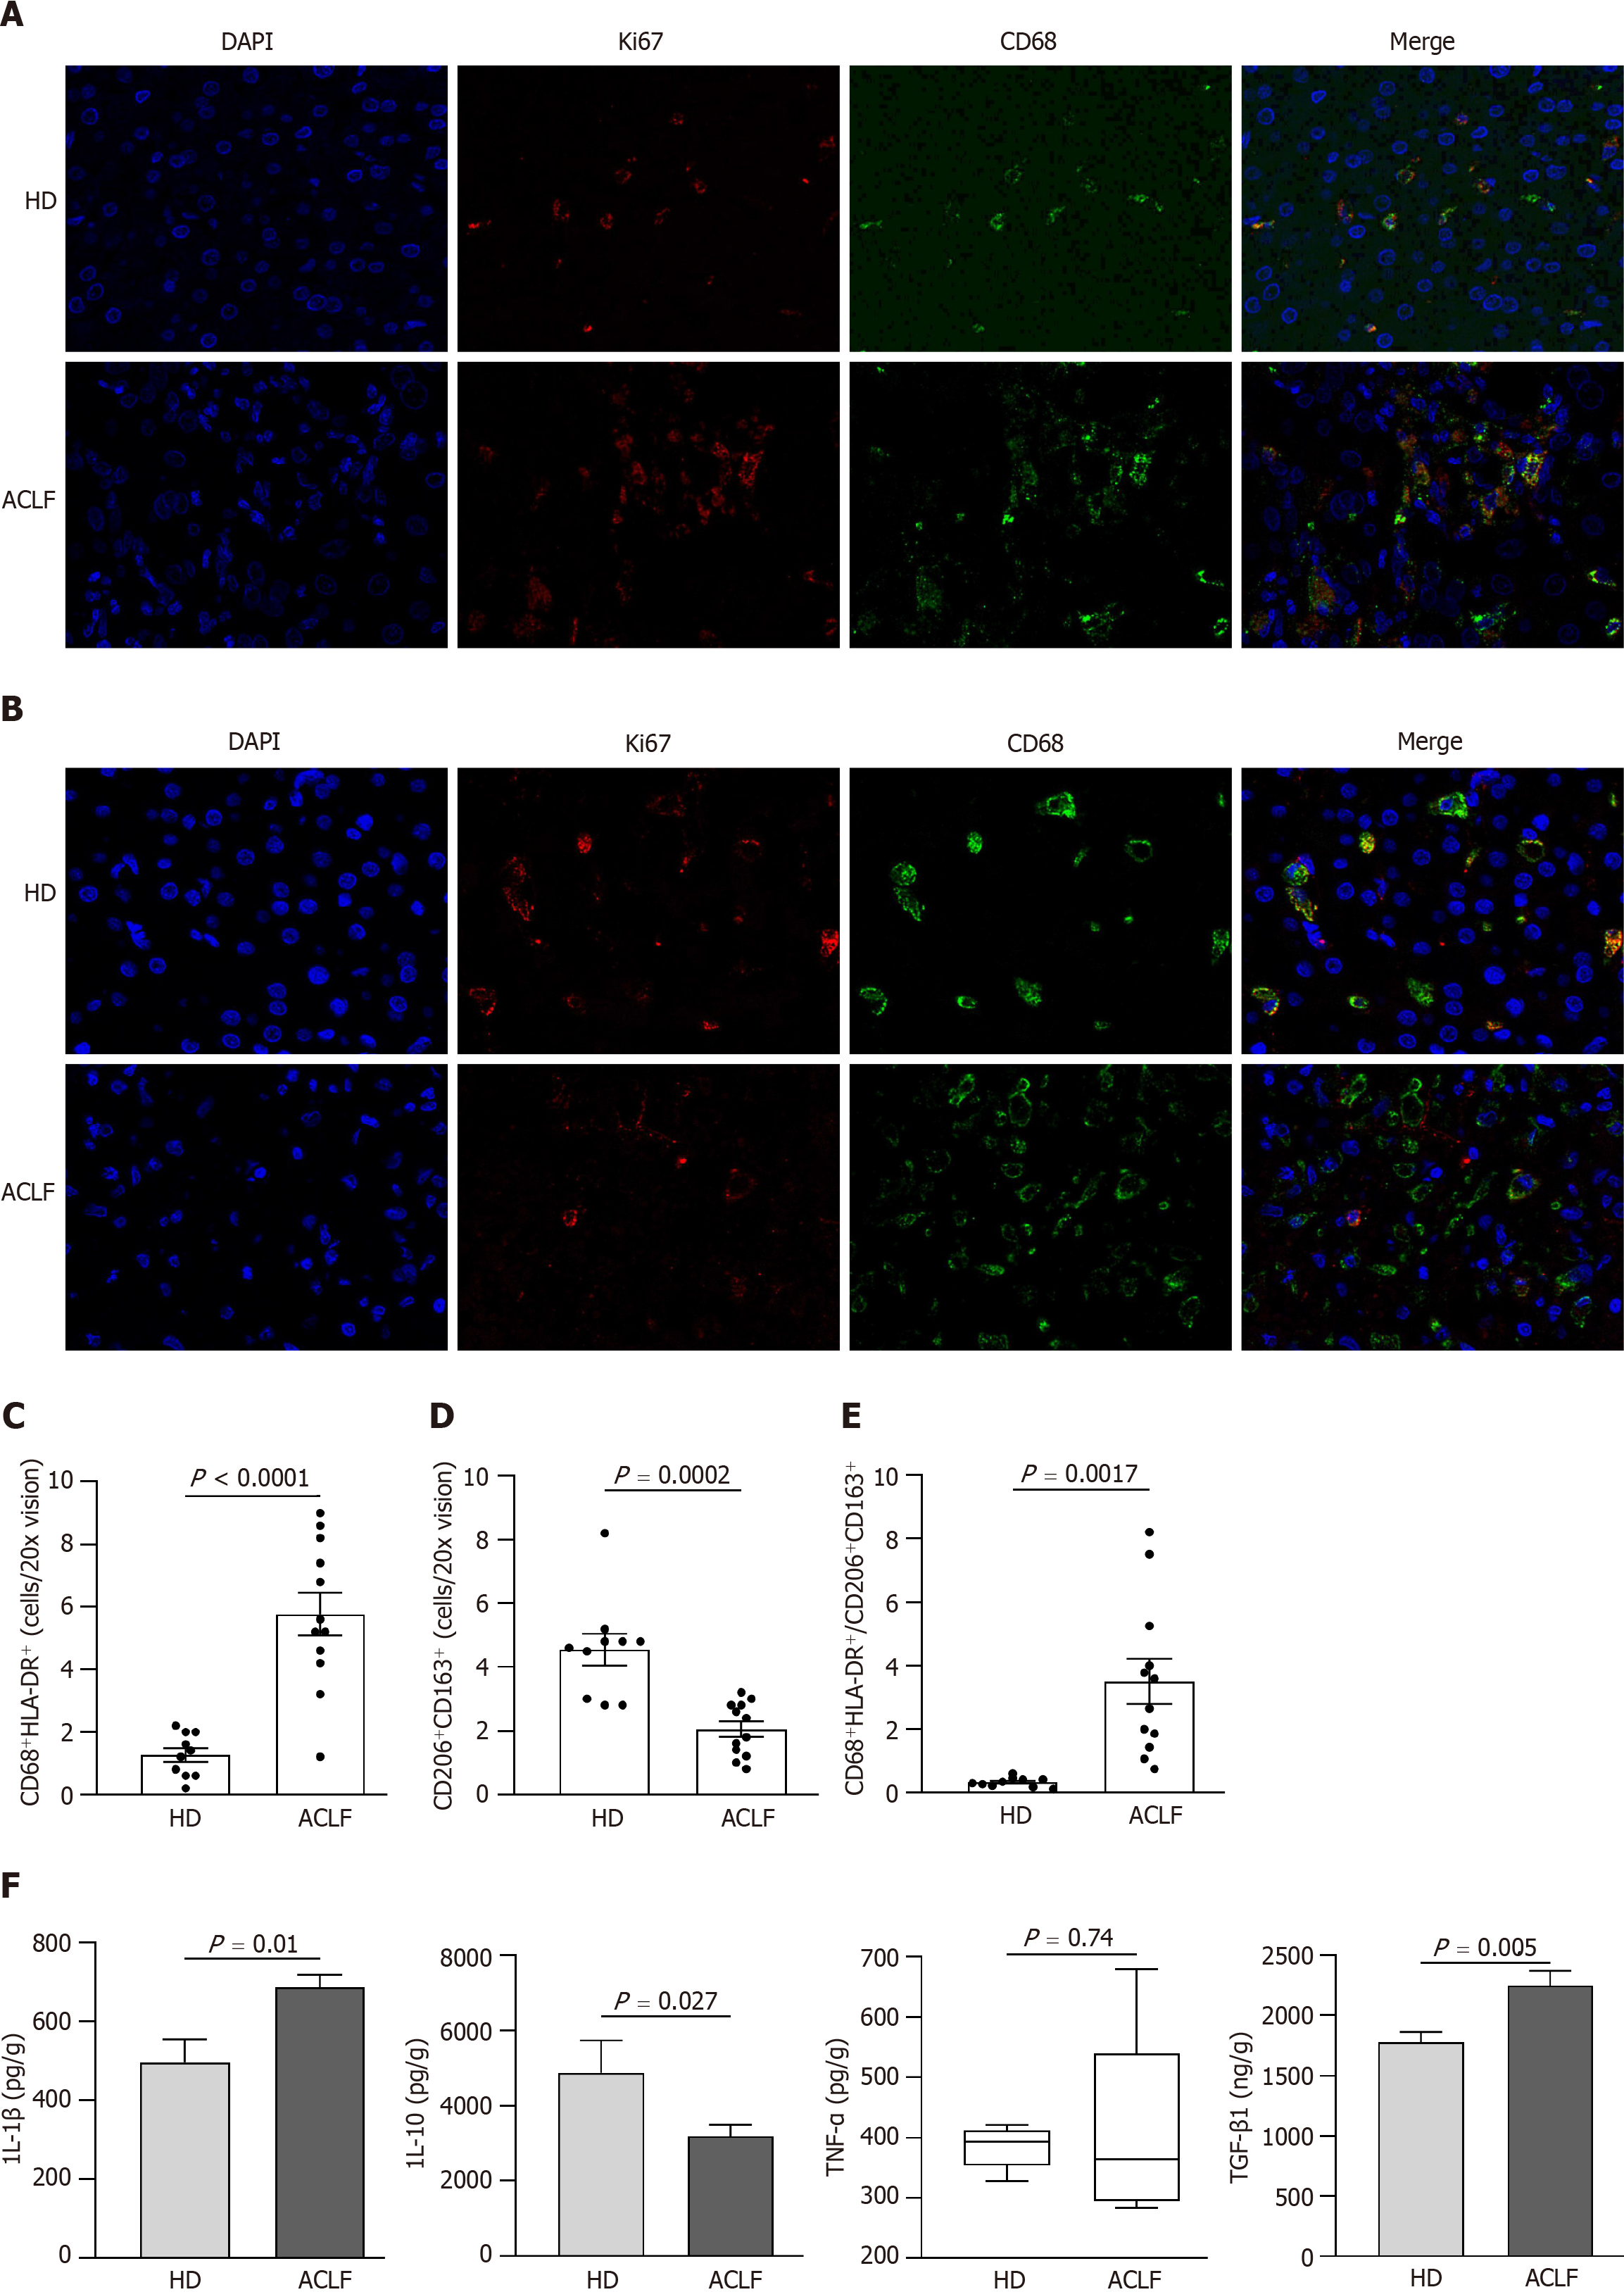
Figure 6 Generalized macrophages activation showed a classically activated phenotype in the liver of patients with acute-on-chronic liver failure.
A: Representative microscopic images of double immunofluorescence staining of CD68 and HLA-DR in the liver (400 fold). The red fluorescence signal represented CD68; the green fluorescence signal represented HLA-DR; and the blue fluorescence signal represented DAPI; B: Representative microscopic images of the double immunofluorescence staining of CD206 and CD163 in the liver (400 fold). The red fluorescence signal represented CD206; the green fluorescence signal represented CD163; and the blue fluorescence signal represented DAPI; C: The mean number of CD68+ HLA-DR+-positive cells in five × 200 fields; D: The mean number of CD206+ CD163+-positive cells in five × 200 fields; E: The ratio of CD68+ HLA-DR+/CD206+ CD163+-positive cells in healthy donors and patients with acute-on-chronic liver failure; F: The levels of macrophage-derived cytokines (interleukin-1β, tumor necrosis factor-α, interleukin-10, and transforming growth factor-β1) in liver homogenates. Data with normal distribution were compared using unpaired student’s t-test, and the Mann-Whitney test was used for non-normal data. ACLF: Acute-on-chronic liver failure; HD: Healthy donor; IL-1β: Interleukin-1β; IL-10: Interleukin-10; TNF-α: Tumor necrosis factor-α; TGF-β1: Transforming growth factor.
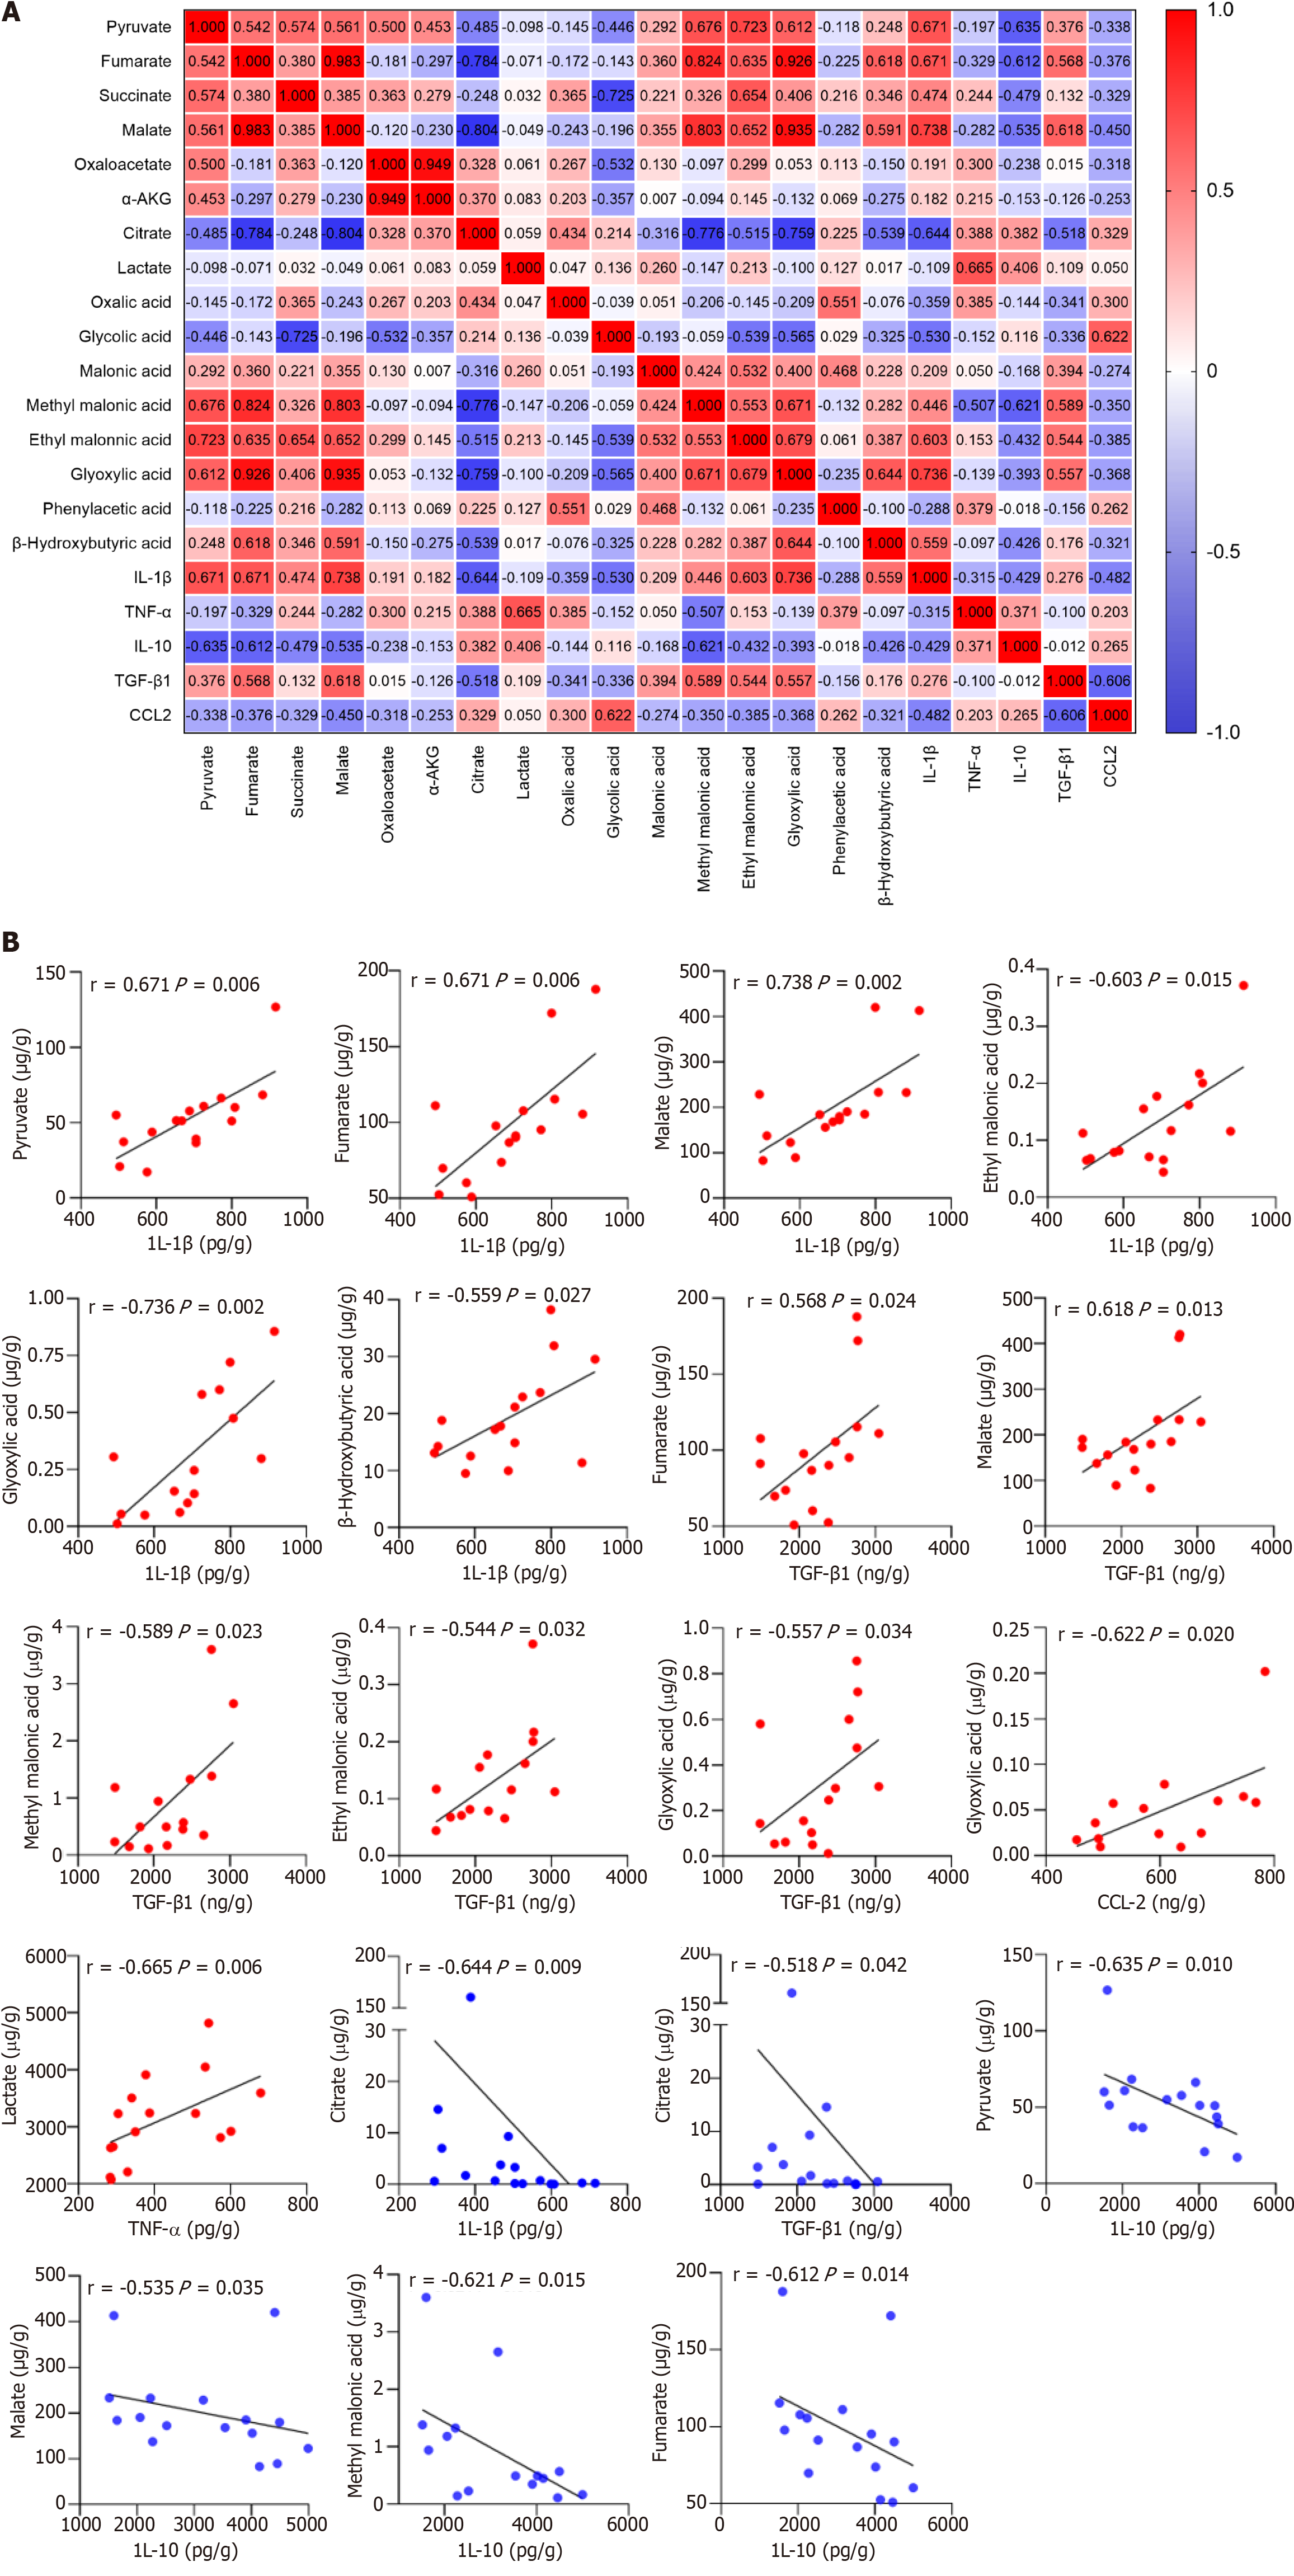
Figure 7 Correlation plot between the 16 organic acid metabolites and macrophage-derived cytokines/chemokines in patients with acute-on-chronic liver failure (n = 17).
A: Correlation plot between the 16 organic acid metabolites and cytokines/chemokines; B: Linear correlation scatter plot between the organic acid metabolites and cytokines/chemokines (P 0.05). The Spearman test was used to measure the correlations of non-normally distributed variables. IL-1β: Interleukin-1β; IL-10: Interleukin-10; TNF-α: Tumor necrosis factor-α; TGF-β1: Transforming growth factor. CCL-2: Chemokine C-C motif ligand 2.
- Citation: Zhang Y, Tian XL, Li JQ, Wu DS, Li Q, Chen B. Mitochondrial dysfunction affects hepatic immune and metabolic remodeling in patients with hepatitis B virus-related acute-on-chronic liver failure. World J Gastroenterol 2024; 30(8): 881-900
- URL: https://www.wjgnet.com/1007-9327/full/v30/i8/881.htm
- DOI: https://dx.doi.org/10.3748/wjg.v30.i8.881


