Copyright
©The Author(s) 2024.
World J Gastroenterol. Feb 28, 2024; 30(8): 843-854
Published online Feb 28, 2024. doi: 10.3748/wjg.v30.i8.843
Published online Feb 28, 2024. doi: 10.3748/wjg.v30.i8.843
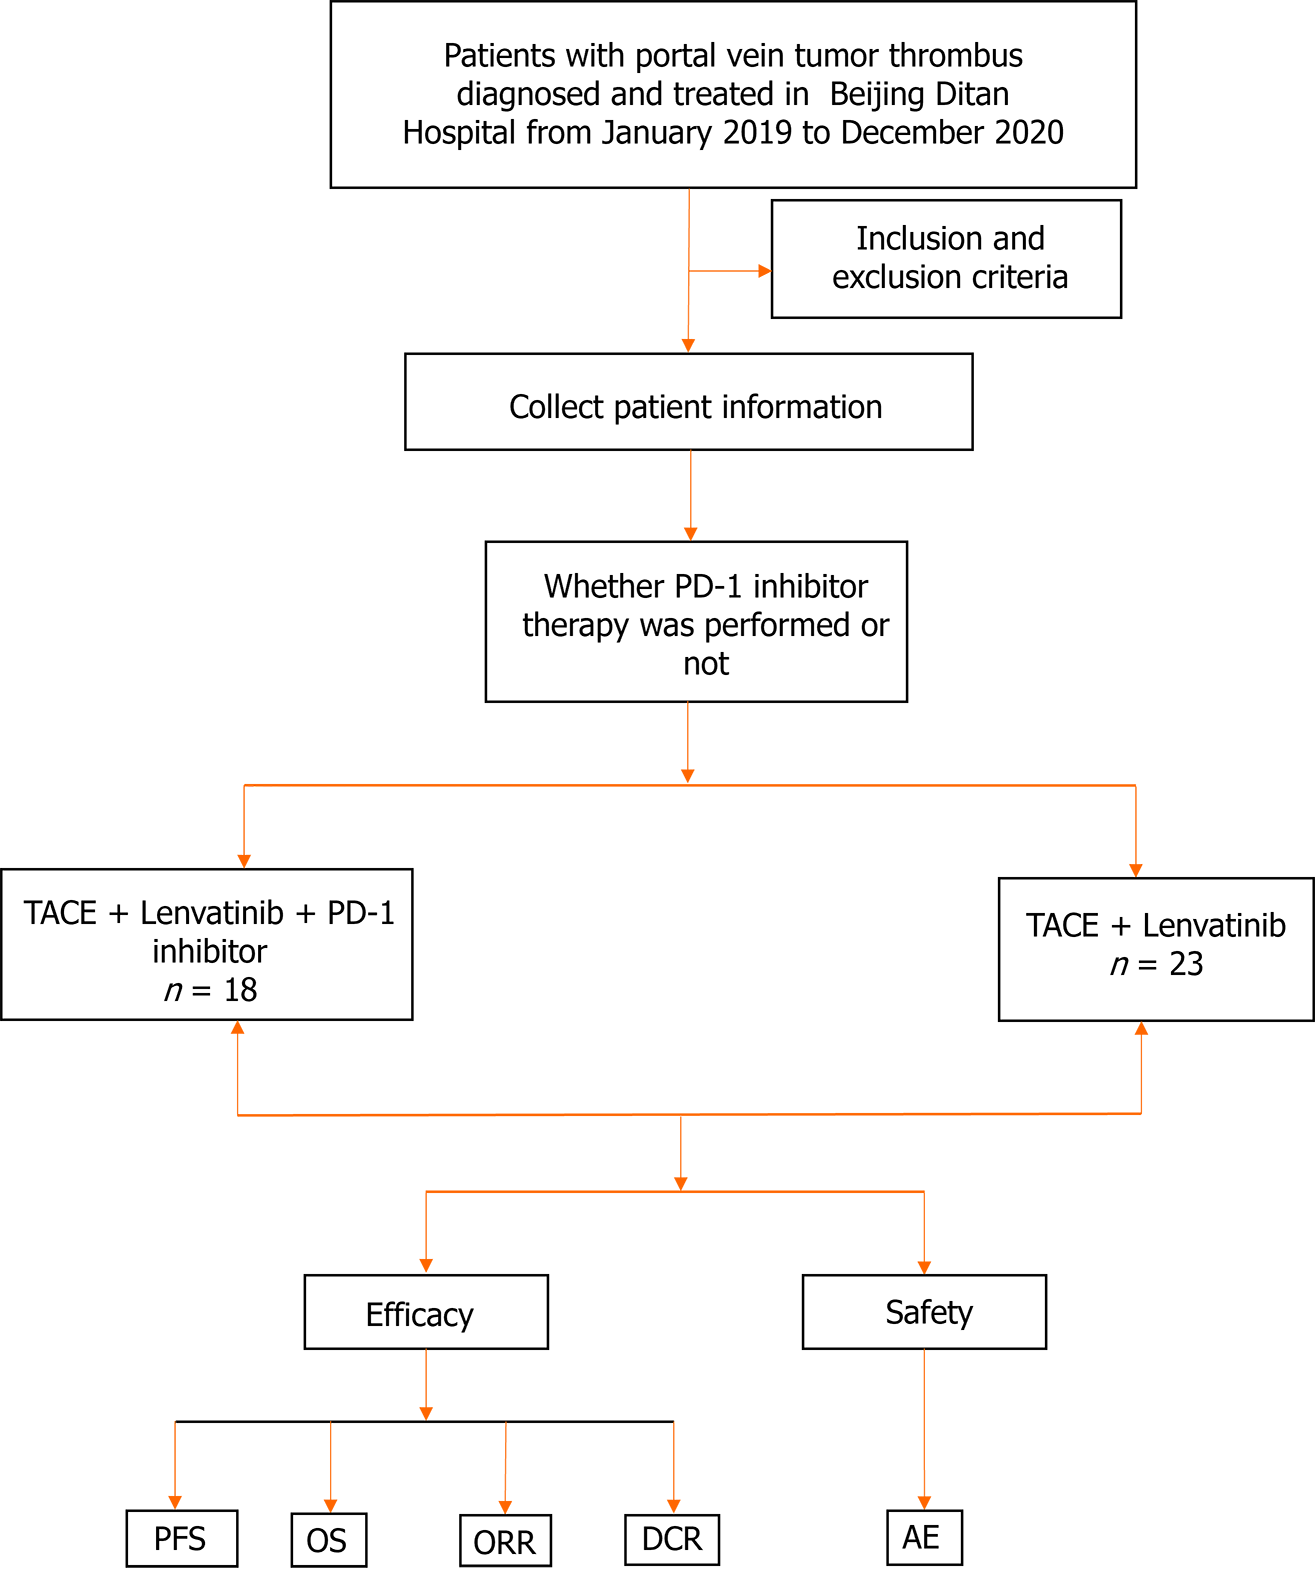
Figure 1 Trial flowchart.
Flowchart illustration of patient selection strategy. A total of 41 patients were finally selected, of which 18 patients received treatments with the PD-1 inhibitor/transcatheter arterial chemoembolization (TACE)/Lenvatinib, and 23 patients with the TACE/Lenvatinib regimen. TACE: Transcatheter arterial chemoembolization; AE: Adverse event; PFS: Progression-free survival; OS: Overall survival; ORR: Objective response rate; DCR: Disease control rate.
Figure 2 Kaplan-Meier curves estimate prognosis.
A: Kaplan-Meier curves estimate median progression free survival by treatment modality; B: Kaplan-Meier curves estimate median overall survival by treatment modality; C: Kaplan-Meier curves estimate median progression free survival for patients with different Eastern Cooperative Oncology Group scores. TACE: Transcatheter arterial chemoembolization; ECOG: Eastern Cooperative Oncology Group; PFS: Progression-free survival; OS: Overall survival.
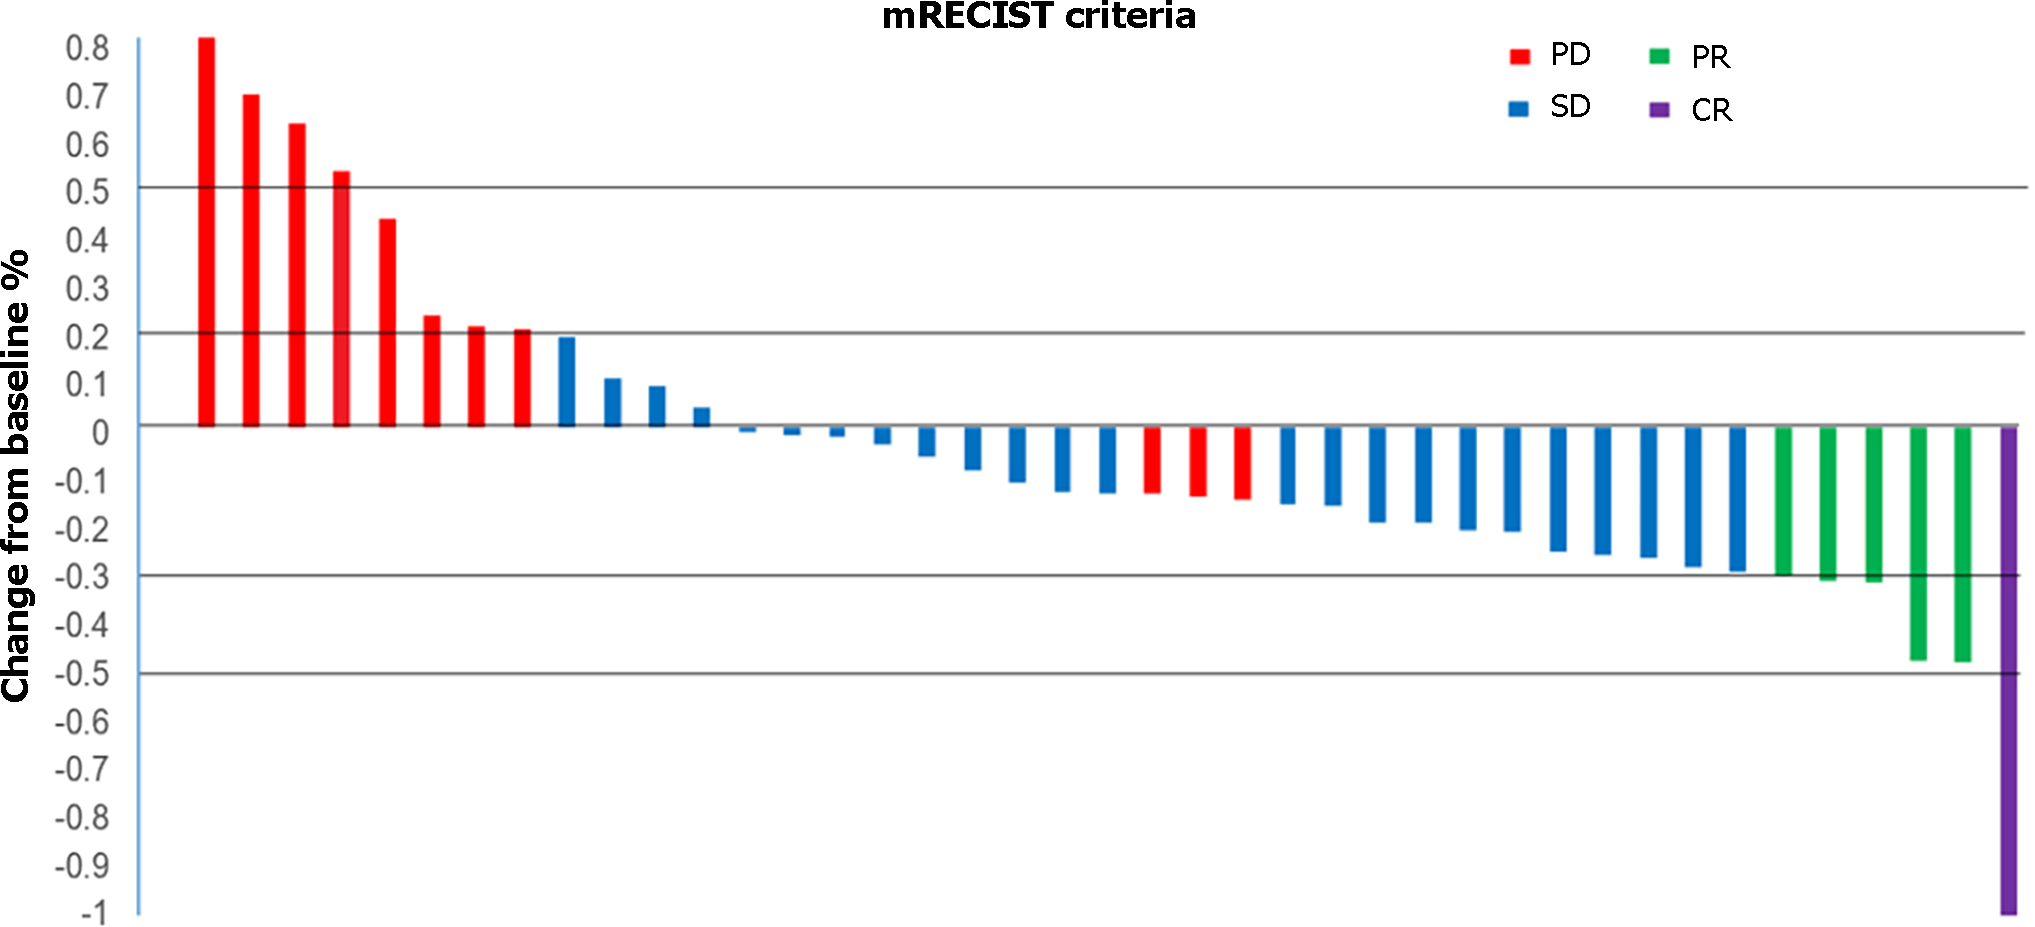
Figure 3 Waterfall plot of maximum tumor response to triple therapy by investigator using the modified Response Evaluation Criteria in Solid Tumors.
Waterfall plots showing the maximum level tumor responses to triple therapy by investigators using the mRECIST approach. mRECIST: Modified Response Evaluation Criteria in Solid Tumors; PD: Progressive disease; SD: Stable disease; PR: Partial remission; CR: Complete remission.
- Citation: Wu HX, Ding XY, Xu YW, Yu MH, Li XM, Deng N, Chen JL. Transcatheter arterial chemoembolization combined with PD-1 inhibitors and Lenvatinib for hepatocellular carcinoma with portal vein tumor thrombus. World J Gastroenterol 2024; 30(8): 843-854
- URL: https://www.wjgnet.com/1007-9327/full/v30/i8/843.htm
- DOI: https://dx.doi.org/10.3748/wjg.v30.i8.843


