Copyright
©The Author(s) 2024.
World J Gastroenterol. Apr 21, 2024; 30(15): 2155-2174
Published online Apr 21, 2024. doi: 10.3748/wjg.v30.i15.2155
Published online Apr 21, 2024. doi: 10.3748/wjg.v30.i15.2155
Figure 1 OSW-1 suppressed HT29 and HCT116 cell survival.
A: Chemical structure of OSW-1; B: Cell counting kit-8 assay was used to access the viability of HT29 and HCT116 cells treated with different concentrations of OSW-1 for 24 h; C: Lactate dehydrogenase release assays were used to assess the cell death rate of HT29 and HCT116 cells treated with different concentrations of OSW-1 for 24 h; D: A colony formation assay was used to evaluate the clonogenic survival of HT29 and HCT116 cells following treatment with OSW-1; E: Flow cytometry with Annexin V-FITC/propidium iodide double staining was used to assess the percentage of apoptotic and necrotic HT29 and HCT116 cells after OSW-1 treatment; F: JC-1 staining was used to assess mitochondrial function in HT29 and HCT116 cells after OSW-1 treatment. bP < 0.01 vs Control, cP < 0.05 vs OSW-1 (1 μM). Each data point represents the mean ± SE. LDH: Lactate dehydrogenase; PI: Propidium iodide.
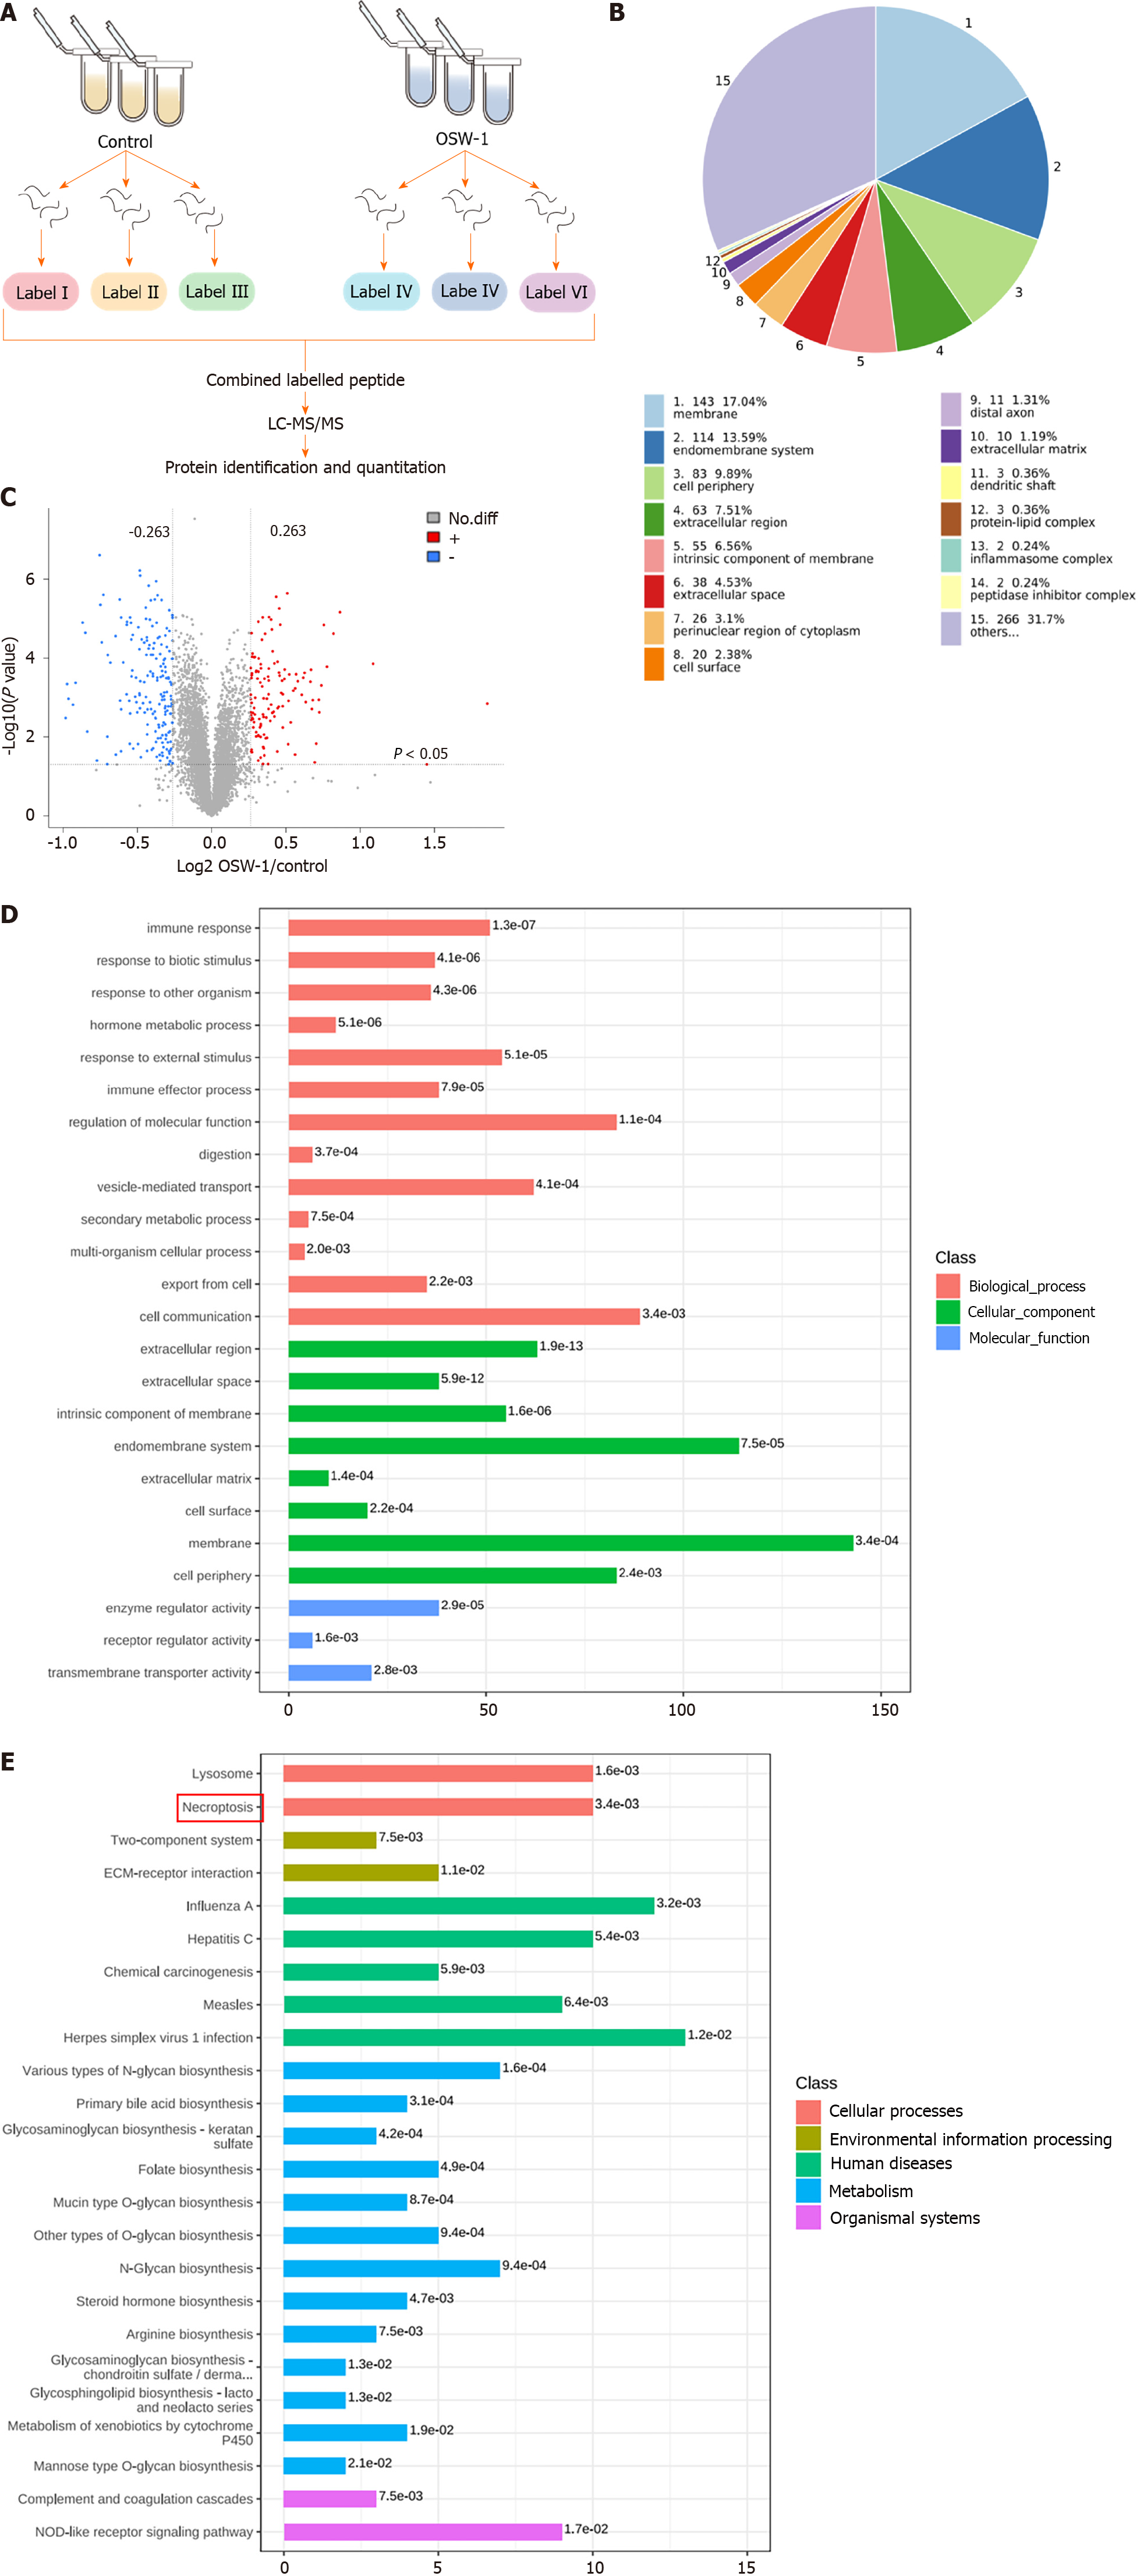
Figure 2 Quantitative proteomic analysis was also conducted on control and OSW-1-treated colorectal cancer cells, and bioinformatic analyses were subsequently performed on the differentially expressed proteins.
A: Schematic diagram outlining the process of proteomic analysis in this study; B: Subcellular localization of proteins that were altered by OSW-1; C: Volcano plot showing OSW-1-induced changes in proteins; red dots indicate increased proteins, and blue dots indicate decreased proteins; D: The top 20 enriched gene ontology (GO) terms were identified using Fisher’s exact test for the biological process, molecular function, and cellular component categories. The vertical axis shows the GO terms in each category, while the horizontal axis shows the protein number for each item. The numbers beside the bars indicate enrichment factors, indicating the significance and reliability of the proteins enriched in each item; E: Enriched Kyoto Encyclopedia of Genes and Genomes pathways associated with the differentially expressed proteins, with the numbers beside the bars representing the P value calculated using Fisher’s exact test.
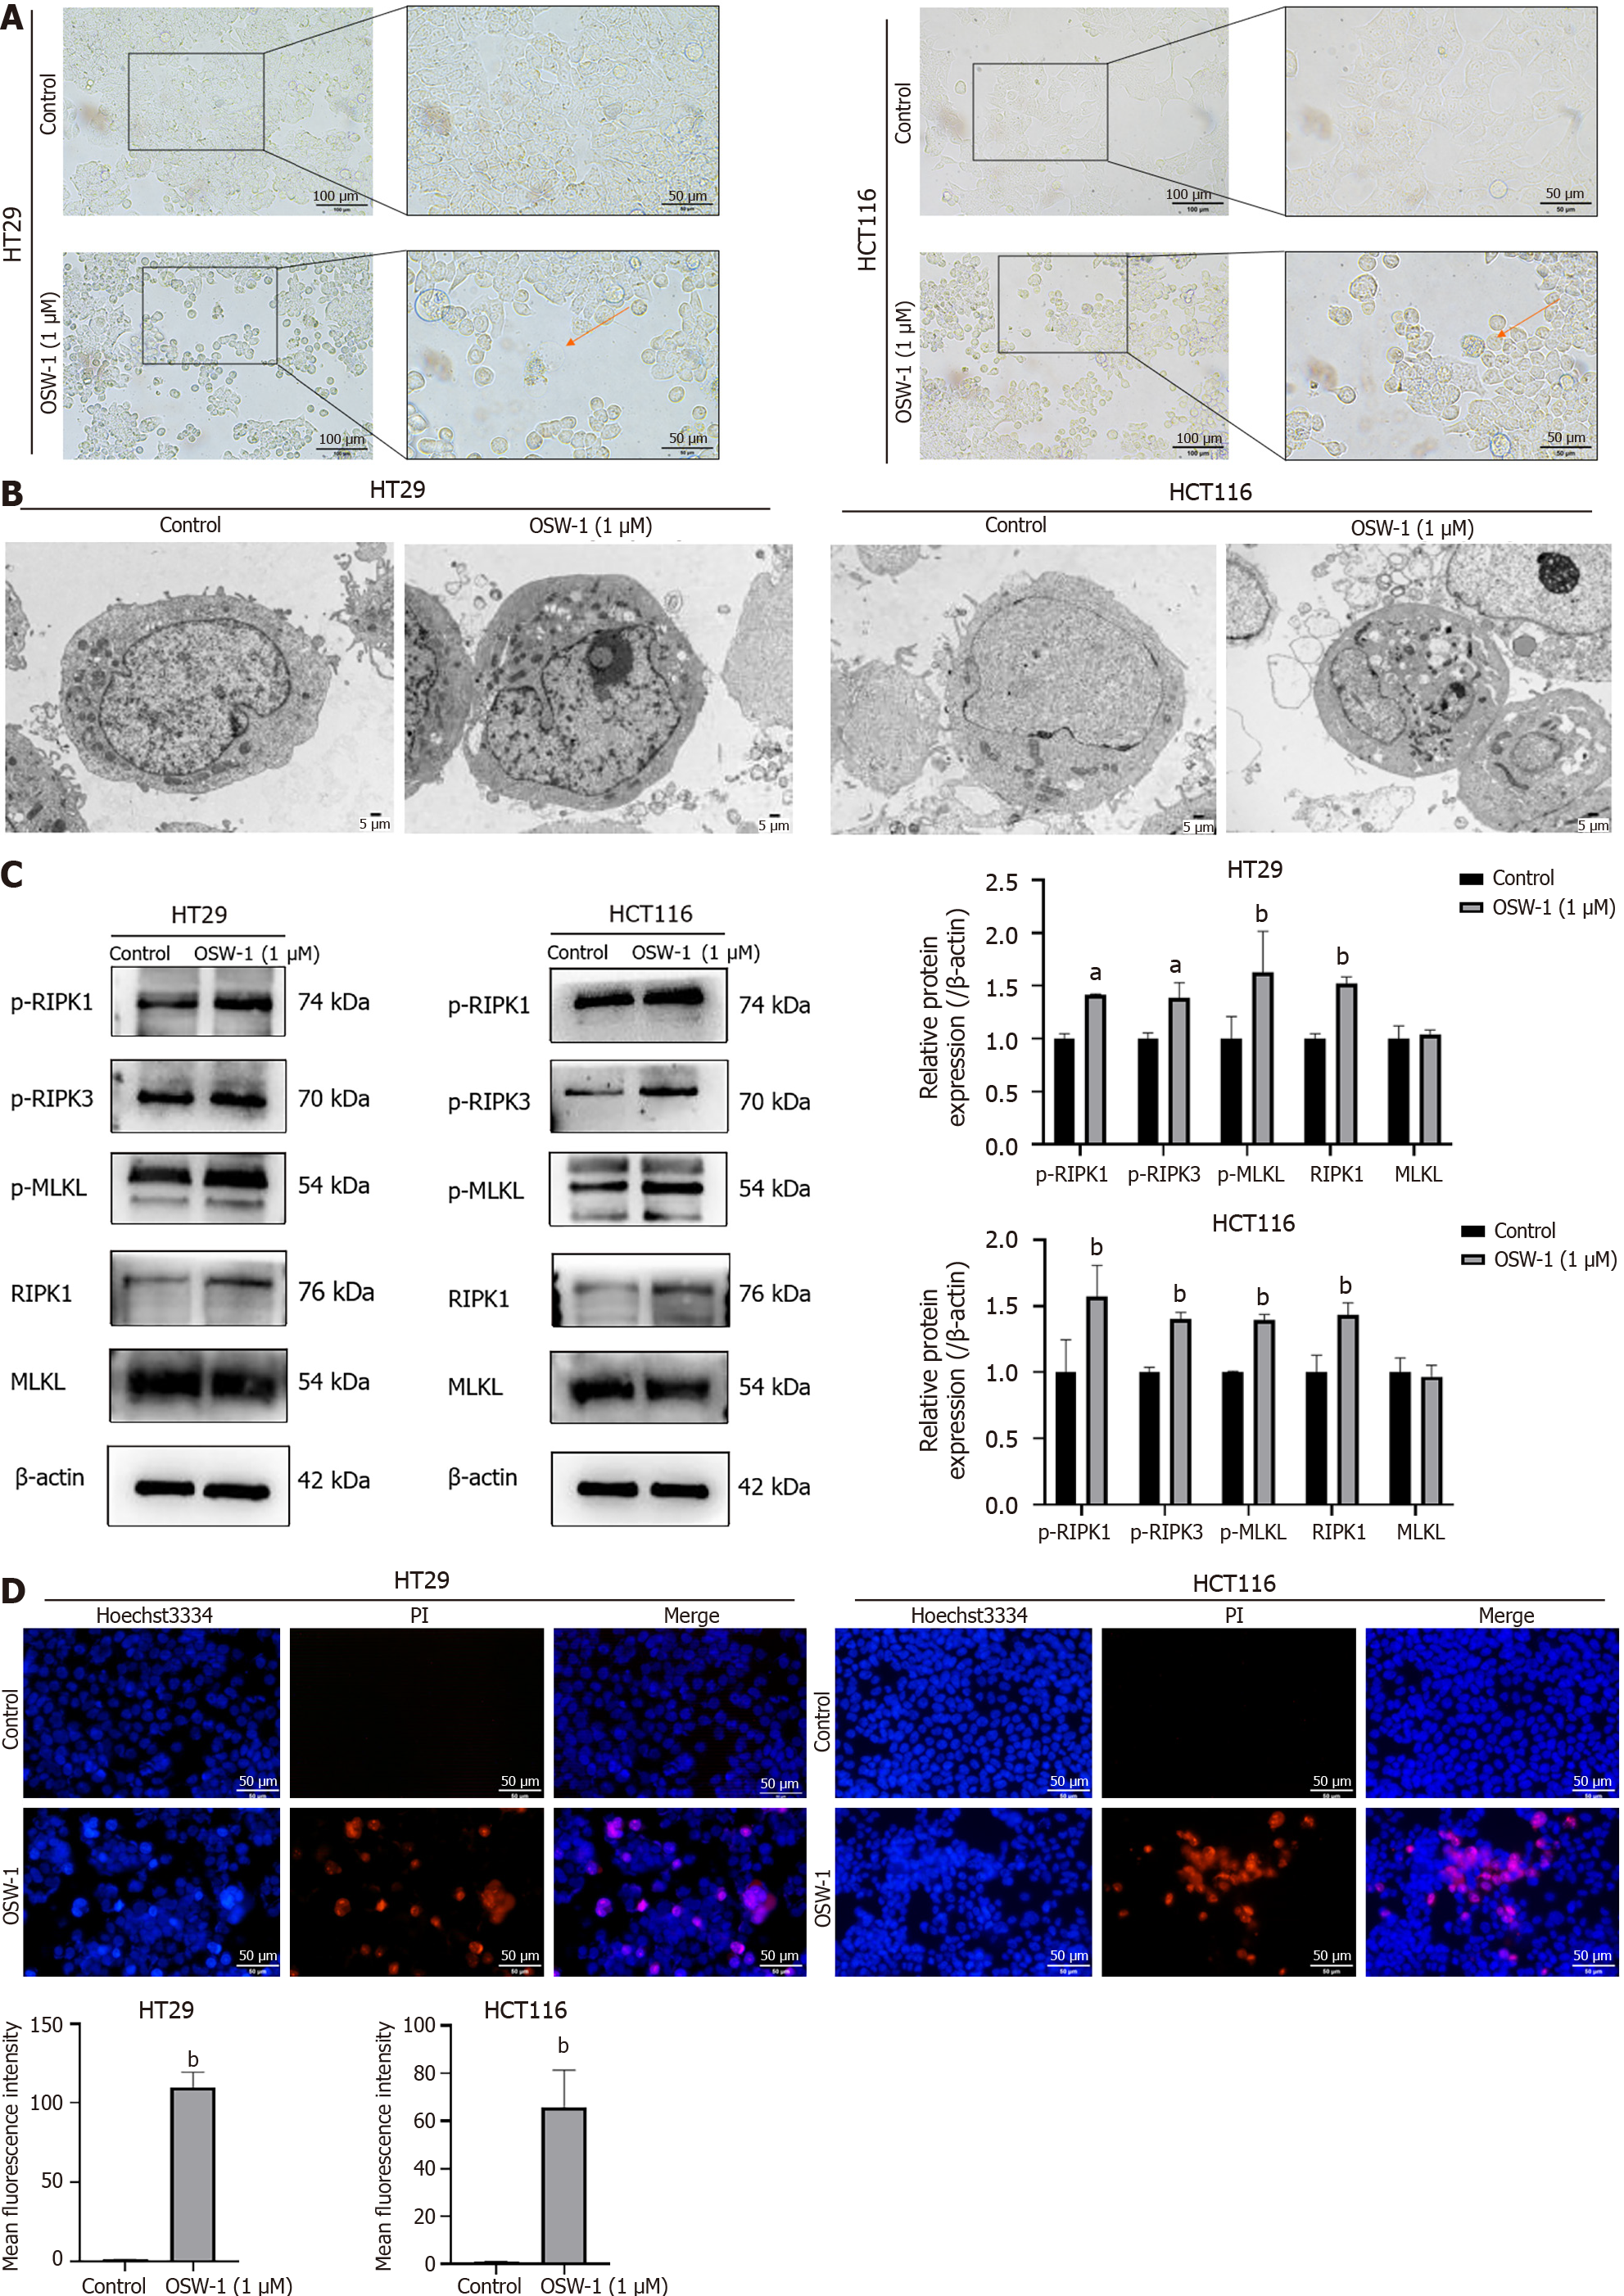
Figure 3 OSW-1 triggers necroptosis in colorectal cancer cell culture.
A: Necrotic morphological changes were observed in HT29 and HCT116 cells treated with OSW-1 using optical microscopy (400 × magnification). Necrotic cells are indicated by red arrows; B: Typical morphological changes associated with necroptosis were identified in HT29 and HCT116 cells treated with OSW-1 through TEM (3000 × magnification); C: The expression levels of proteins associated with necroptosis in HT29 and HCT116 cells following 24 h of exposure to OSW-1; D: A Hoechst 33342/propidium iodide dual staining assay was used to assess the rate of necroptosis in HT29 and HCT116 cells following treatment with OSW-1. Scale bar = 50 μm. aP < 0.05 and bP < 0.01 vs Control. Each data point represents the mean ± SE. PI: Propidium iodide.
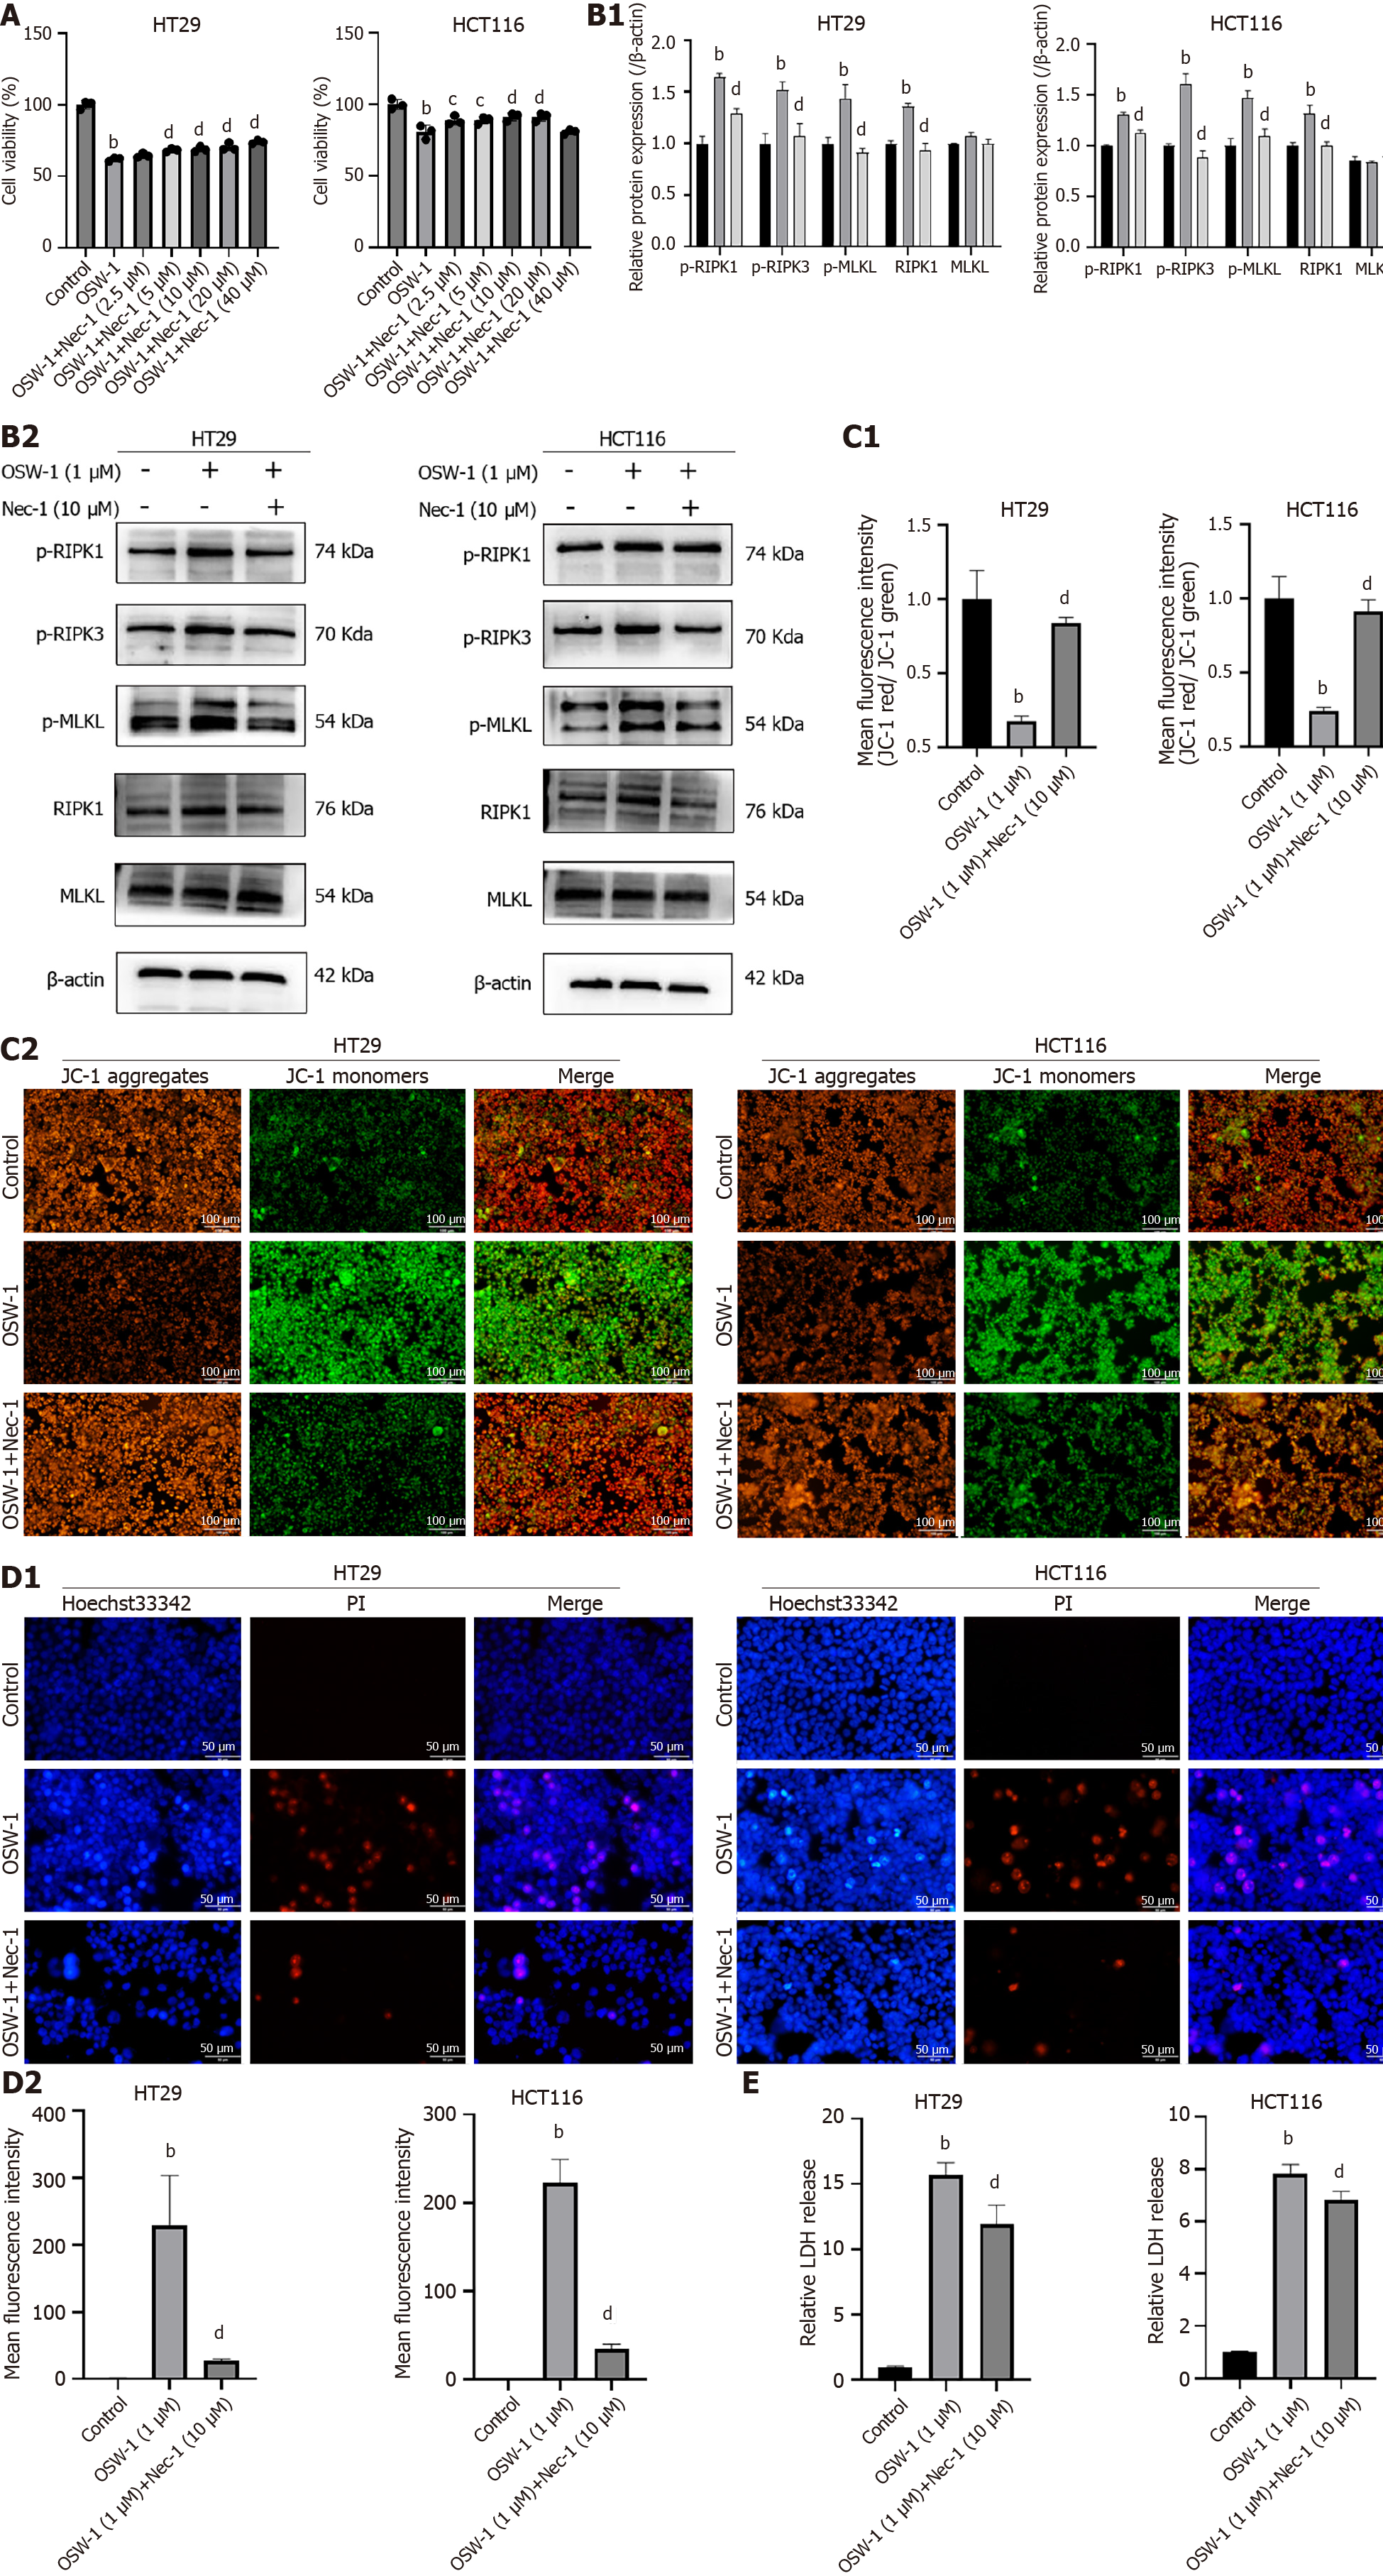
Figure 4 OSW-1 induced necroptosis in colorectal cancer cells through the RIPK1/RIPK3/MLKL pathway.
A: Cell Counting Kit-8 assay was used to assess the viability of HT29 and HCT116 cells treated with OSW-1 and different concentrations of necrostatin-1 (Nec-1) for 24 h; B: The expression levels of necroptosis-related proteins in HT29 and HCT116 cells after exposure to OSW-1 for 24 h with the addition of Nec-1; C: Assessment of mitochondrial function via JC-1 staining of HT29 and HCT116 cells after exposure to OSW-1 for 24 h with the addition of Nec-1; D: A Hoechst 33342/PI dual staining assay was used to examine cell necroptosis after 24 h of treatment with OSW-1 and Nec-1. Scale bar = 50 μm; E: Lactate dehydrogenase release was used to assess the cell death rate of HT29 and HCT116 cells exposed to OSW-1 and Nec-1 for 24 h. bP < 0.01 vs Control, cP < 0.05 and dP < 0.01 vs OSW-1. Each data point represents the mean ± SE. PI: Propidium iodide; Nec-1: necrostatin-1.
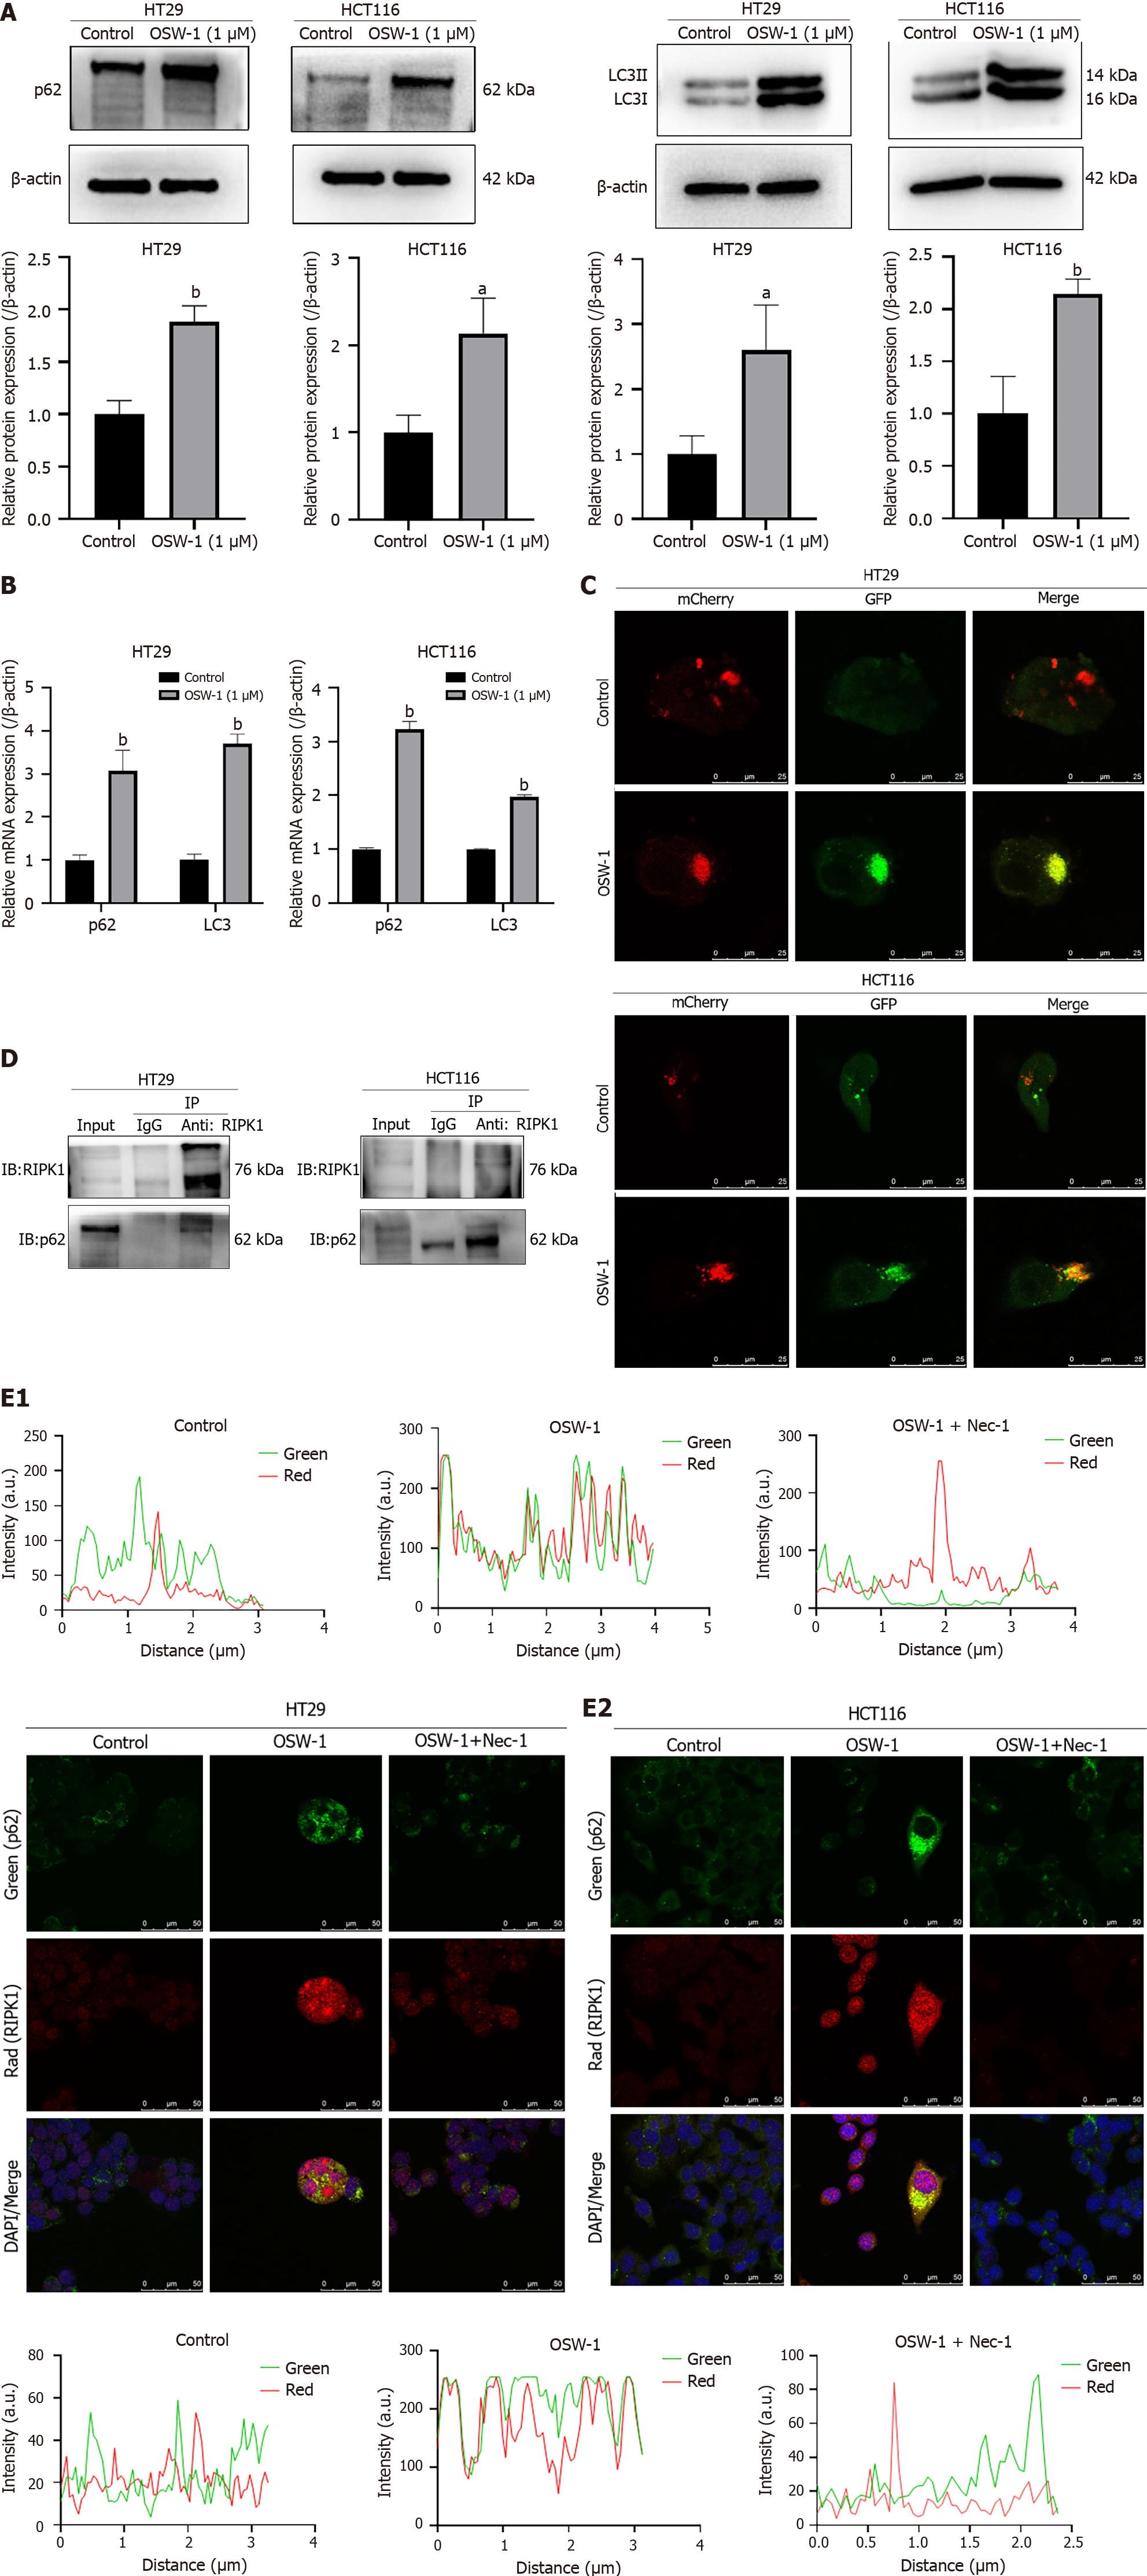
Figure 5 Impairment of the autophagic flux results in the accumulation of p62/SQSTM1, and p62/SQSTM1 can interact with RIPK1.
A: The expression levels of p62/SQSTM1 and LC3II were evaluated in HT29 and HCT116 cells after exposure to OSW-1 for 24 h; B: The gene expression levels of p62/SQSTM1 and LC3 were assessed in HT29 and HCT116 cells after 24 h of exposure to OSW-1; C: Representative images of HT29 cells and HCT116 cells infected with adenovirus expressing GFP-mCherry-LC3. Cells not treated with OSW-1 served as the control. The images show total autophagosomes (yellow puncta) and functional autophagolysosomes (red puncta); D: Coimmunoprecipitation was conducted to assess the interaction between RIPK1 and p62/SQSTM1, and the results were analyzed through western blotting; E: Representative confocal microscopy images showing the colocalization of p62/SQSTM1 and RIPK1 in HT29 and HCT116 cells after exposure to OSW-1 for 24 h, with or without the addition of necrostatin-1. aP < 0.05 and bP < 0.01 vs Control. Each data point represents the mean ± SE. PI: Propidium iodide; Nec-1: Necrostatin-1.
Figure 6 p62/SQSTM1 regulated OSW-1-induced necroptosis in colorectal cancer cells.
A: The mRNA expression levels of p62/SQSTM1 and RIPK1 in HT29 and HCT116 cells were assessed after exposure to OSW-1 and p62/SQSTM1 siRNA; B: The protein expression levels of necroptosis-related proteins in HT29 and HCT116 cells were evaluated after treatment with OSW-1, with or without the addition of p62/SQSTM1 siRNA; C: A Hoechst 33342/propidium iodide dual staining assay was used to assess necroptosis in HT29 and HCT116 cells following exposure to OSW-1, with or without the addition of p62/SQSTM1 siRNA. bP < 0.01 vs Control, cP < 0.05 and dP < 0.01 vs OSW-1, fP < 0.01 vs sip62. Each data point represents the mean ± SE. PI: Propidium iodide.
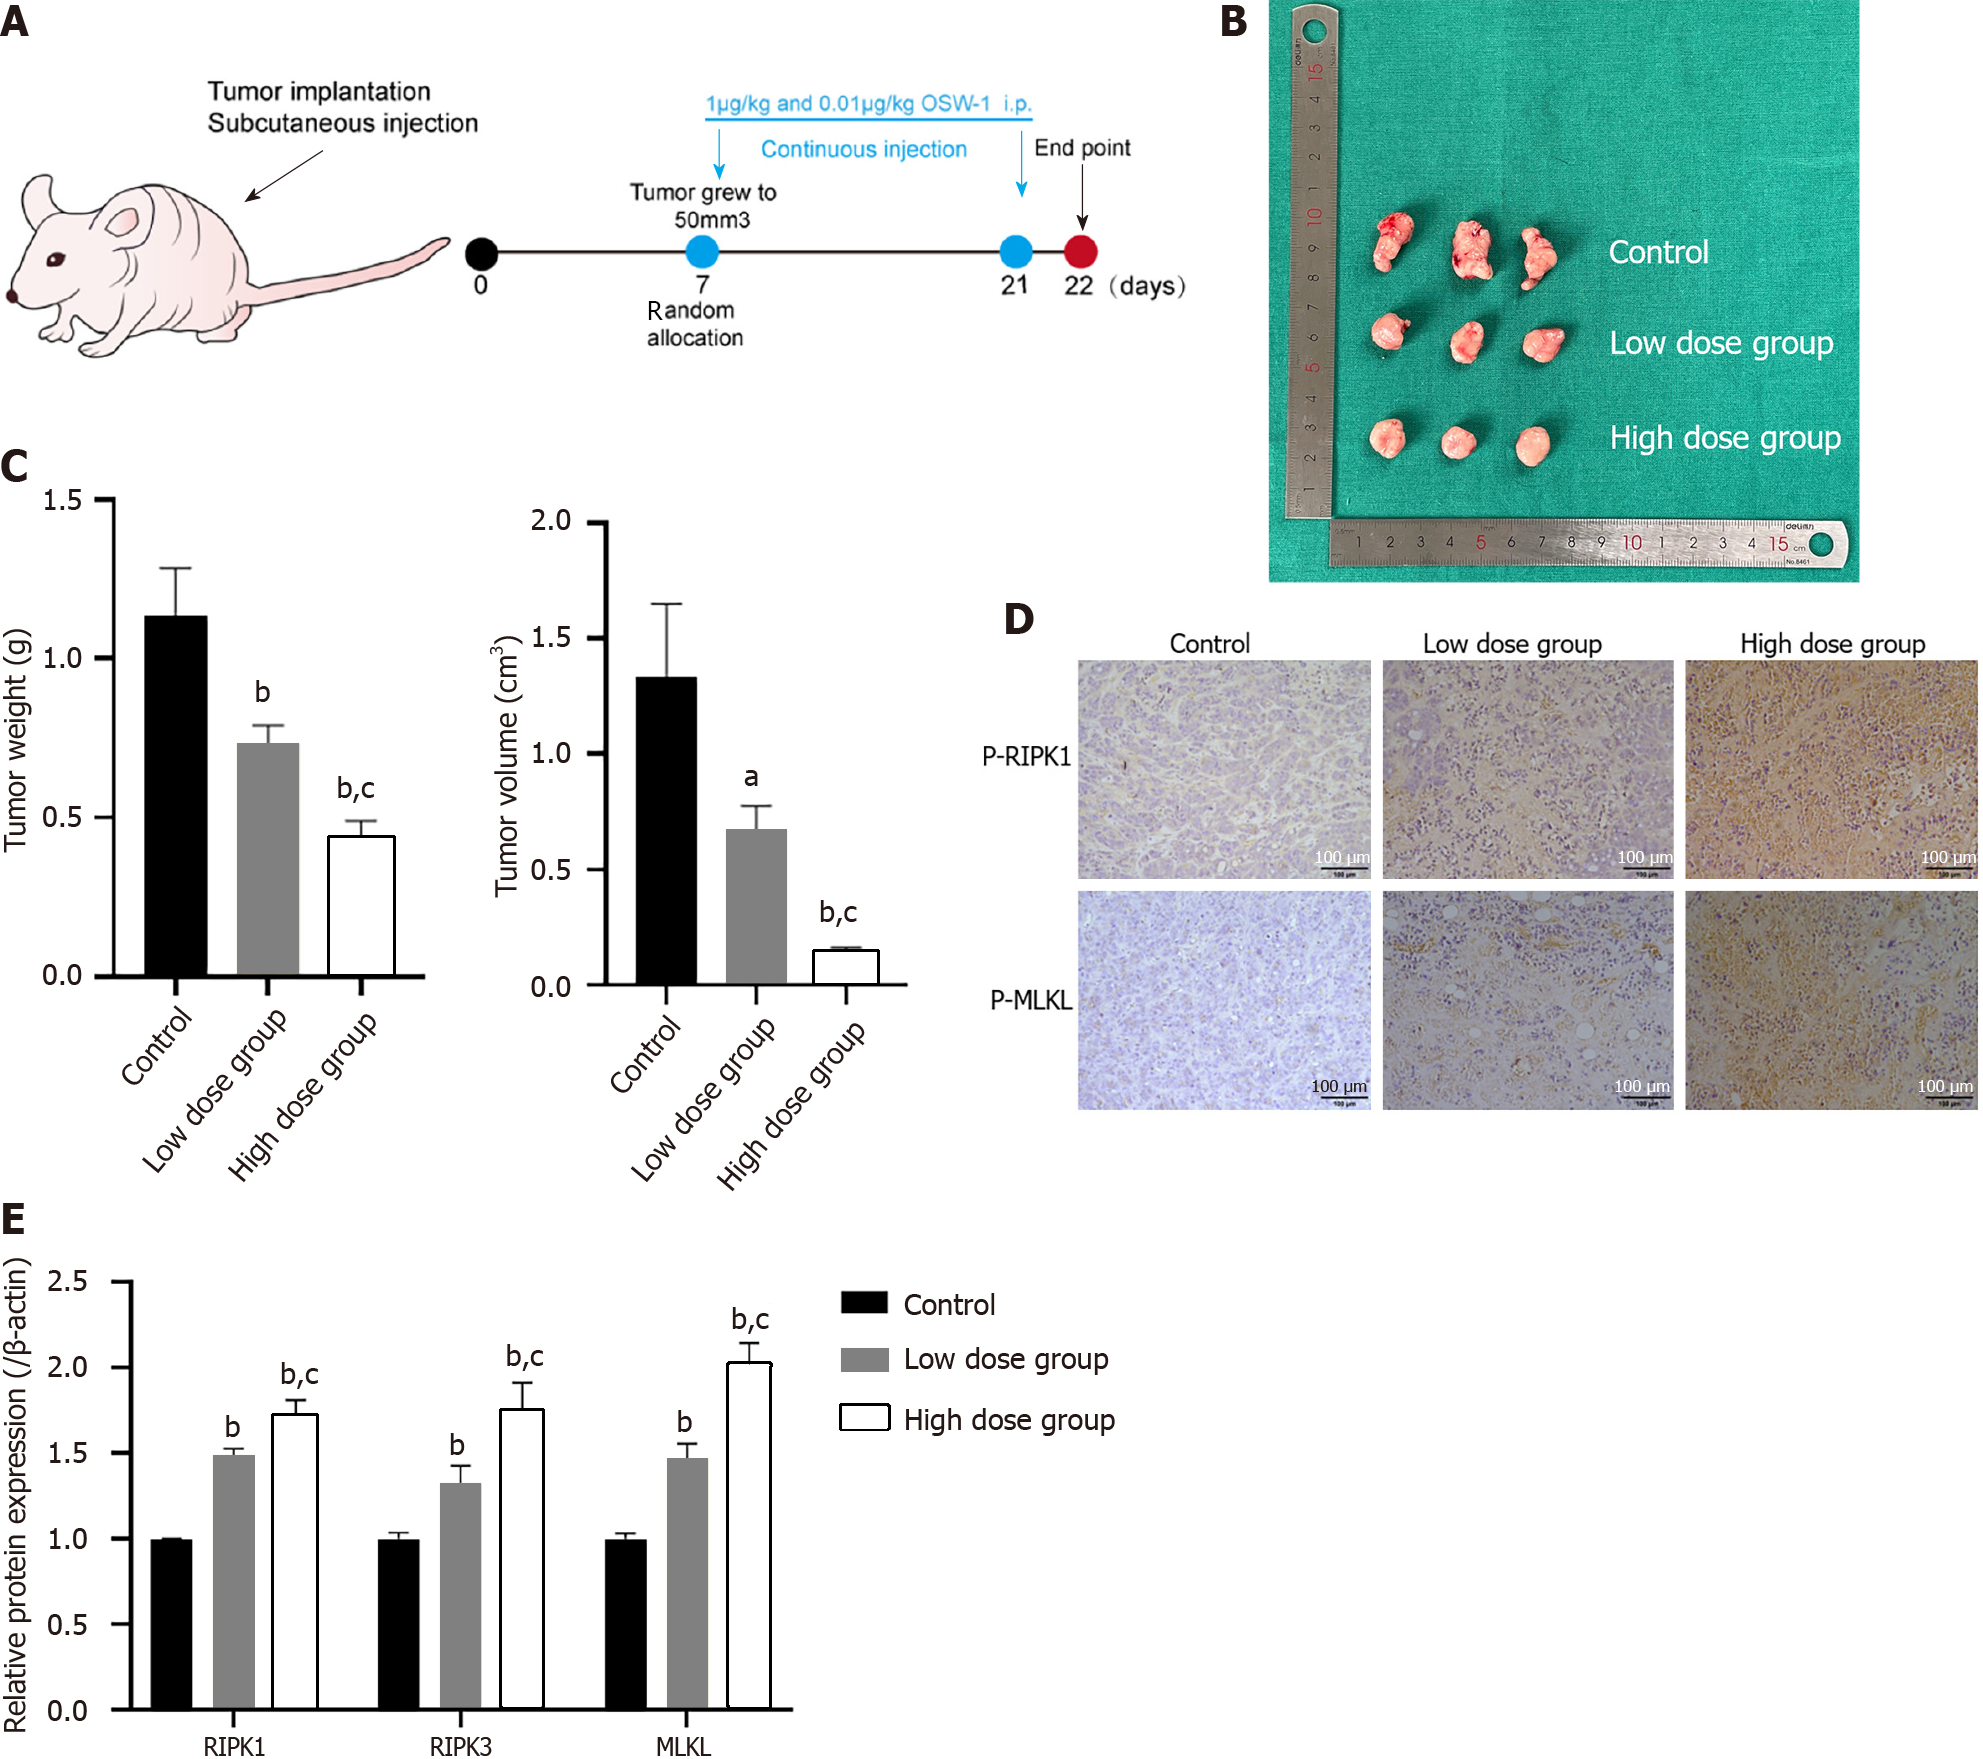
Figure 7 The inhibition of colorectal cancer cell proliferation is associated with necroptosis induced by OSW-1 in vivo.
A: Treatment schedule for mice intravenously injected with 5 × 10⁶ HT29 cells; B: Images of the harvested subcutaneous tumors. Tumor growth in the OSW-1 group was markedly suppressed compared to that in the control group; C: The tumor volume (mm3) and weight in the high-dose OSW-1 group were lower than those in the low-dose group; D: Immunohistochemistry staining of p-RIPK1 and p-MLKL in xenograft nude mice (magnification, 200 ×); E: In xenograft nude mouse models, the expression levels of RIPK1, RIPK3 and MLKL in the high-dose group were increased in comparison to the low-dose group. aP < 0.05 and bP < 0.01 vs Control, cP < 0.05 and dP < 0.01 vs Low dose group.
- Citation: Wang N, Li CY, Yao TF, Kang XD, Guo HS. OSW-1 triggers necroptosis in colorectal cancer cells through the RIPK1/RIPK3/MLKL signaling pathway facilitated by the RIPK1-p62/SQSTM1 complex. World J Gastroenterol 2024; 30(15): 2155-2174
- URL: https://www.wjgnet.com/1007-9327/full/v30/i15/2155.htm
- DOI: https://dx.doi.org/10.3748/wjg.v30.i15.2155


