Copyright
©The Author(s) 2023.
World J Gastroenterol. Dec 28, 2023; 29(48): 6208-6221
Published online Dec 28, 2023. doi: 10.3748/wjg.v29.i48.6208
Published online Dec 28, 2023. doi: 10.3748/wjg.v29.i48.6208
Figure 1 Selection process of the patients.
Figure 2 Comparisons of endoscopic scores among the mild (n = 44), moderate (n = 51), and severe (n = 71) patients.
A: Comparison of Toronto Inflammatory Bowel Disease Global Endoscopic Reporting score among different severities of ulcerative colitis (UC); B: Comparison of Ulcerative Colitis Endoscopic Index of Severity score among different severities of UC; C: Comparison of Mayo Endoscopic Subscore among different severities of UC. aP < 0.0001; bP < 0.001; NS: Not significance; TIGER: Toronto Inflammatory Bowel Disease Global Endoscopic Reporting; UCEIS: Ulcerative Colitis Endoscopic Index of Severity; MES: Mayo Endoscopic Subscore.
Figure 3 Comparison of the diagnostic value of endoscopic scores for patients with severe ulcerative colitis.
A: The diagnostic value of Toronto Inflammatory Bowel Disease Global Endoscopic Reporting score for severe patients; B: The diagnostic value of Ulcerative Colitis Endoscopic Index of Severity score for severe patients; C: The diagnostic value of Mayo Endoscopic Subscore for severe patients. AUC: Area under the curve.
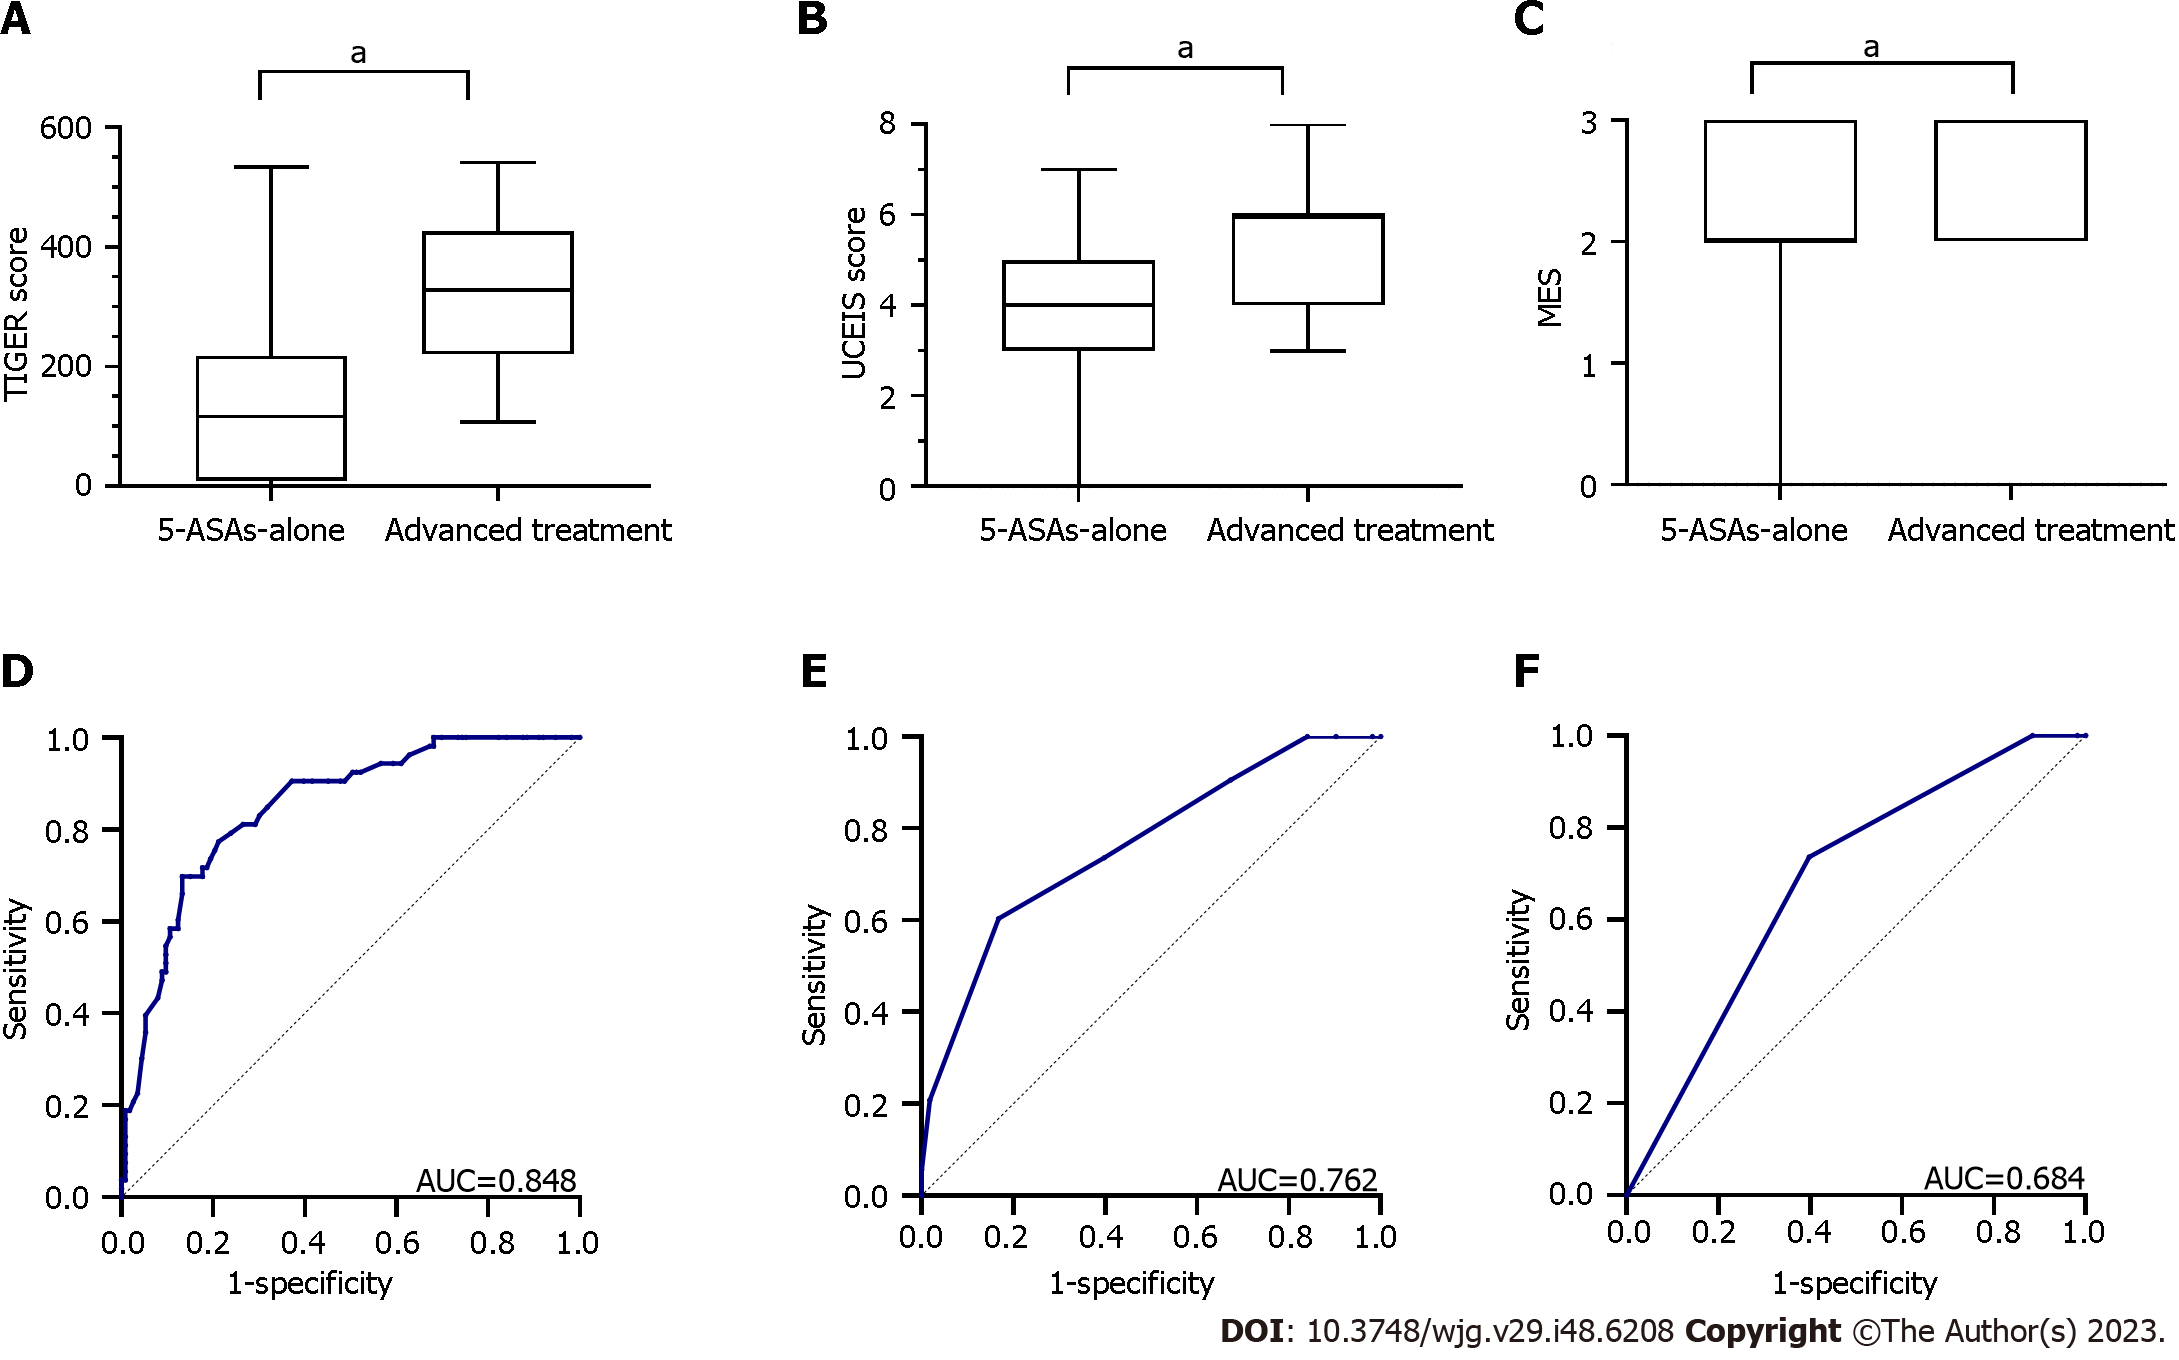
Figure 4 Comparisons of endoscopic scores between the 5-aminosalicylates-alone group (n = 113) and the advanced treatment group (n = 53).
A: Comparisons of Toronto Inflammatory Bowel Disease Global Endoscopic Reporting (TIGER) score between 2 groups; B: Comparisons of Ulcerative Colitis Endoscopic Index of Severity (UCEIS) score between 2 groups; C: Comparisons of Mayo Endoscopic Subscore (MES) between 2 groups; D: The predictive value of TIGER score for advanced treatment recently; E: The predictive value of UCEIS score for advanced treatment recently; F: The predictive value of MES for advanced treatment recently. aP < 0.0001. AUC: Area under the curve.
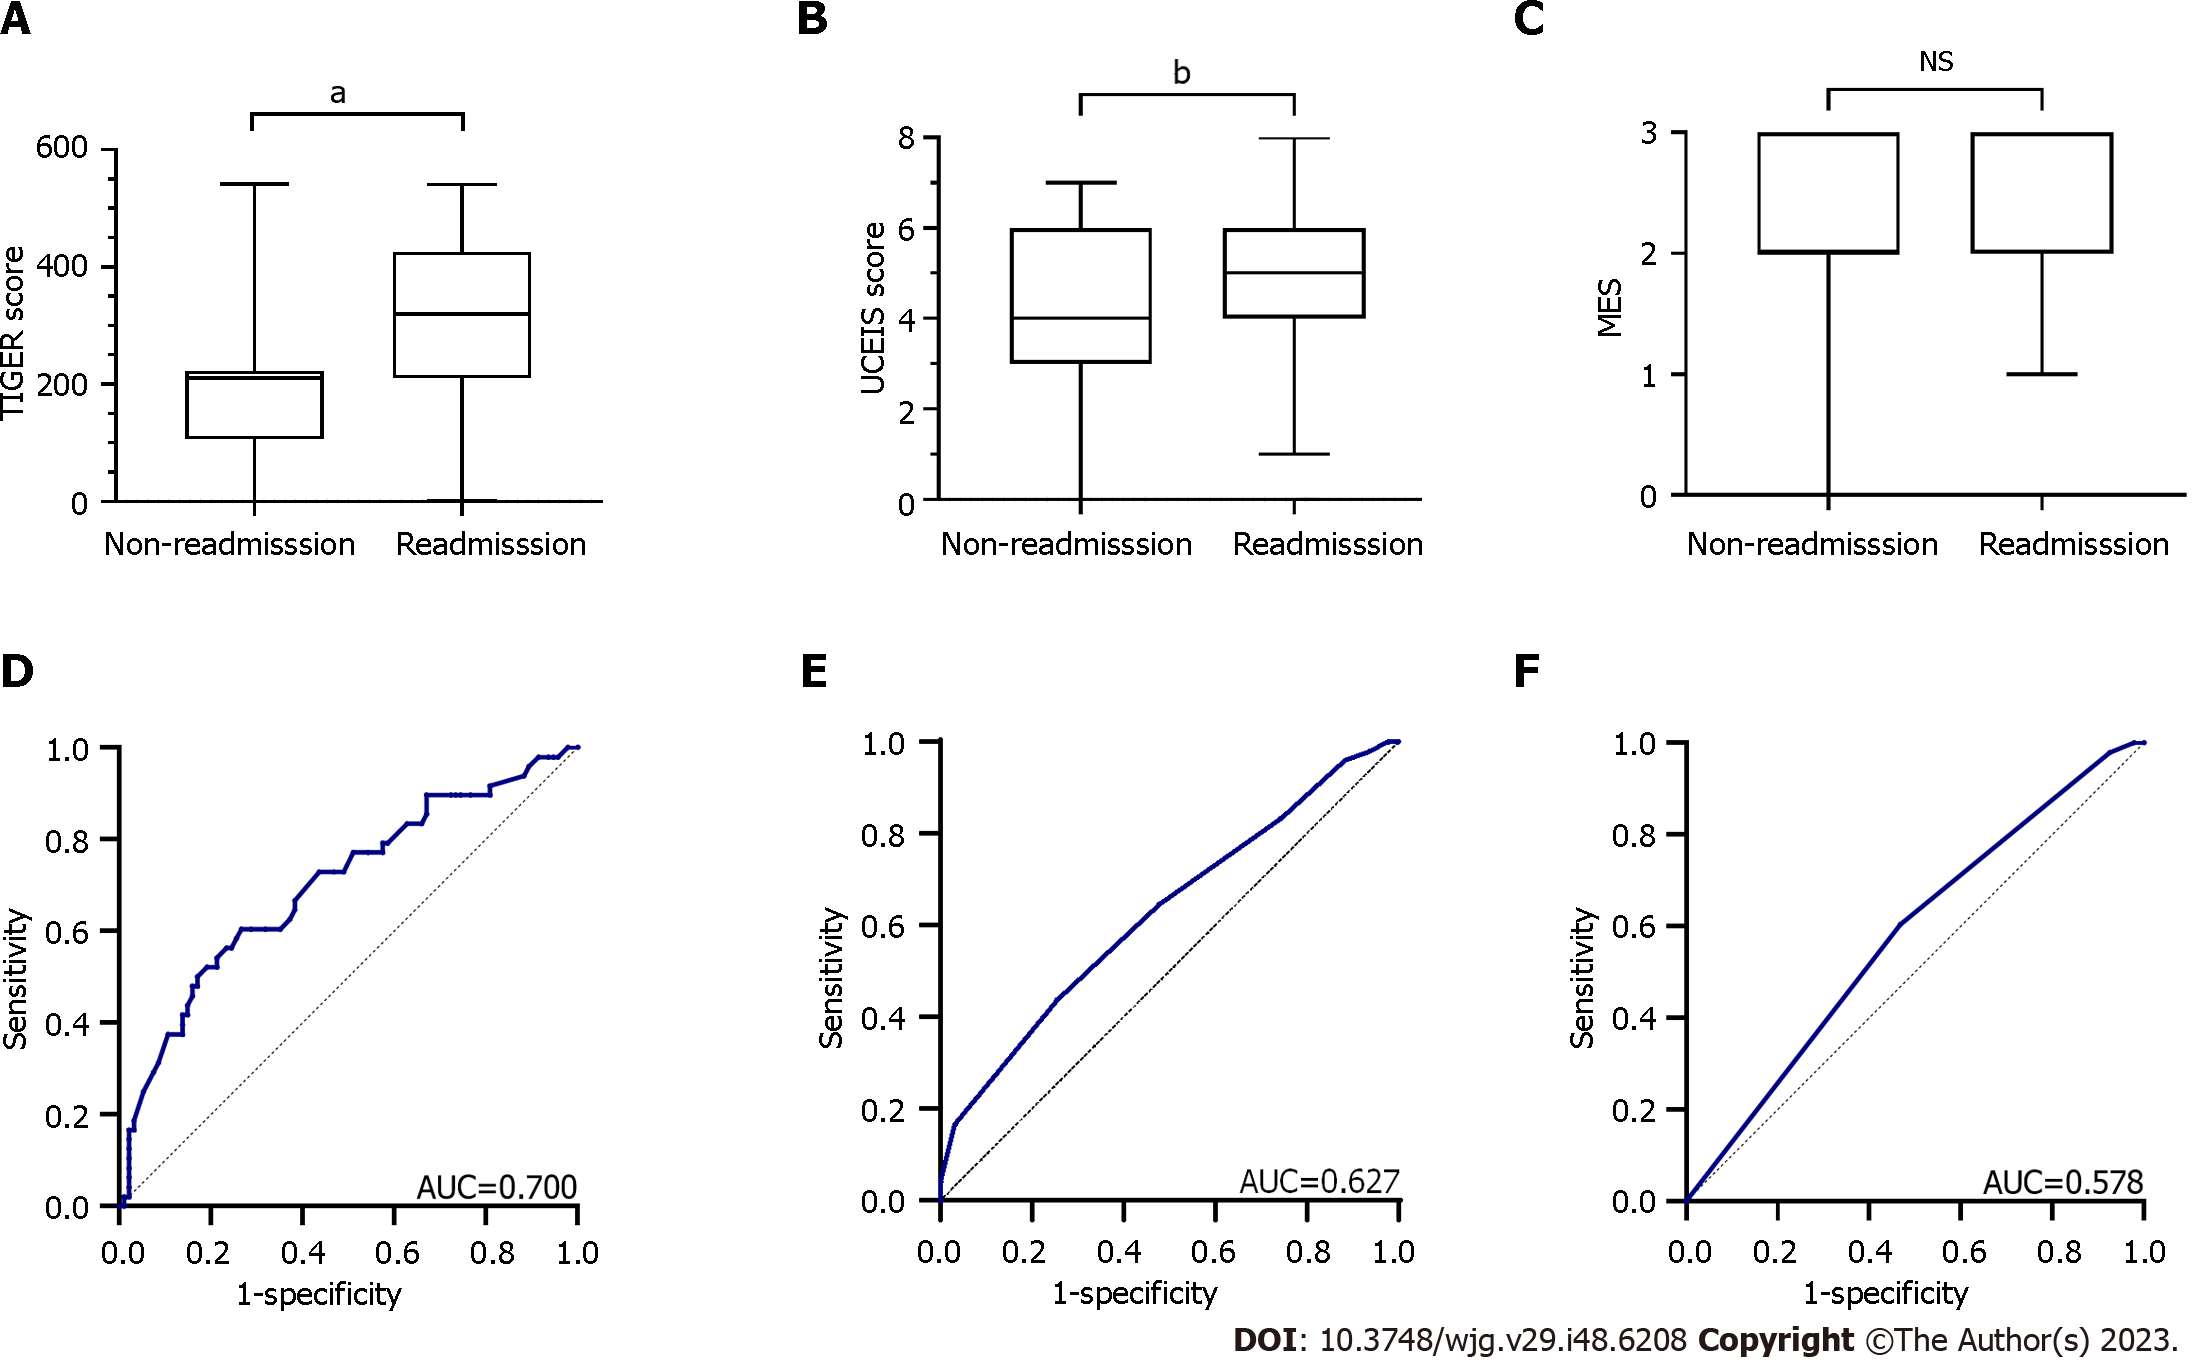
Figure 5 Comparisons of the endoscopic scores between the non-readmission group (n = 94) and the readmission group (n = 48).
A: Comparisons of Toronto Inflammatory Bowel Disease Global Endoscopic Reporting (TIGER) score between 2 groups; B: Comparisons of Ulcerative Colitis Endoscopic Index of Severity (UCEIS) score between 2 groups; C: Comparisons of Mayo Endoscopic Subscore (MES) between 2 groups; D: The predictive value of TIGER score for 1-year readmission; E: The predictive value of UCEIS score for 1-year readmission; F: The predictive value of MES for 1-year readmission. aP < 0.001; bP < 0.05; ns: No significance; AUC: Area under the curve.
- Citation: Liu XY, Tian ZB, Zhang LJ, Liu AL, Zhang XF, Wu J, Ding XL. Clinical value of the Toronto inflammatory bowel disease global endoscopic reporting score in ulcerative colitis. World J Gastroenterol 2023; 29(48): 6208-6221
- URL: https://www.wjgnet.com/1007-9327/full/v29/i48/6208.htm
- DOI: https://dx.doi.org/10.3748/wjg.v29.i48.6208


