Copyright
©The Author(s) 2023.
World J Gastroenterol. Jul 28, 2023; 29(28): 4433-4450
Published online Jul 28, 2023. doi: 10.3748/wjg.v29.i28.4433
Published online Jul 28, 2023. doi: 10.3748/wjg.v29.i28.4433
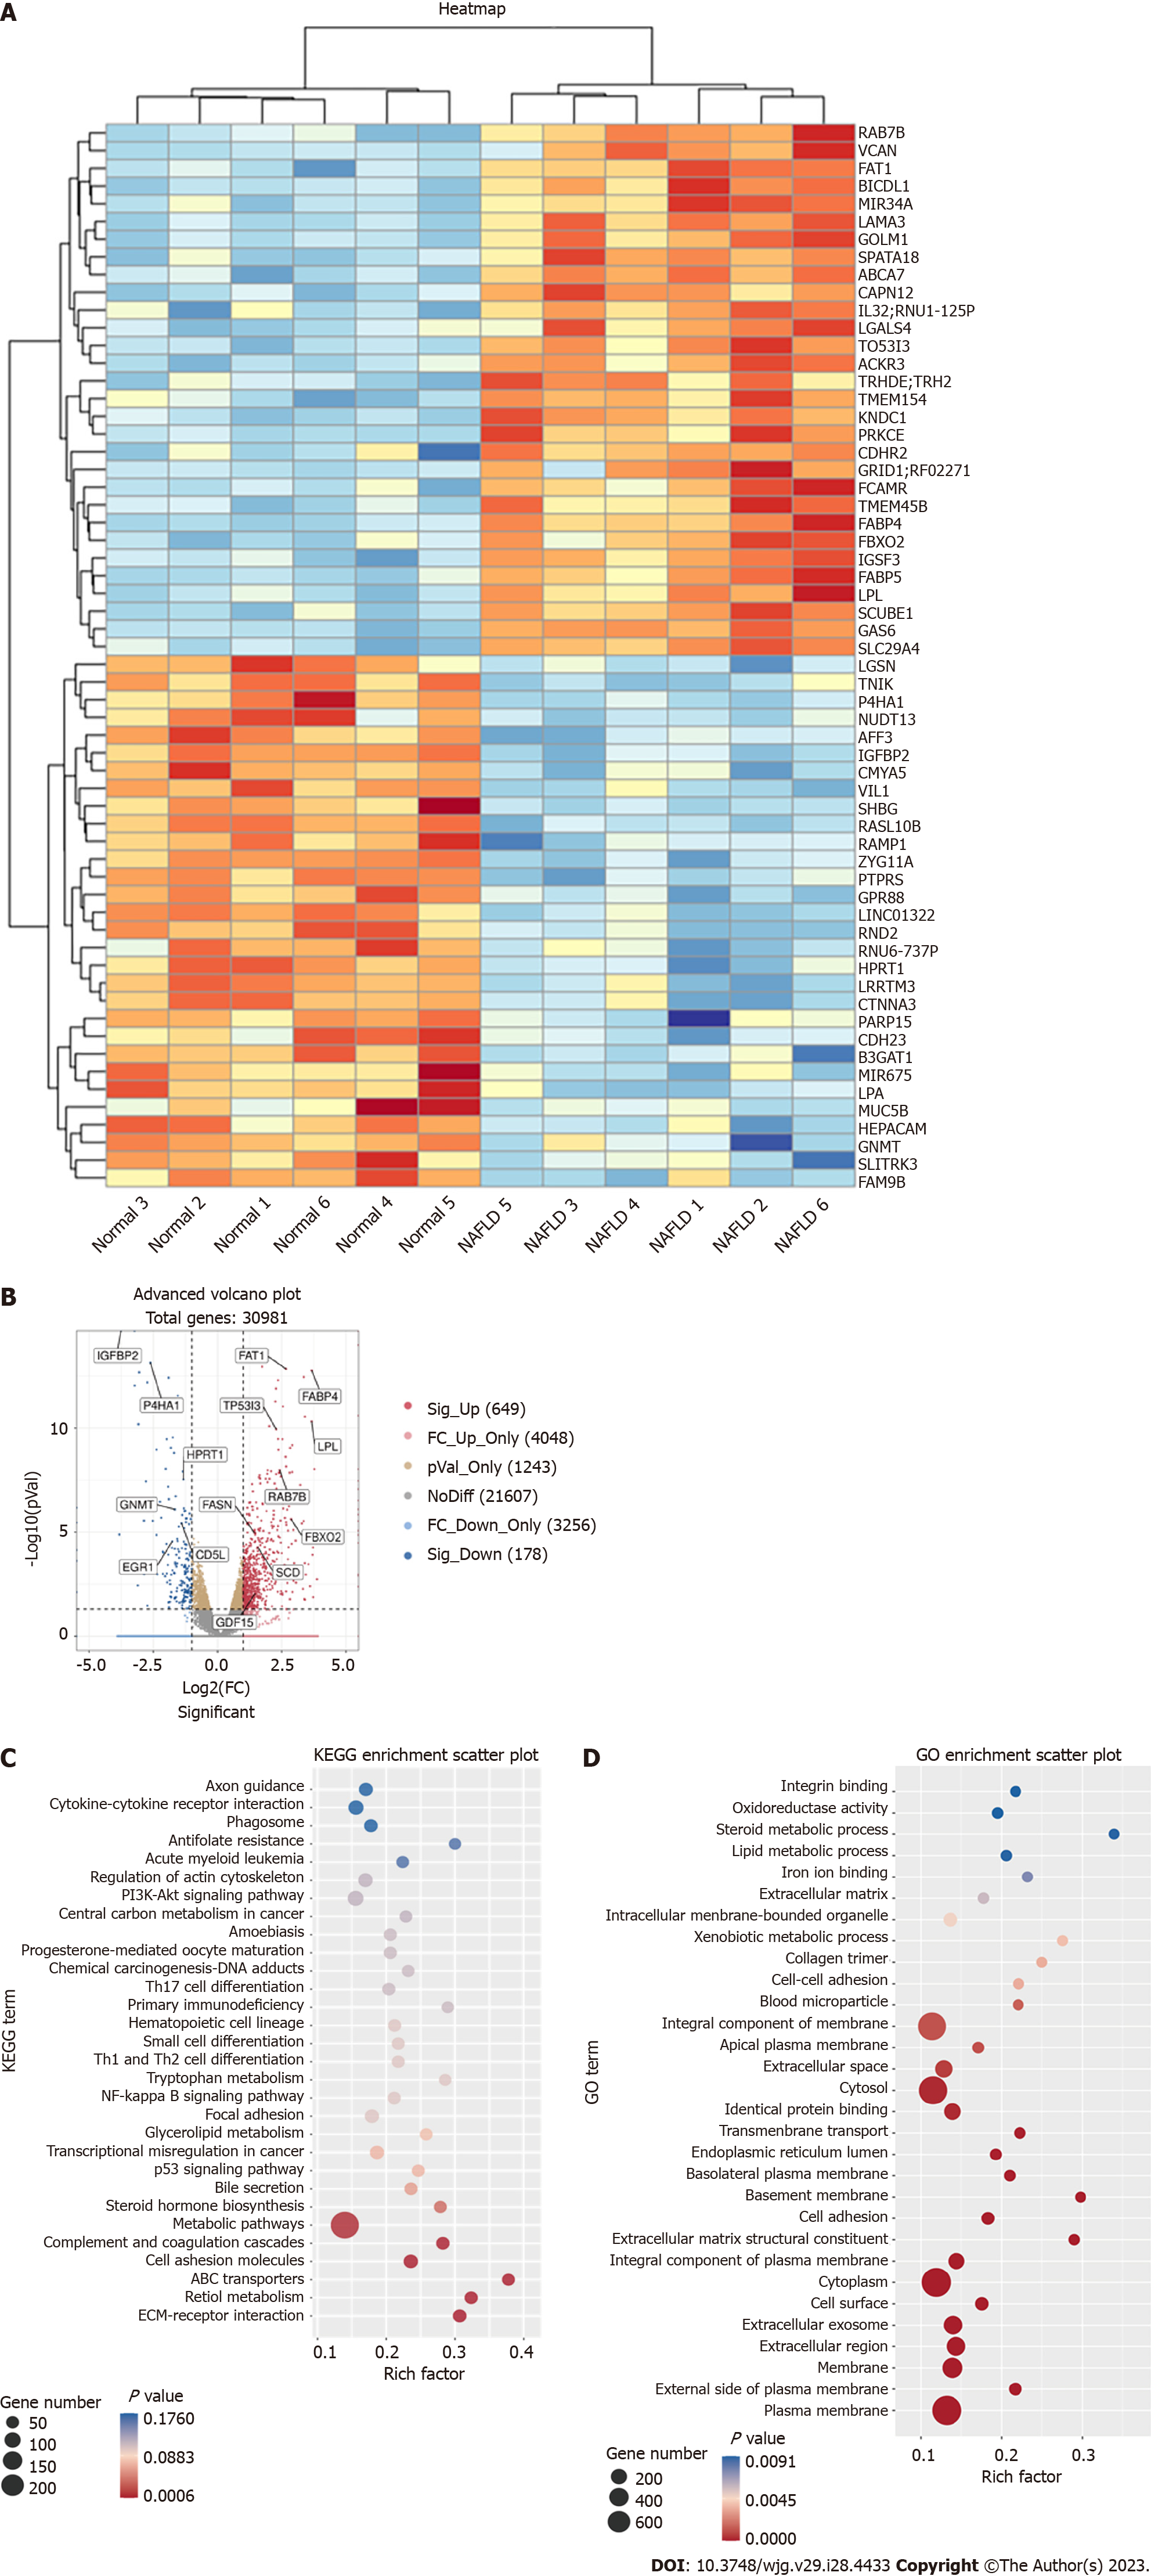
Figure 1 Whole genome sequencing analysis of liver tissue from patients with non-alcoholic fatty liver disease and healthy controls.
A and B: Heat map (A) and volcano plot (B) of the mRNA sequencing results; C: Scatter plot of the Kyoto Encyclopedia of Genes and Genomes enrichment analysis results; D: Scatter plot of the Gene Ontology enrich analysis results. FBXO2: F-box only protein 2; NAFLD: Non-alcoholic fatty liver disease; FC: Fold change; KEGG: Kyoto Encyclopedia of Genes and Genomes; GO: Gene Ontology.
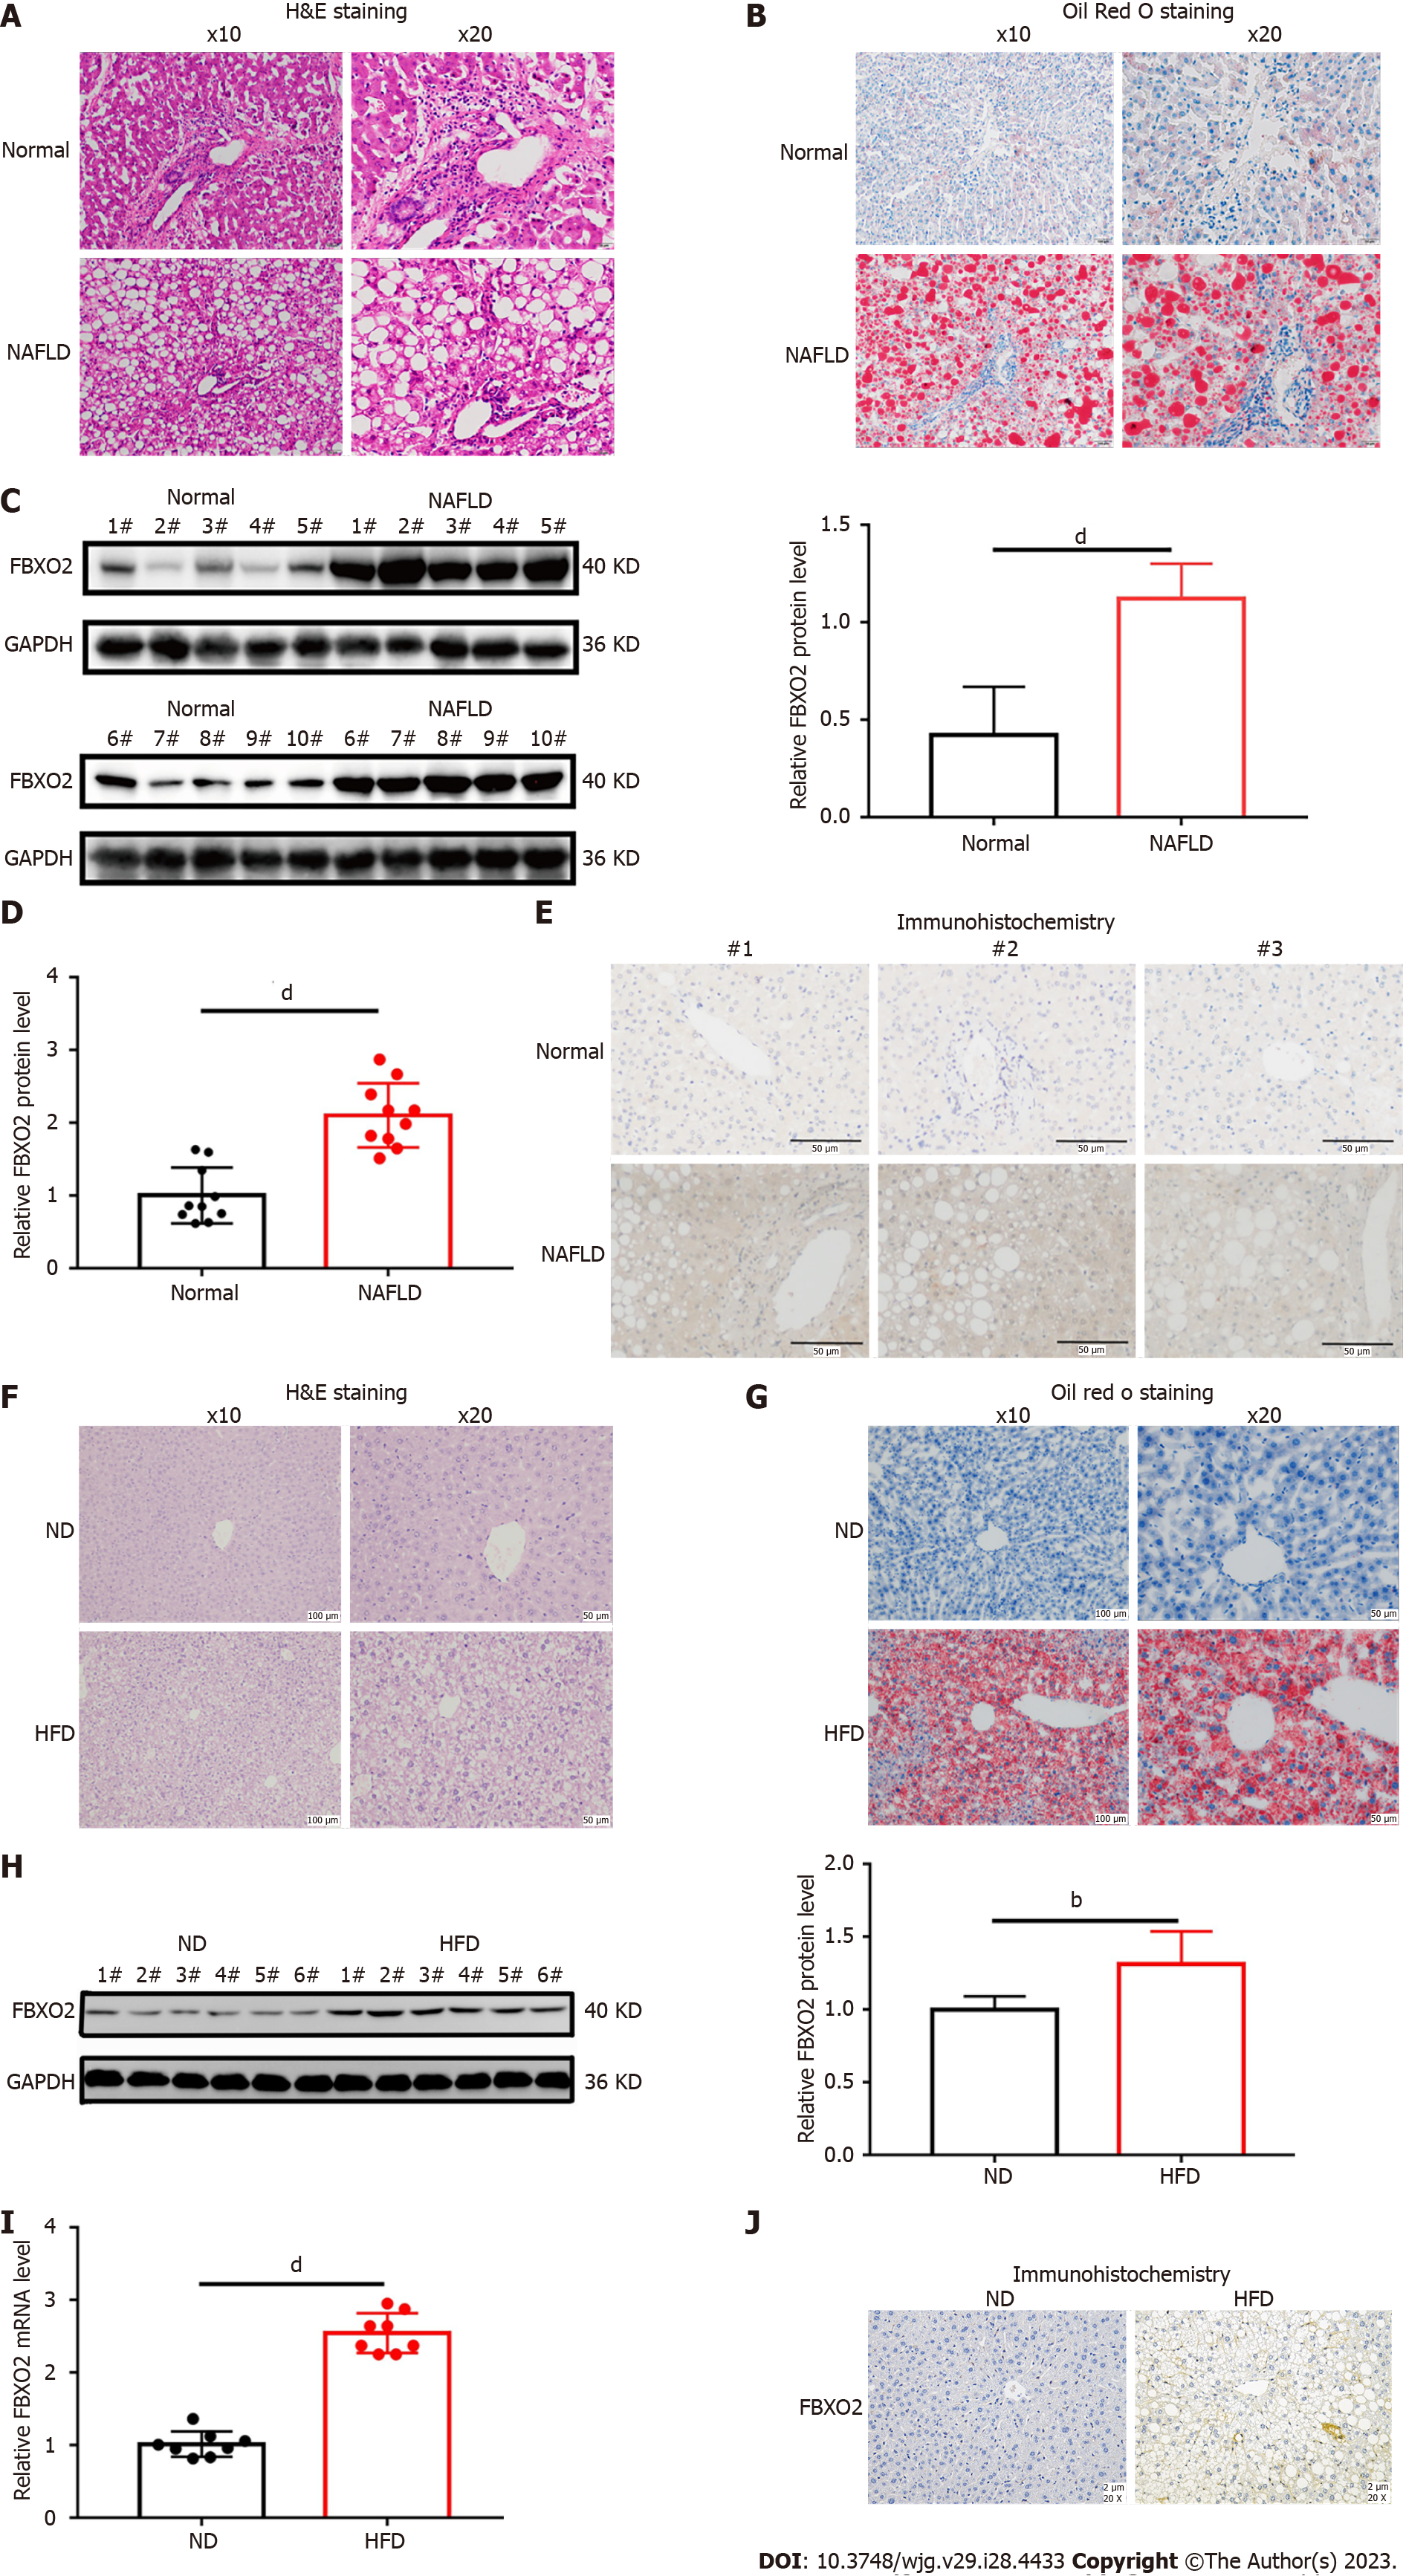
Figure 2 F-box only protein 2 expression was up-regulated in livers of non-alcoholic fatty liver disease patients and high-fat diet mice models.
A and B: Representative images of hematoxylin and eosin (H&E) and Oil Red O staining of liver tissues obtained from healthy controls and patients with non-alcoholic fatty liver disease (NAFLD). Scale bars, 50 μm and 100 μm; C: Western blot of F-box only protein 2 (FBXO2) expression in the liver tissues of healthy controls and patients with NAFLD (n = 10 liver samples per group); D: Expression of FBXO2 in liver tissue obtained from healthy controls and patients with NAFLD (n = 10 liver samples per group); E: Representative images of immunohistochemical staining of FBXO2 in liver tissue obtained from healthy controls and patients with NAFLD. Scale bars, 50 μm; F and G: Representative images of H&E and Oil Red O staining of liver tissue isolated from C57BL/6J mice treated with a normal chow diet (ND) or high-fat diet (HFD) for 16 wk. Scale bars, 50 μm and 100 μm; H: Representative images of FBXO2 western blots from liver tissue of C57BL/6J mice treated with an ND or HFD for 16 wk; I: Expression of FBXO2 in liver tissue obtained from C57BL/6J mice treated with an ND or HFD for 16 wk as detected using quantitative reverse transcription polymerase chain reaction (n = 8 liver samples per group); J: Representative images of immunohistochemical staining of FBXO2 in liver tissue obtained from C57BL/6J mice treated with an ND or HFD for 16 wk. Scale bars, 50 μm. bP < 0.01, dP < 0.0001. FBXO2: F-box only protein 2; NAFLD: Non-alcoholic fatty liver disease; HFD: High-fat diet; H&E: Hematoxylin and eosin; ND: Normal chow diet.
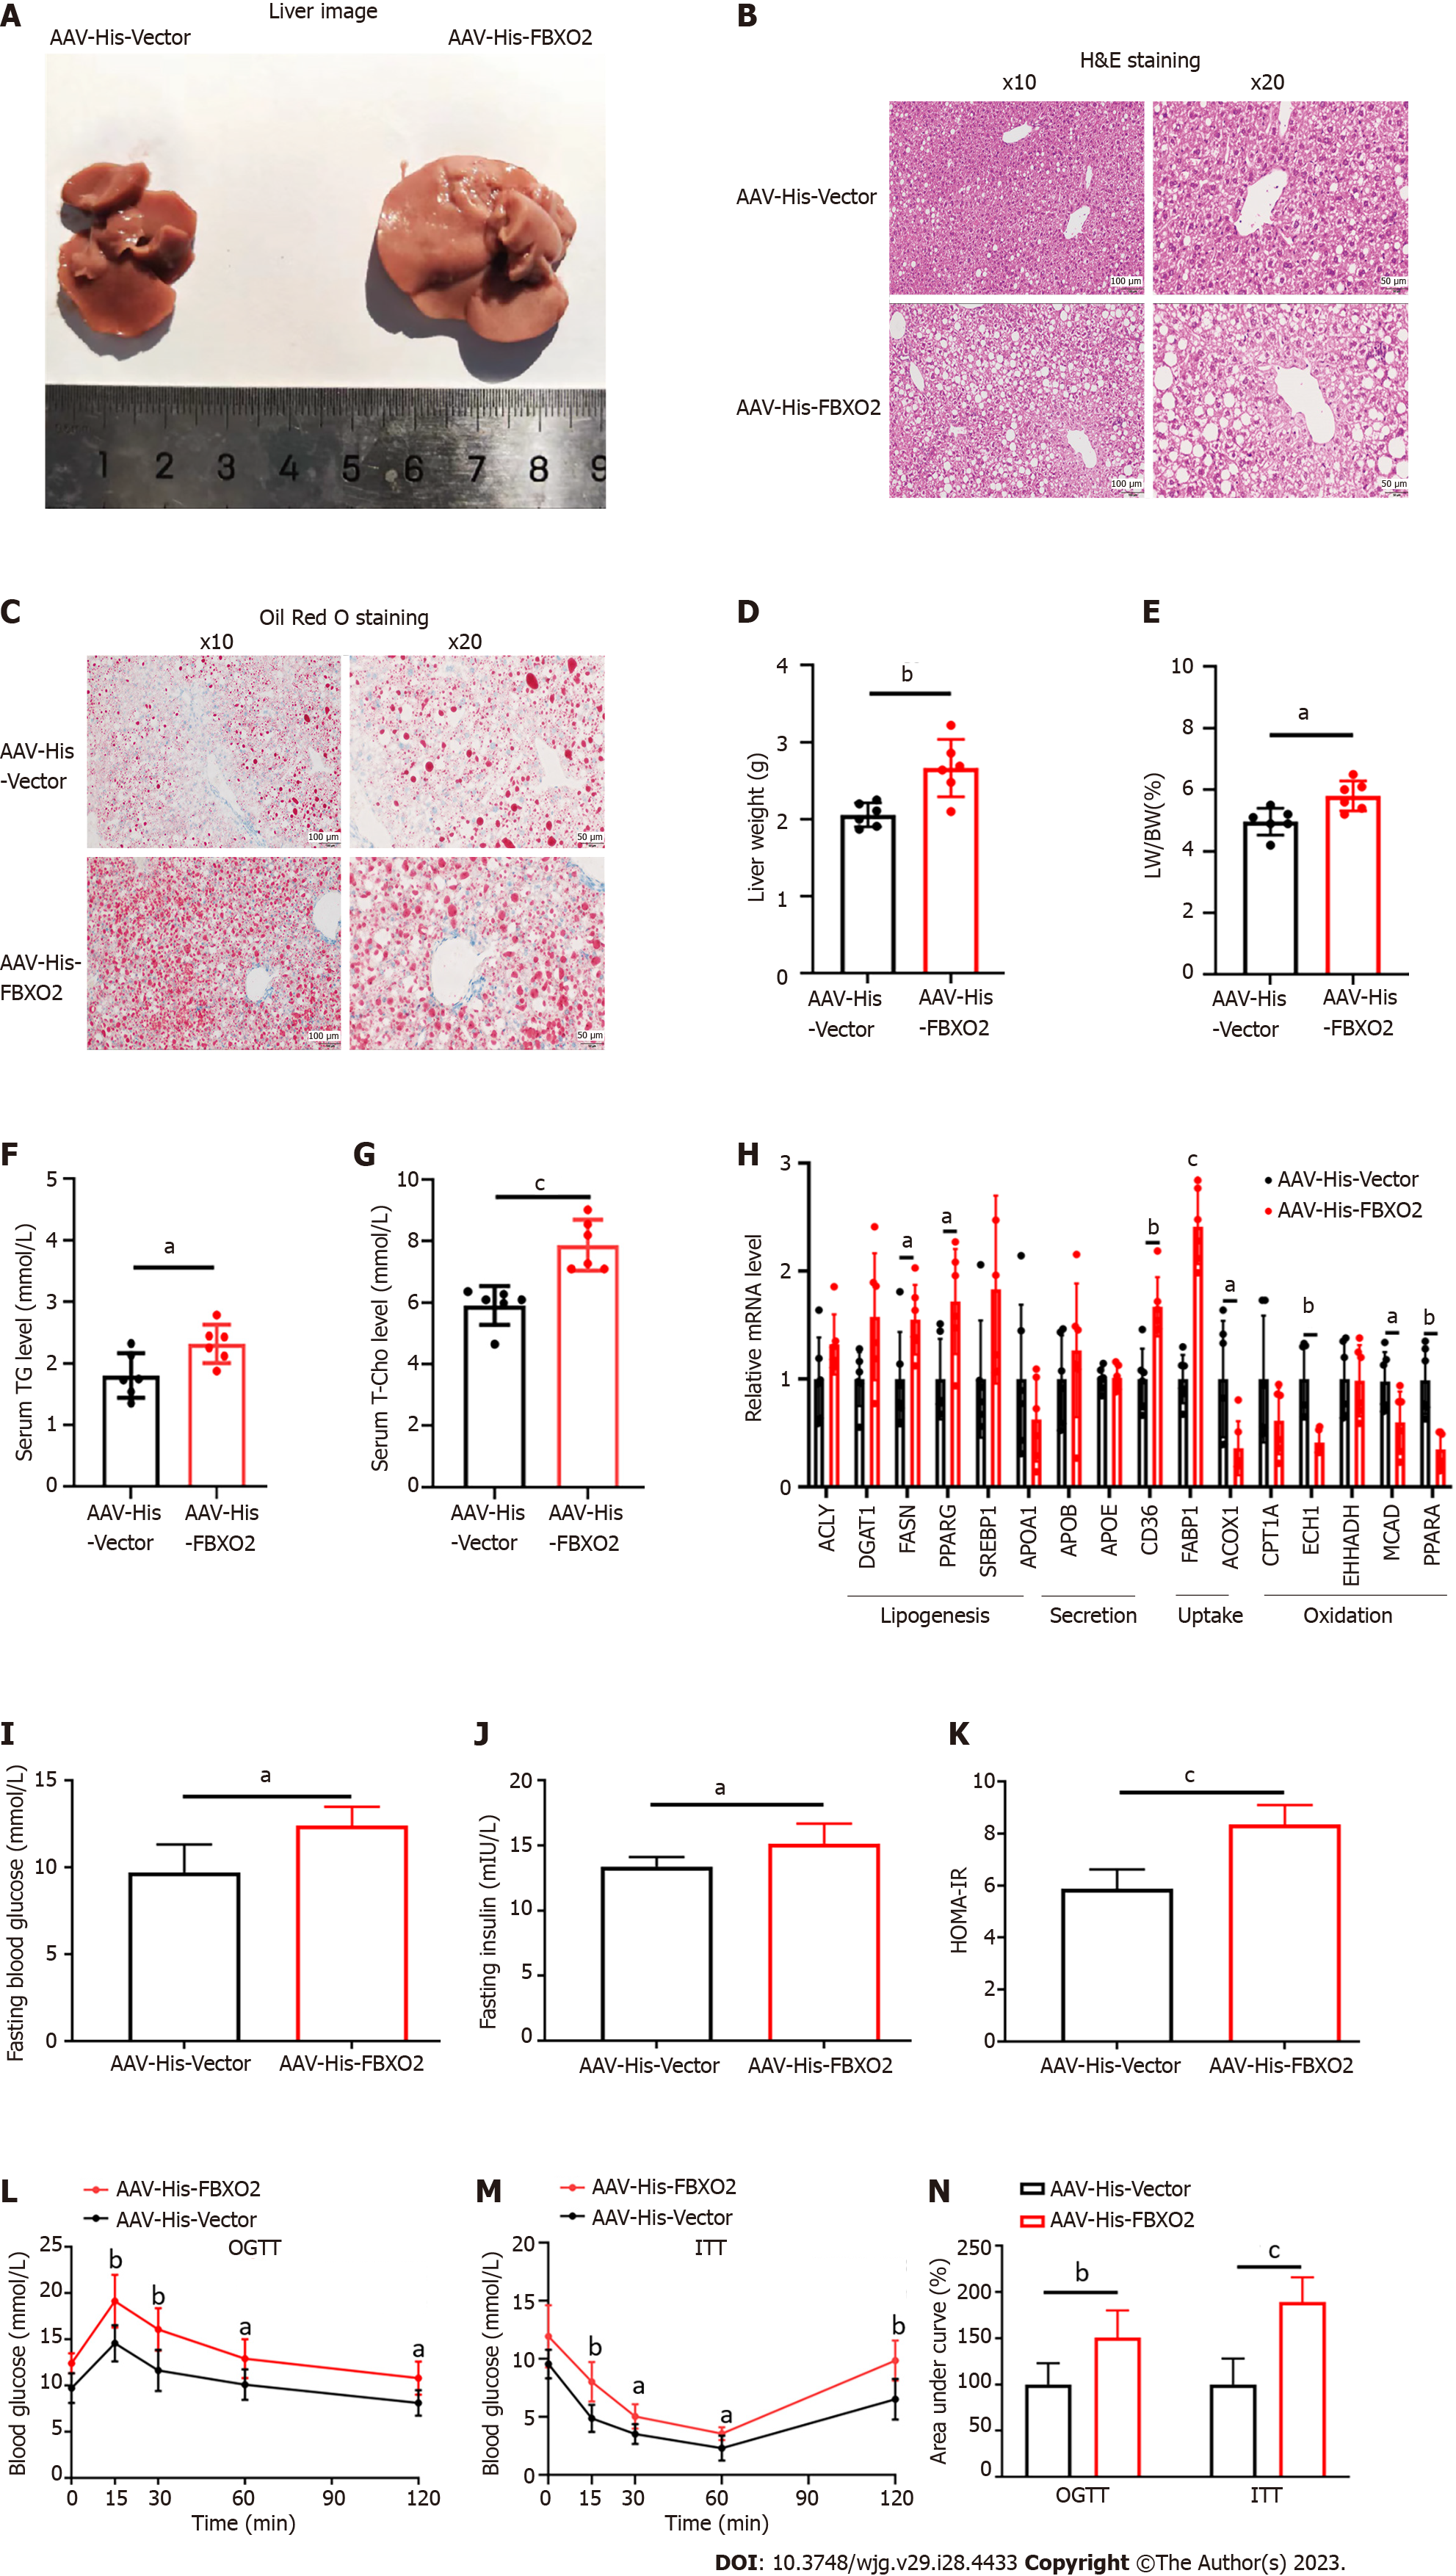
Figure 3 Overexpression of F-box only protein 2 exacerbated high-fat diet-induced liver steatosis, insulin-resistance, and abnormal glucose metabolism.
A: Representative images indicating histological changes in the livers of adeno-associated virus (AAV)-His-vector and AAV-His-F-box only protein 2 (FBXO2) mice after 16 wk of administering an high-fat diet (HFD); B and C: Representative images of hematoxylin and eosin and Oil Red O staining of liver tissue obtained from AAV-His-vector and AAV-His-FBXO2 mice after 16 wk of HFD. Scale bars, 50 μm and 100 μm; D-G: The liver weight, ratio of liver weight/body weight, serum triglyceride and total cholesterol levels in AAV-His-vector and AAV-His-FBXO2 mice after 16 wk of administering an HFD (n = 6 per group); H: quantitative reverse transcription polymerase chain reaction analysis of the expression of genes associated with lipogenesis, fatty acid secretion and uptake, and oxidation in AAV-His-vector and AAV-His-FBXO2 mice after 16 wk of administering an HFD (n = 6 per group); I: Fasting blood glucose levels; J: Fasting serum insulin levels; K: The homeostatic model assessment of insulin resistance; L: Oral glucose tolerance test (OGTT) scores; M: Insulin tolerance test (ITT); N: Calculated area under curve of OGTT and ITT in the AAV-His-vector mice and AAV-His-FBXO2 mice after 16 wk of HFD (n = 6 per group). aP < 0.05, bP < 0.01, cP < 0.001. AAV: Adeno-associated virus; FBXO2: F-box only protein 2; H&E: Hematoxylin and eosin; ITT: Insulin tolerance test; OGTT: Oral glucose tolerance test; LW: Liver weight; BW: Body weight; TG: Triglyceride; T-Cho: Total cholesterol; HOMA-IR: Homeostatic model assessment of insulin resistance; FASN: Fatty acid synthase; PPAR: Peroxisome proliferator-activated receptor; CD36: Cluster of differentiation 36; ACOX1: Acyl-CoA oxidase 1; ECH1: Enoyl coenzyme A hydratase 1; MCAD: Medium-chain acyl-coenzyme A dehydrogenase.
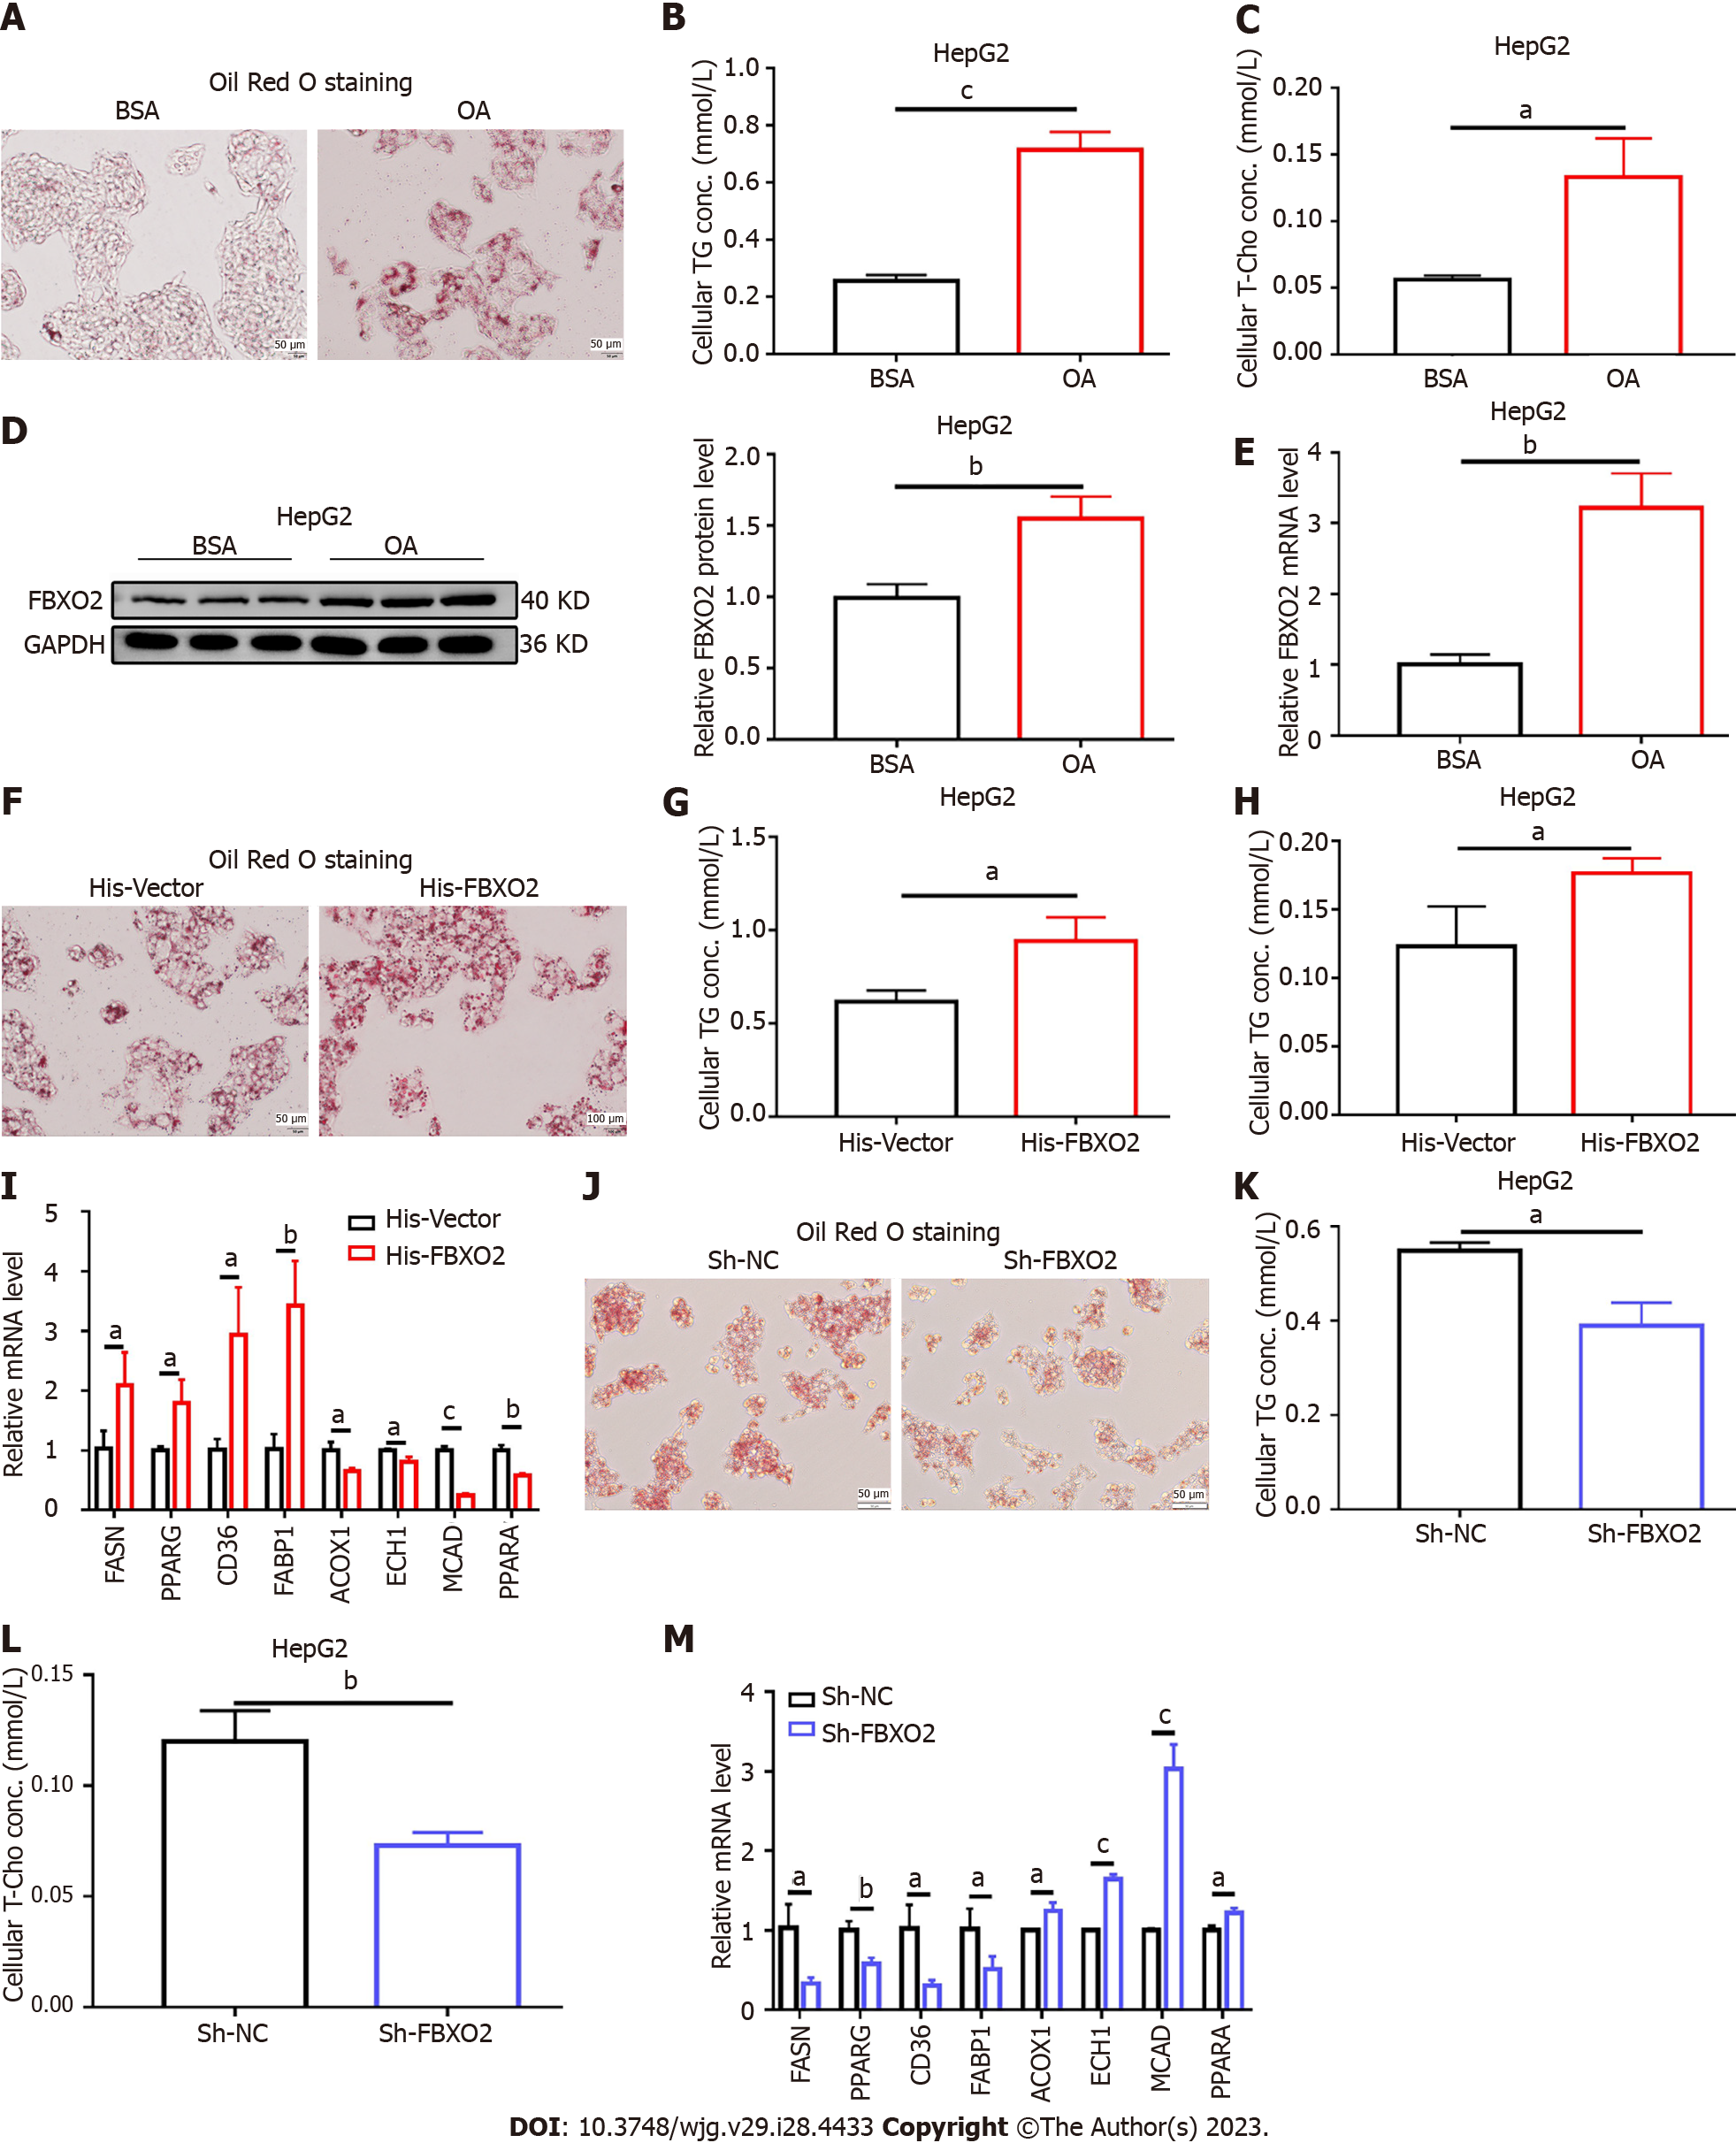
Figure 4 Effect of F-box only protein 2 overexpression or knockdown on lipid accumulation in hepatocytes.
A: Representative images of Oil Red O staining of HepG2 cells treated with oleate (OA) for 24 h. Scale bar, 50 μm; B and C: Triglyceride (TG) and total cholesterol (T-Cho) levels in HepG2 cells treated with OA for 24 h; D and E: Western blot and quantitative reverse transcription polymerase chain reaction (qRT-PCR) analysis of F-box only protein 2 (FBXO2) expression in HepG2 cells treated with OA for 24 h; F-I: HepG2 cells transfected with His-FBXO2 plasmids to overexpress FBXO2, followed by OA treatment for 24 h; representative images of Oil Red O staining (F), TG (G) and T-Cho (H) levels; expression analysis of genes associated with lipogenesis, fatty acid uptake, and oxidation as detected using qRT-PCR (I); J-M: HepG2 cells were transfected with Sh-FBXO2 plasmids to knockdown FBXO2 expression, followed by OA treatment for 24 h; representative images of Oil Red O staining (J), TG (K) and T-Cho (L) levels; expression analysis of genes associated with lipogenesis, fatty acid uptake, and oxidation as detected using qRT-PCR (M). aP < 0.05, bP < 0.01, cP < 0.001. FBXO2: F-box only protein 2; BSA: Bovine serum albumin; OA: Oleate; TG: Triglyceride; T-Cho: Total cholesterol; FASN: Fatty acid synthase; PPAR: Peroxisome proliferator-activated receptor; CD36: Cluster of differentiation 36; ACOX1: Acyl-CoA oxidase 1; ECH1: Enoyl coenzyme A hydratase 1; MCAD: Medium-chain acyl-coenzyme A dehydrogenase; NC: Normal control.
Figure 5 F-box only protein 2 directly binds to the hydroxyl CoA dehydrogenase alpha subunit and vice versa.
A: Proteins interacting with endogenous F-box only protein 2 (FBXO2) in HepG2 cells as revealed using a co-immunoprecipitation (co-IP)-based mass spectrometry method; B: Immunofluorescence staining of HEK293T cells transfected with His-FBXO2 and Myc-the hydroxyl CoA dehydrogenase alpha subunit plasmids; C-F: Co-IP assays in HEK293T and HepG2 cells. FBXO2: F-box only protein 2; HADHA: Hydroxyl CoA dehydrogenase alpha subunit; IgG: Immunoglobulin G; DAPI: 4’-6-diamidino-2-phenylindole.
Figure 6 F-box only protein 2 ubiquitinated and degraded the hydroxyl CoA dehydrogenase alpha subunit.
A: The hydroxyl CoA dehydrogenase alpha subunit (HADHA) ubiquitination in HEK293T cells; B-D: Western blot of F-box only protein 2 (FBXO2) and HADHA expression in the His-Vector group vs His-FBXO2 group (B), Sh-NC group vs Sh-FBXO2 group (C), and adeno-associated virus (AAV)-His-vector mice vs AAV-His-FBXO2 mice (D); E: Western blot of FBXO2 and HADHA expression in HepG2 cells. HepG2 cells were transfected with His-FBXO2 plasmids for 24 h, followed by incubation with or without MG132 for 24 h; F: Western blot of FBXO2 and HADHA expression in HepG2 cells. HepG2 cells were transfected with FBXO2 adenovirus for 48 h, followed by incubation with cycloheximide (CHX) for 0, 4, or 8 h before sample collection; G-J: HepG2 cells were transfected with His-FBXO2 plasmids and Myc-HADHA plasmids to overexpress FBXO2 and HADHA, respectively, followed by treatment with oleate for 24 h; representative images of Oil Red O staining (G), triglyceride (H) and total cholesterol (I) levels; expression analysis of genes associated with lipogenesis, fatty acid uptake, and oxidation as detected using quantitative reverse transcription polymerase chain reaction (J). FBXO2: F-box only protein 2; HADHA: Hydroxyl CoA dehydrogenase alpha subunit; aP < 0.05, bP < 0.01, cP < 0.001. AAV: Adeno-associated virus; OA: Oleate; TG: Triglyceride; T-Cho: Total cholesterol; FASN: Fatty acid synthase; PPAR: Peroxisome proliferator-activated receptor; CD36: Cluster of differentiation 36; ACOX1: Acyl-CoA oxidase 1; ECH1: Enoyl coenzyme A hydratase 1; MCAD: Medium-chain acyl-coenzyme A dehydrogenase; NC: Normal control.
- Citation: Liu Z, Chen NY, Zhang Z, Zhou S, Hu SY. F-box only protein 2 exacerbates non-alcoholic fatty liver disease by targeting the hydroxyl CoA dehydrogenase alpha subunit. World J Gastroenterol 2023; 29(28): 4433-4450
- URL: https://www.wjgnet.com/1007-9327/full/v29/i28/4433.htm
- DOI: https://dx.doi.org/10.3748/wjg.v29.i28.4433


