Copyright
©The Author(s) 2023.
World J Gastroenterol. May 28, 2023; 29(20): 3168-3184
Published online May 28, 2023. doi: 10.3748/wjg.v29.i20.3168
Published online May 28, 2023. doi: 10.3748/wjg.v29.i20.3168
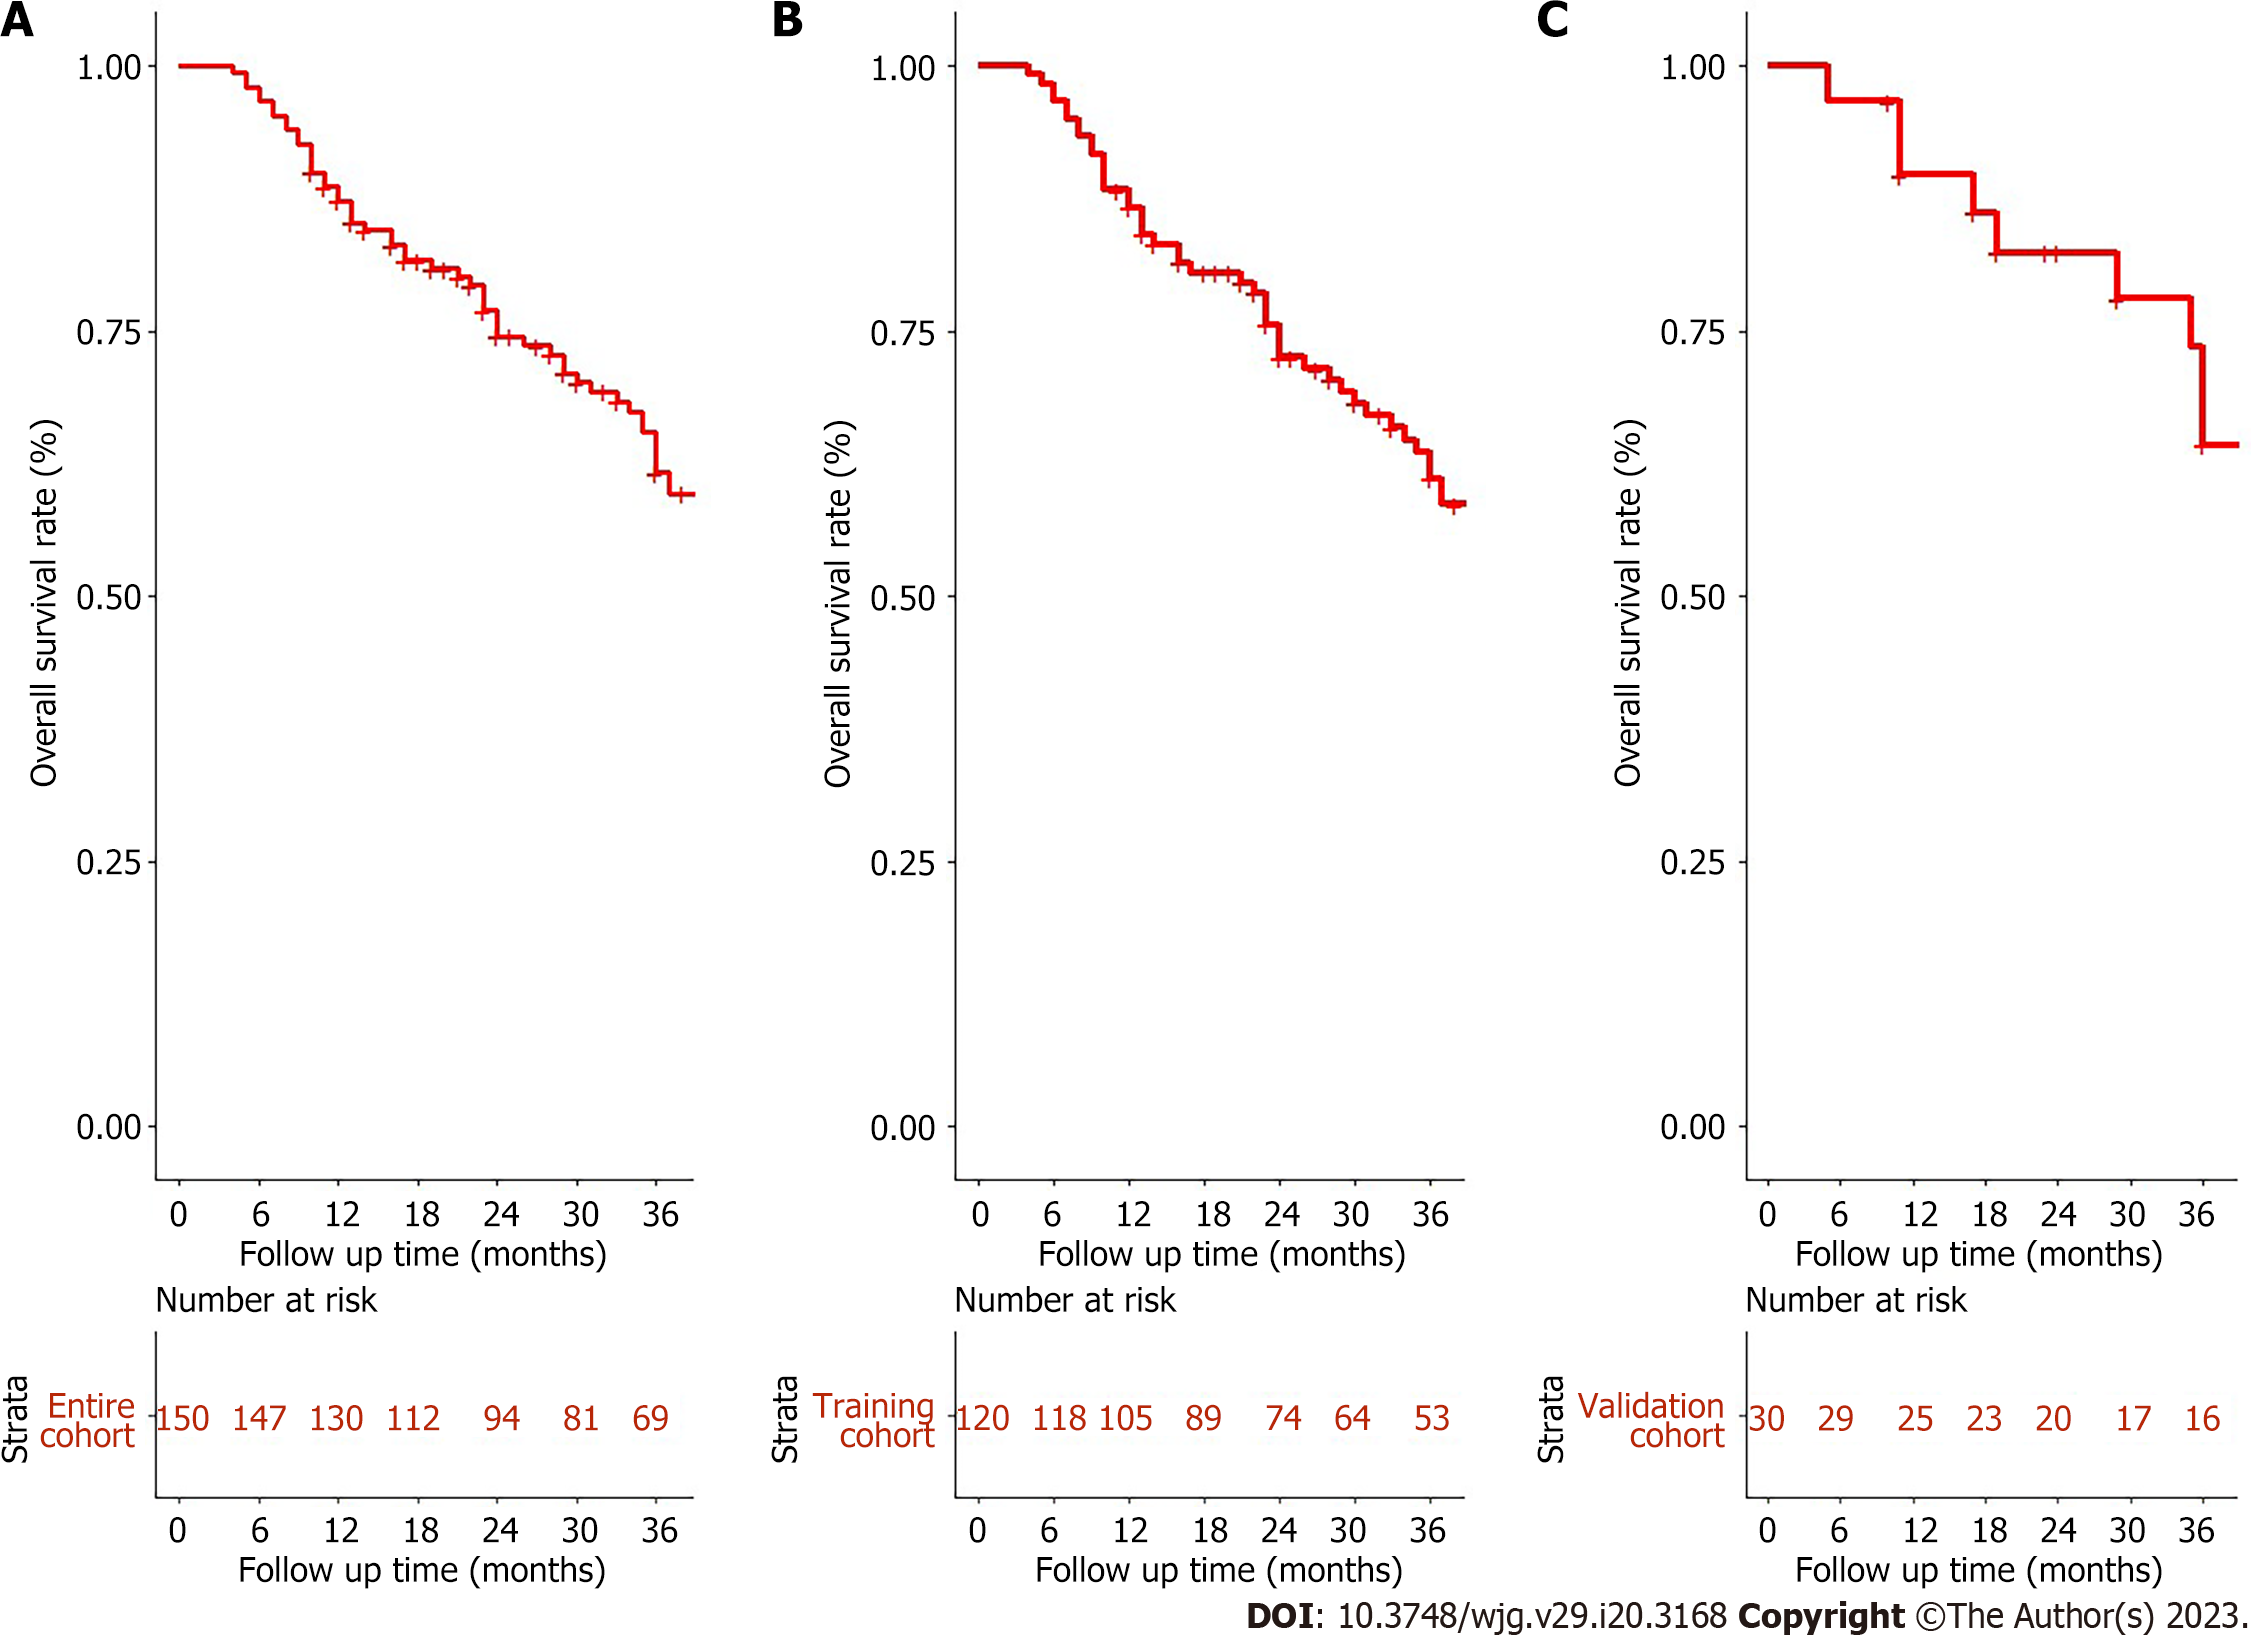
Figure 1 Overall survival for unresectable hepatocellular carcinoma patients accepted conversion therapy.
A: Entire cohort; B: Training cohort; C: Validation cohort.
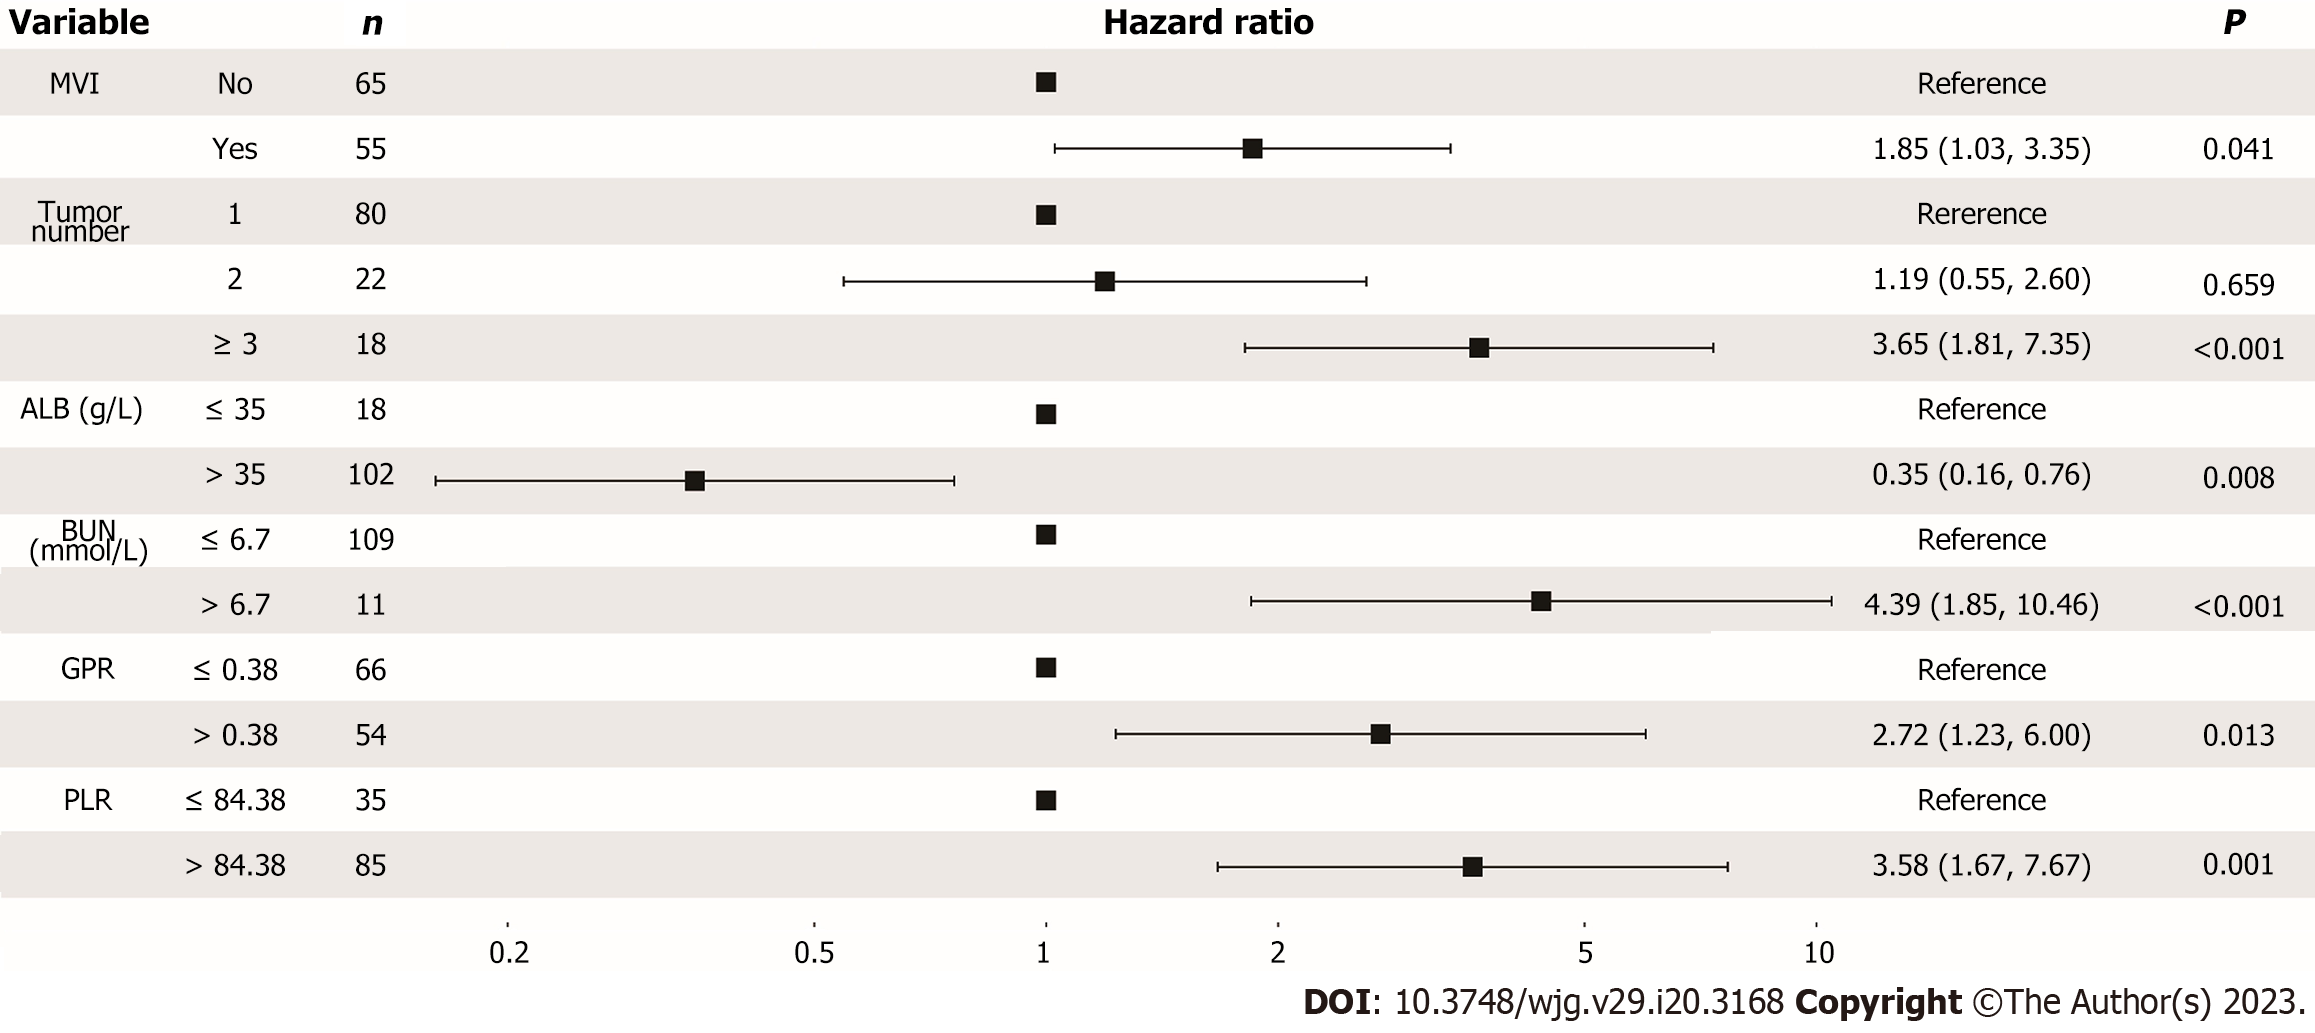
Figure 2 Forest plot for multivariance cox analysis of overall survival in the training cohort.
CI: Confident interval; MVI: Macrovascular invasion; ALB: Albumin; BUN: Blood urea nitrogen; GPR: Gamma-glutamyl transpeptidase to platelet ratio; PLR: Platelet to lymphocyte ratio.
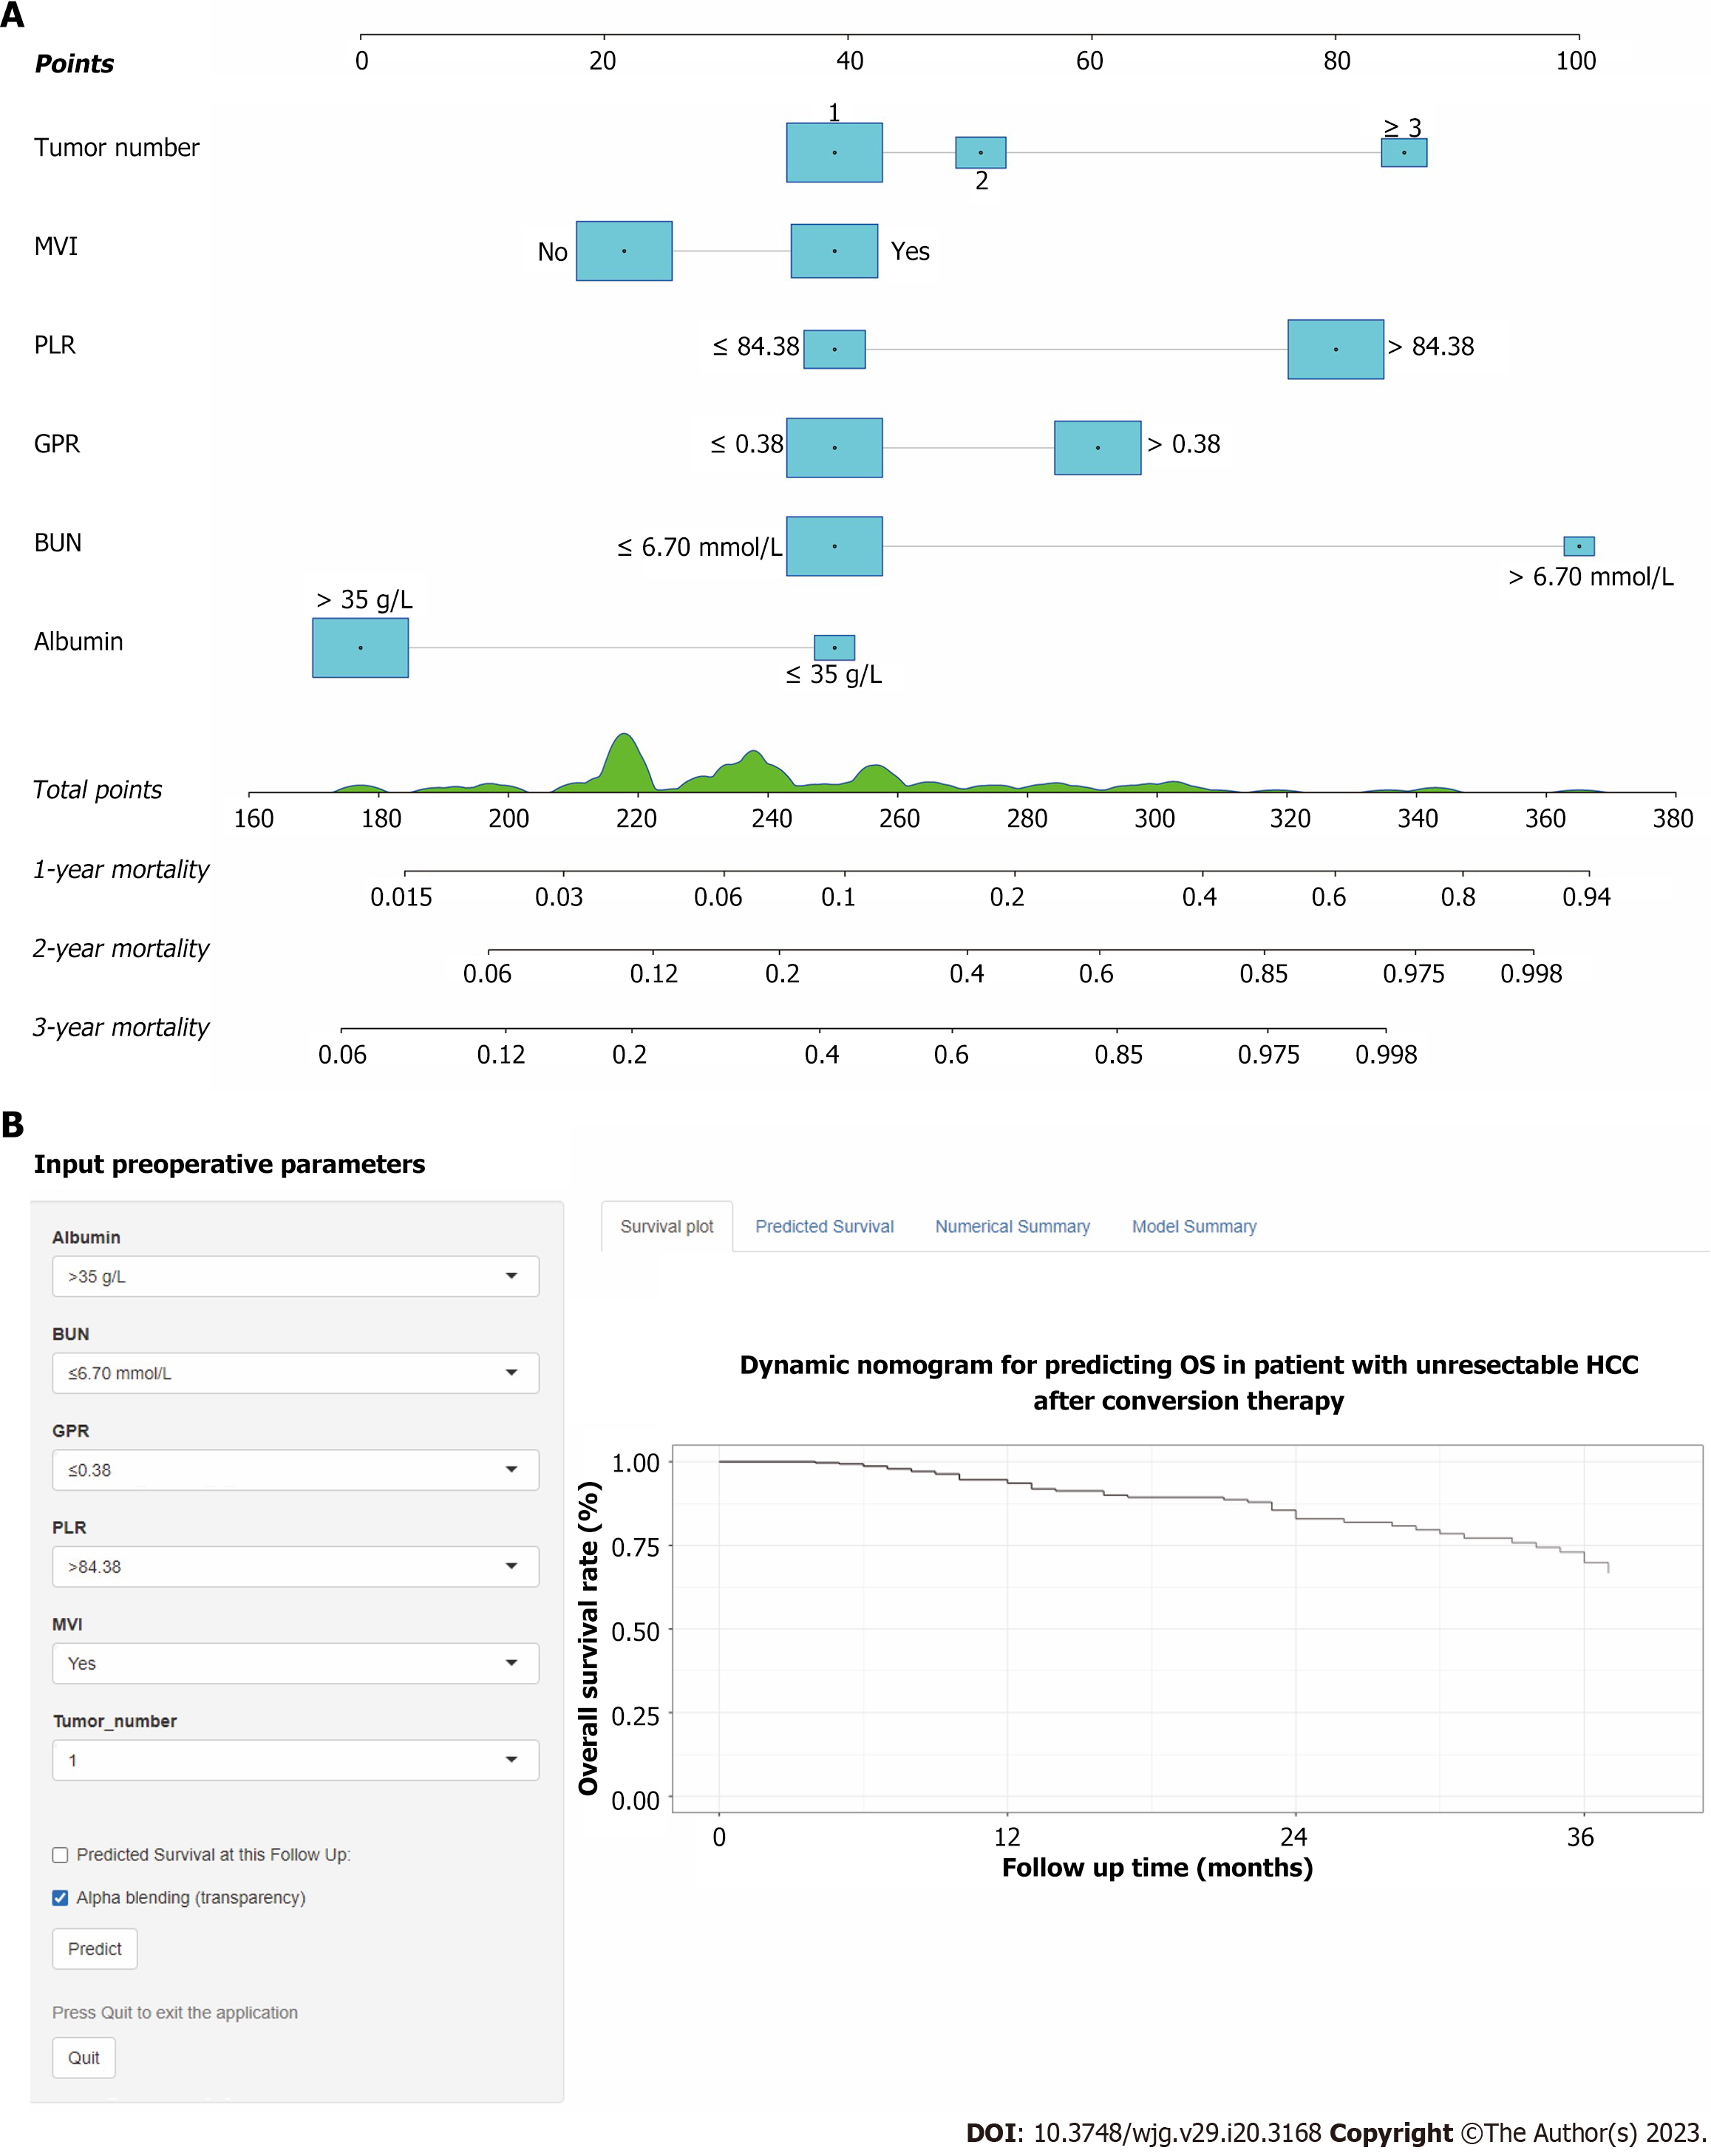
Figure 3 Conversion therapy model for unresectable hepatocellular carcinoma patients accepted conversion therapy.
A: A constructed nomogram for predicting 1-, 2-, 3-year overall survival; B: Screenshot of the online individualized prediction tool based on the overall survival nomogram model. OS: Overall survival; MVI: Macrovascular invasion; BUN: Blood urea nitrogen; GPR: Gamma-glutamyl transpeptidase to platelet ratio; PLR: Platelet to lymphocyte ratio.
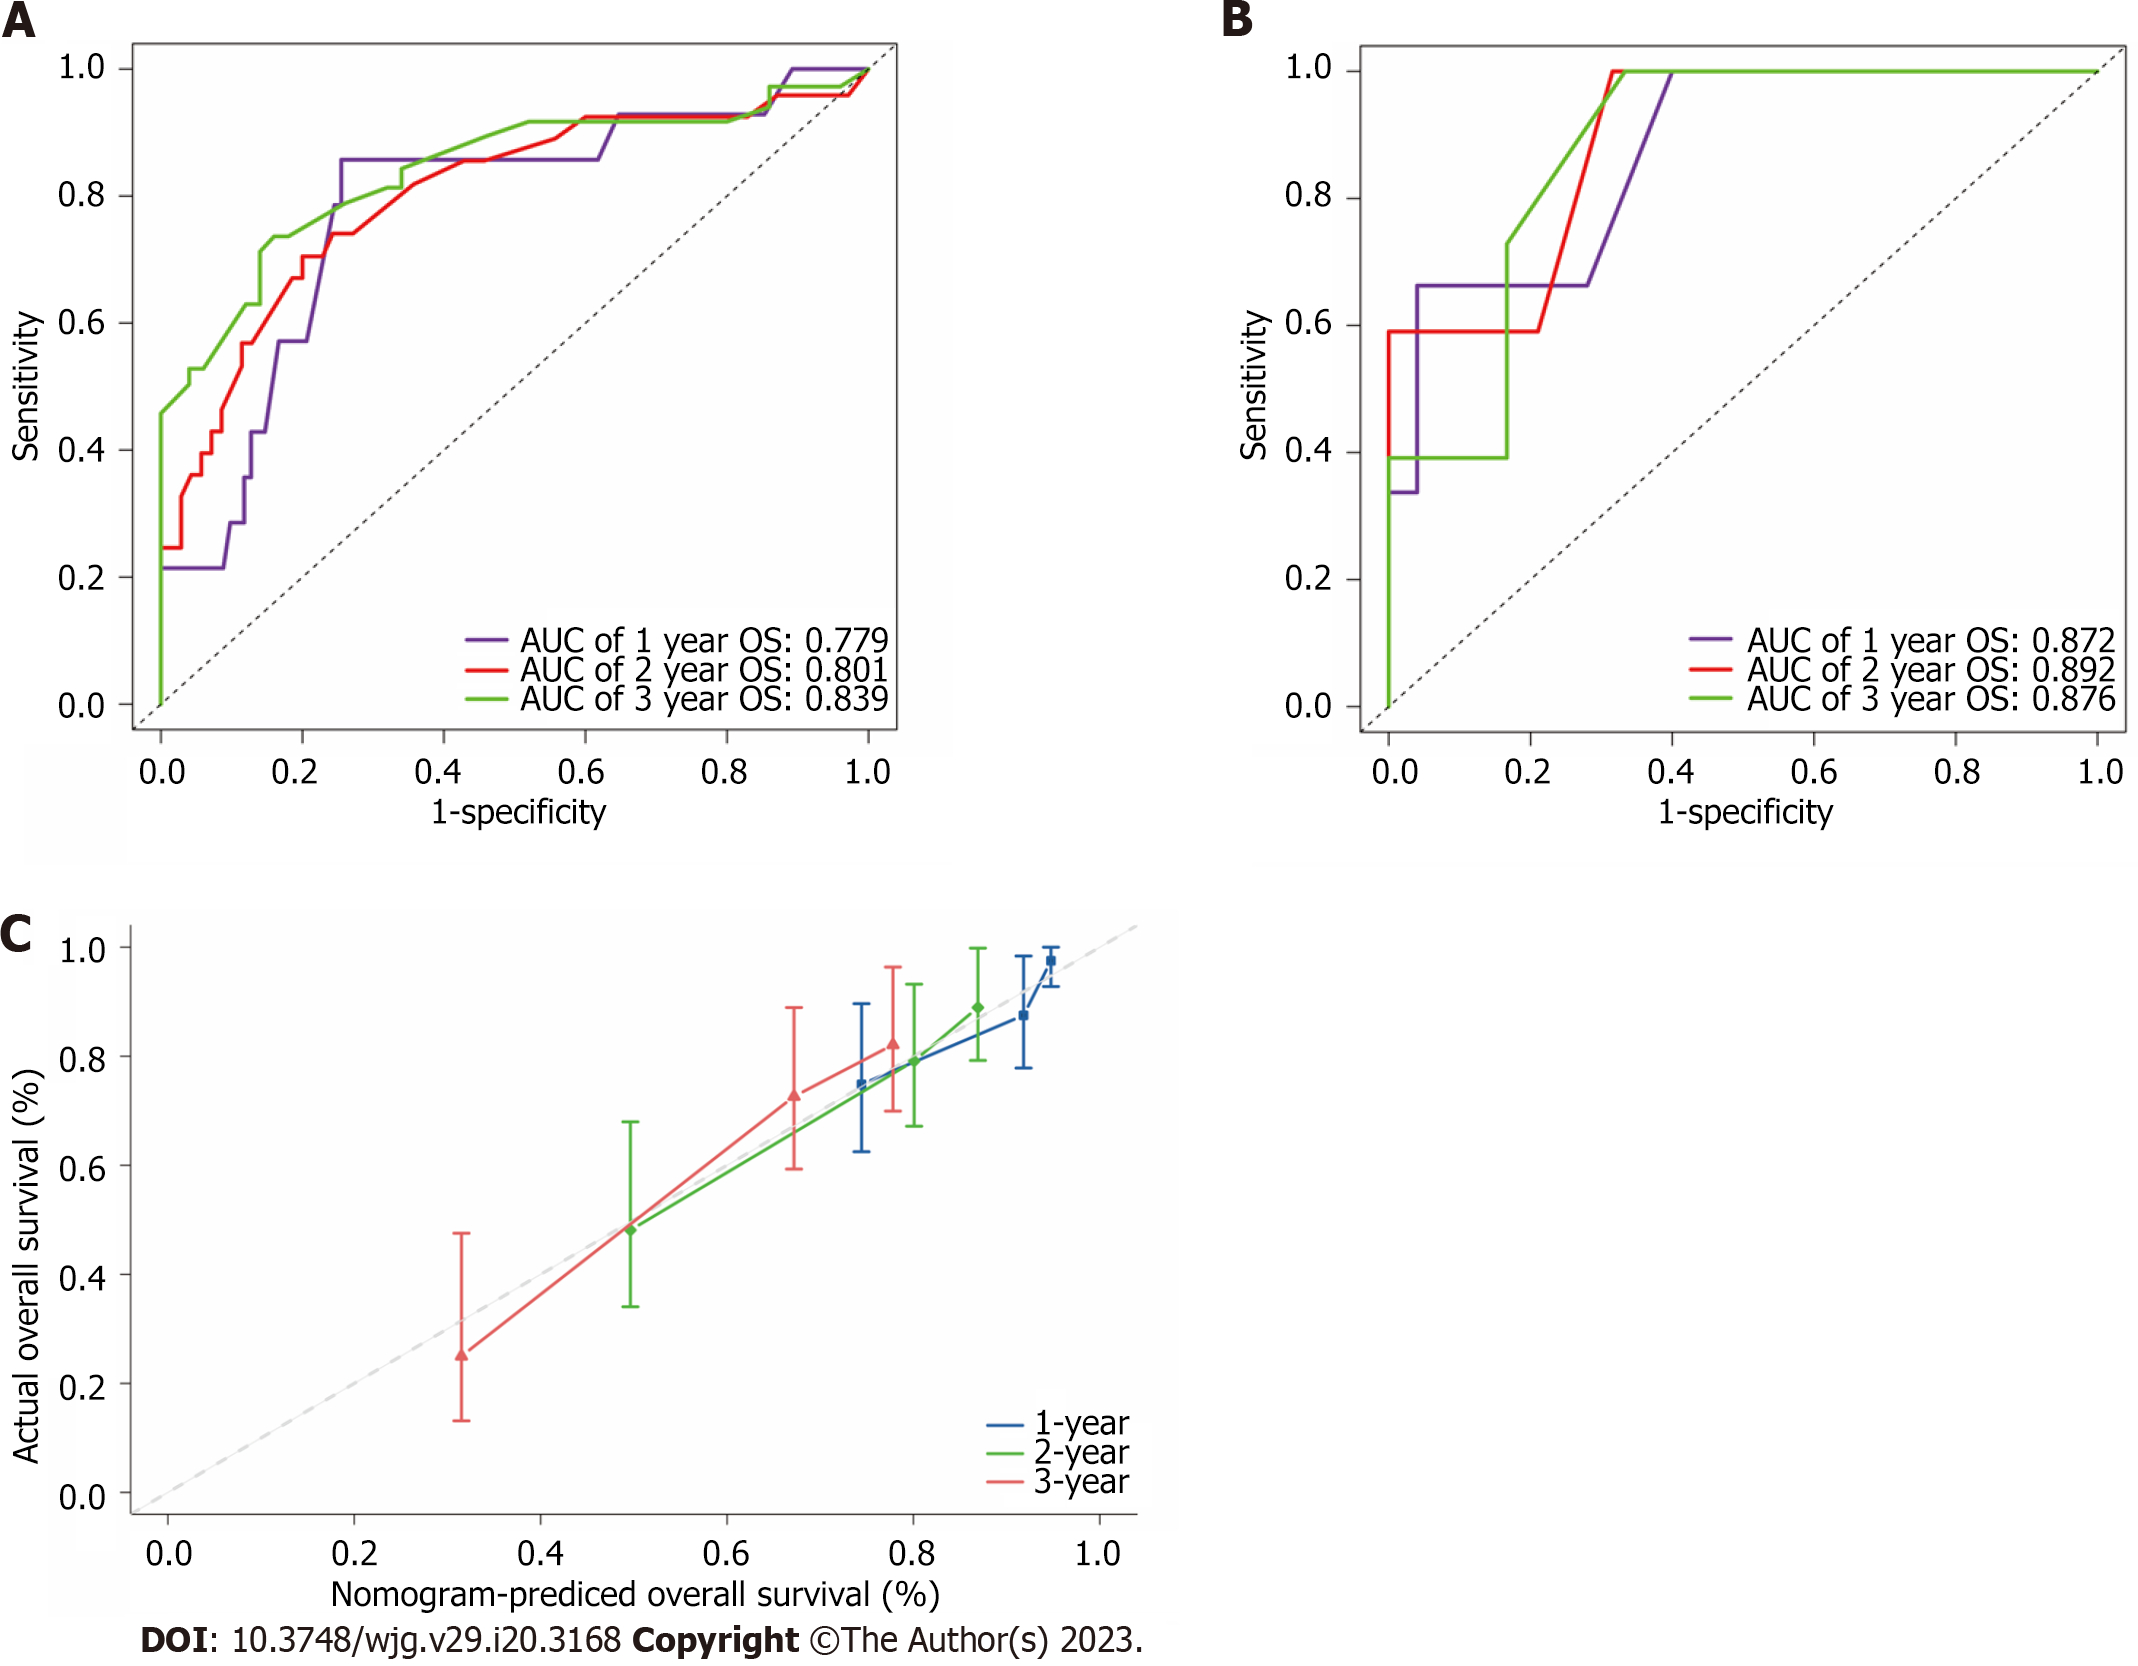
Figure 4 The receiver operating characteristic curves, calibration curve and decision curve analysis curves of the model.
A and B: Receiver operating characteristic for overall survival in the training (A) and validation cohort (B), respectively; C: Calibration curve plots of nomogram for predicting 1-year, 2-year and 3-year probability of survival in the training cohort. OS: Overall survival; AUC: Area under the curve.
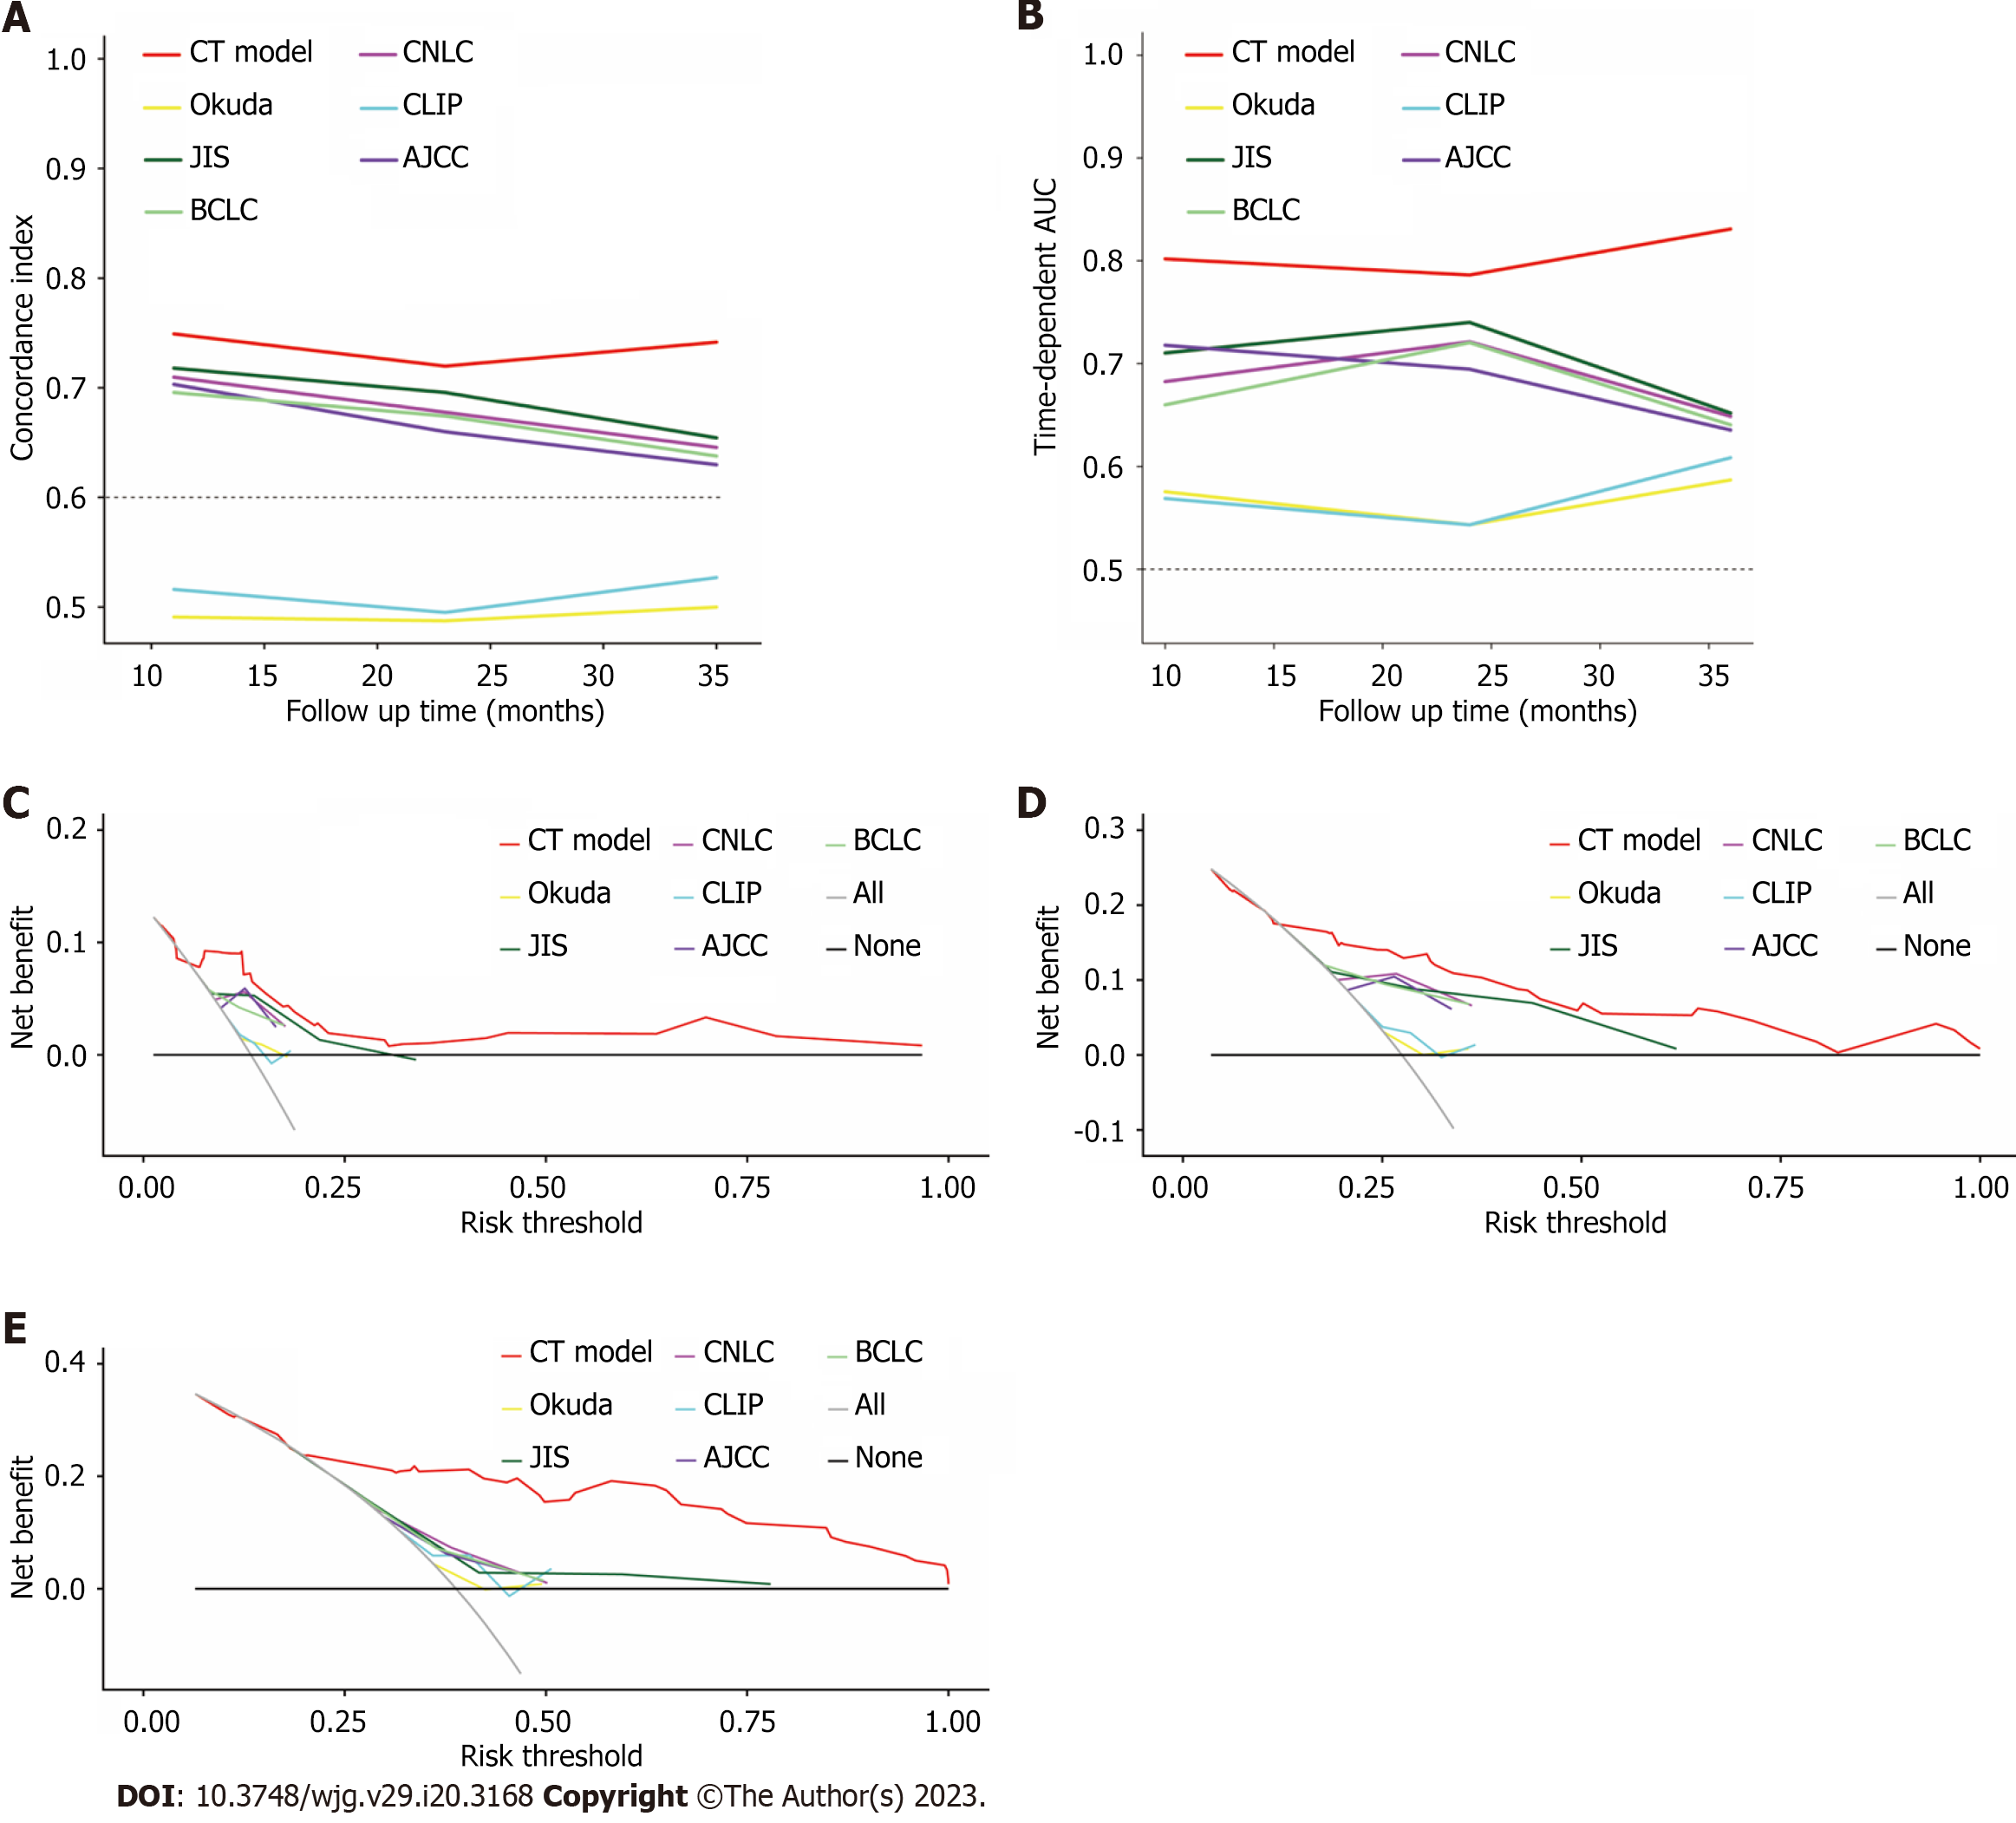
Figure 5 Comparison of model predictive performance in predicting overall survival.
A: Comparison of concordance index between conversion therapy (CT) model and traditional staging systems in the training cohort; B: Comparison of time-dependent areas under receiver operating characteristic curve between CT model and other staging systems in the training cohort; the decision curve analysis curve compared the clinical practicability of the CT model and other six conventional hepatocellular carcinoma staging systems; C-E: 1-year (C), 2-year (D) and 3-year (E) survival benefit in the training cohort. AUC: Areas under receiver operating characteristic curve; CT: Conversion therapy; CNLC: China liver cancer staging; CLIP: Cancer of the Liver Italian Program; JIS: Japan integrated staging; BCLC: Barcelona Clinic Liver Cancer; AJCC: American Joint Committee on Cancer.
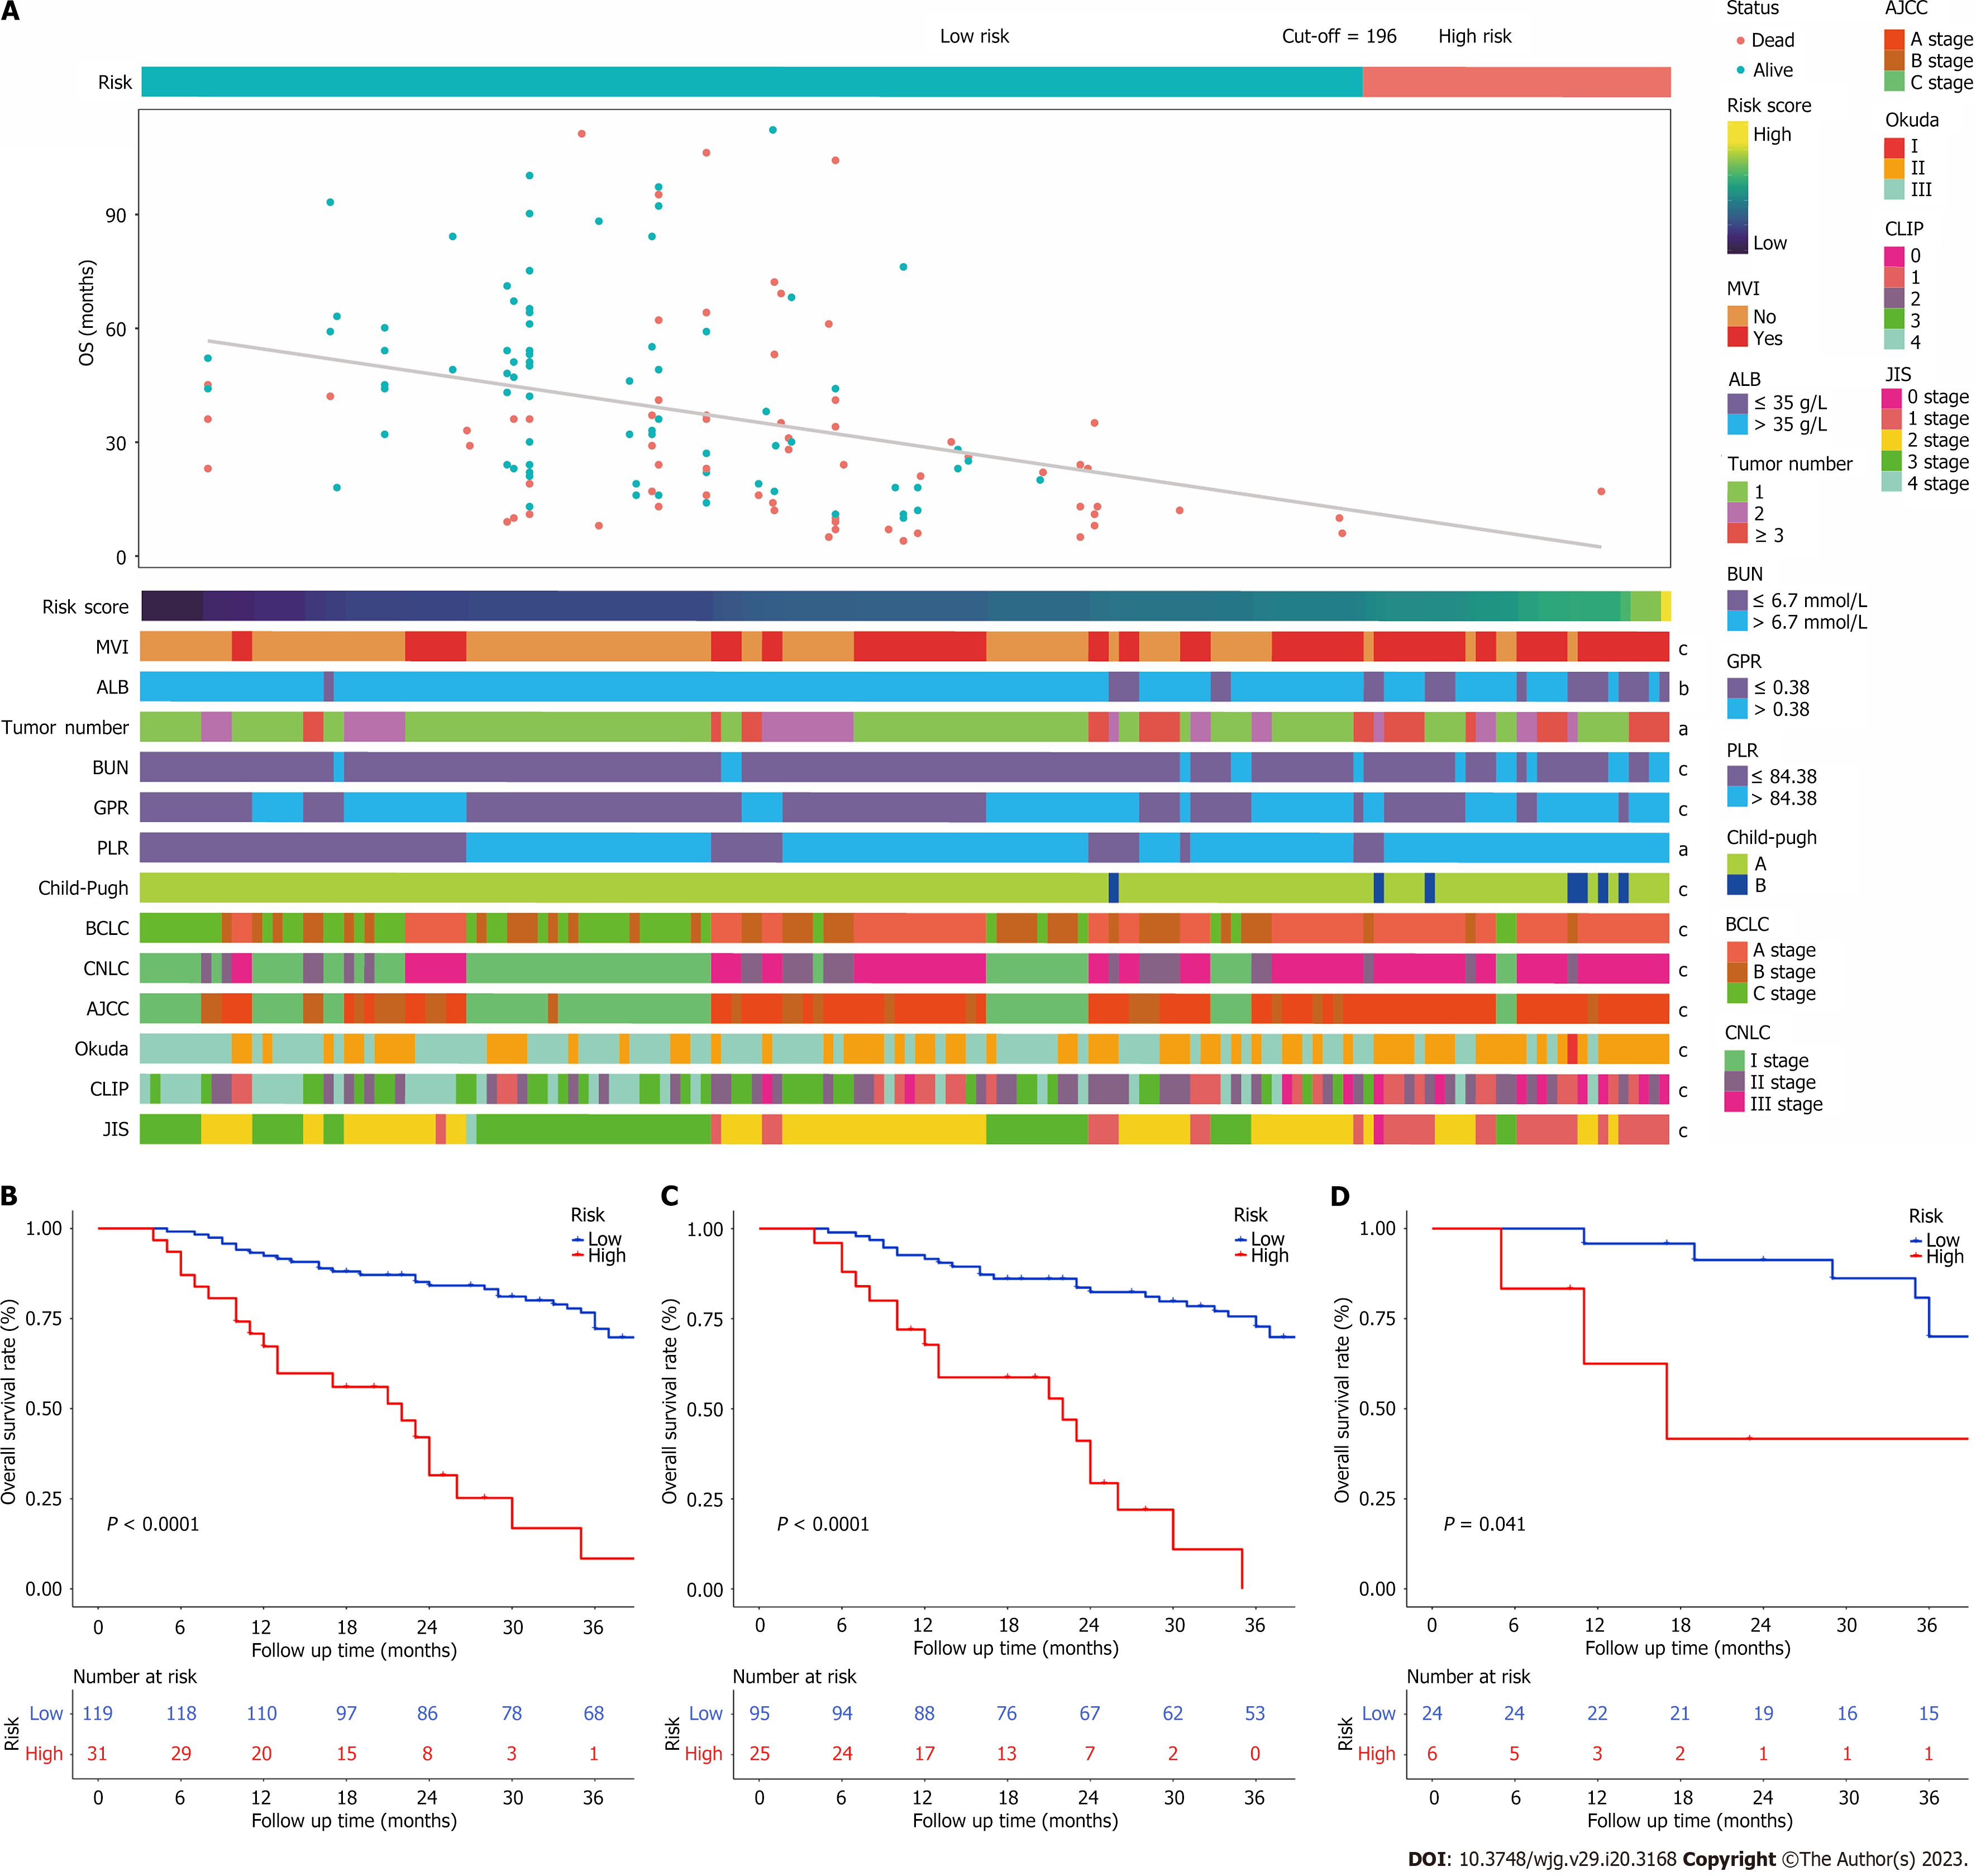
Figure 6 A Heatmap presents the distribution of corresponding risk score and clinical feature in each patient within high and low risk groups.
A: It shows that the patients in low-risk group have more favourable prognosis; B-D: Kaplan-Meier survival curves for patients with low and high risk stratified by the total nomogram score in the entire cohort (B), training cohort (C), and validation cohort (D). aP < 0.05, bP < 0.01, cP < 0.001 was considered significant. ALB: Albumin; MVI: Macrovascular invasion; BUN: Blood urea nitrogen; GPR: Gamma-glutamyl transpeptidase to platelet ratio; PLR: Platelet to lymphocyte ratio; CNLC: China liver cancer staging; CLIP: Cancer of the Liver Italian Program; JIS: Japan integrated staging; BCLC: Barcelona Clinic Liver Cancer; AJCC: American Joint Committee on Cancer.
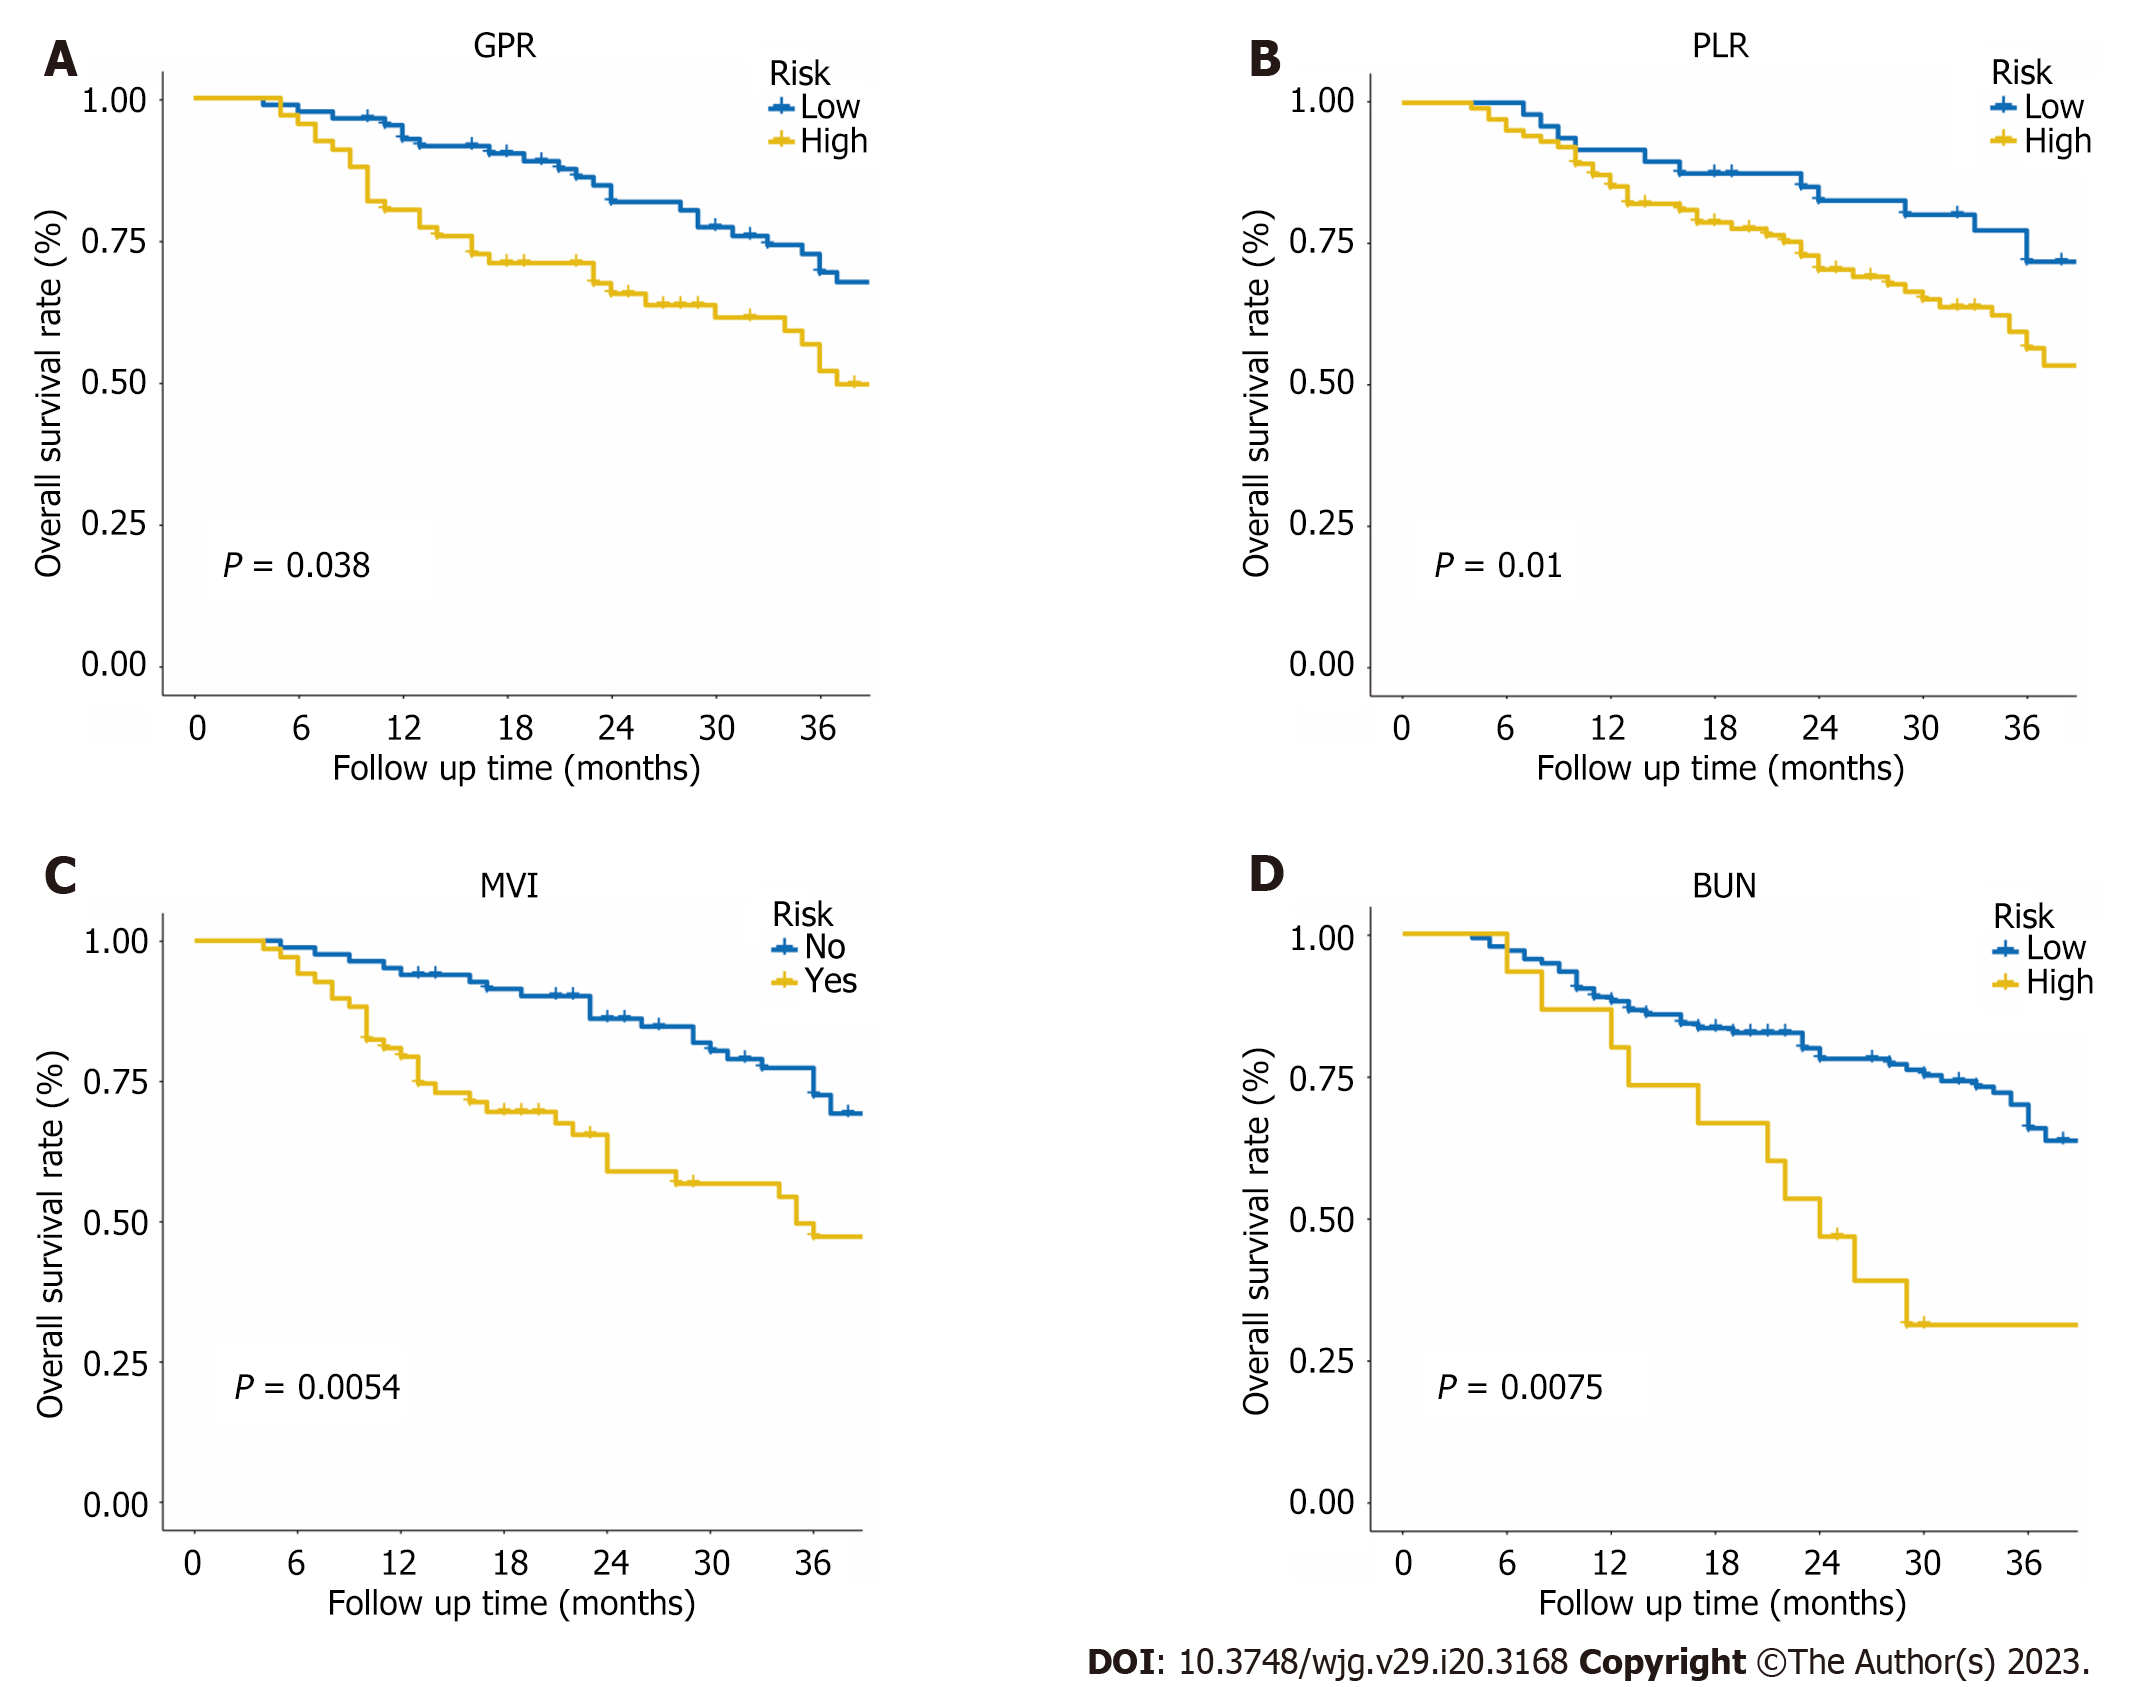
Figure 7 Kaplan-Meier survival curves for patients with different level of gamma-glutamyl transpeptidase to platelet ratio, platelet to lymphocyte ratio, macrovascular invasion, and blood urea nitrogen in the entire cohort.
A: Gamma-glutamyl transpeptidase to platelet ratio; B: Platelet to lymphocyte ratio; C: Macrovascular invasion; D: Blood urea nitrogen.
- Citation: Wu JL, Luo JY, Jiang ZB, Huang SB, Chen GR, Ran HY, Liang QY, Huang MS, Lai LS, Chen JW. Inflammation-related nomogram for predicting survival of patients with unresectable hepatocellular carcinoma received conversion therapy. World J Gastroenterol 2023; 29(20): 3168-3184
- URL: https://www.wjgnet.com/1007-9327/full/v29/i20/3168.htm
- DOI: https://dx.doi.org/10.3748/wjg.v29.i20.3168


