Copyright
©The Author(s) 2023.
World J Gastroenterol. May 28, 2023; 29(20): 3133-3144
Published online May 28, 2023. doi: 10.3748/wjg.v29.i20.3133
Published online May 28, 2023. doi: 10.3748/wjg.v29.i20.3133
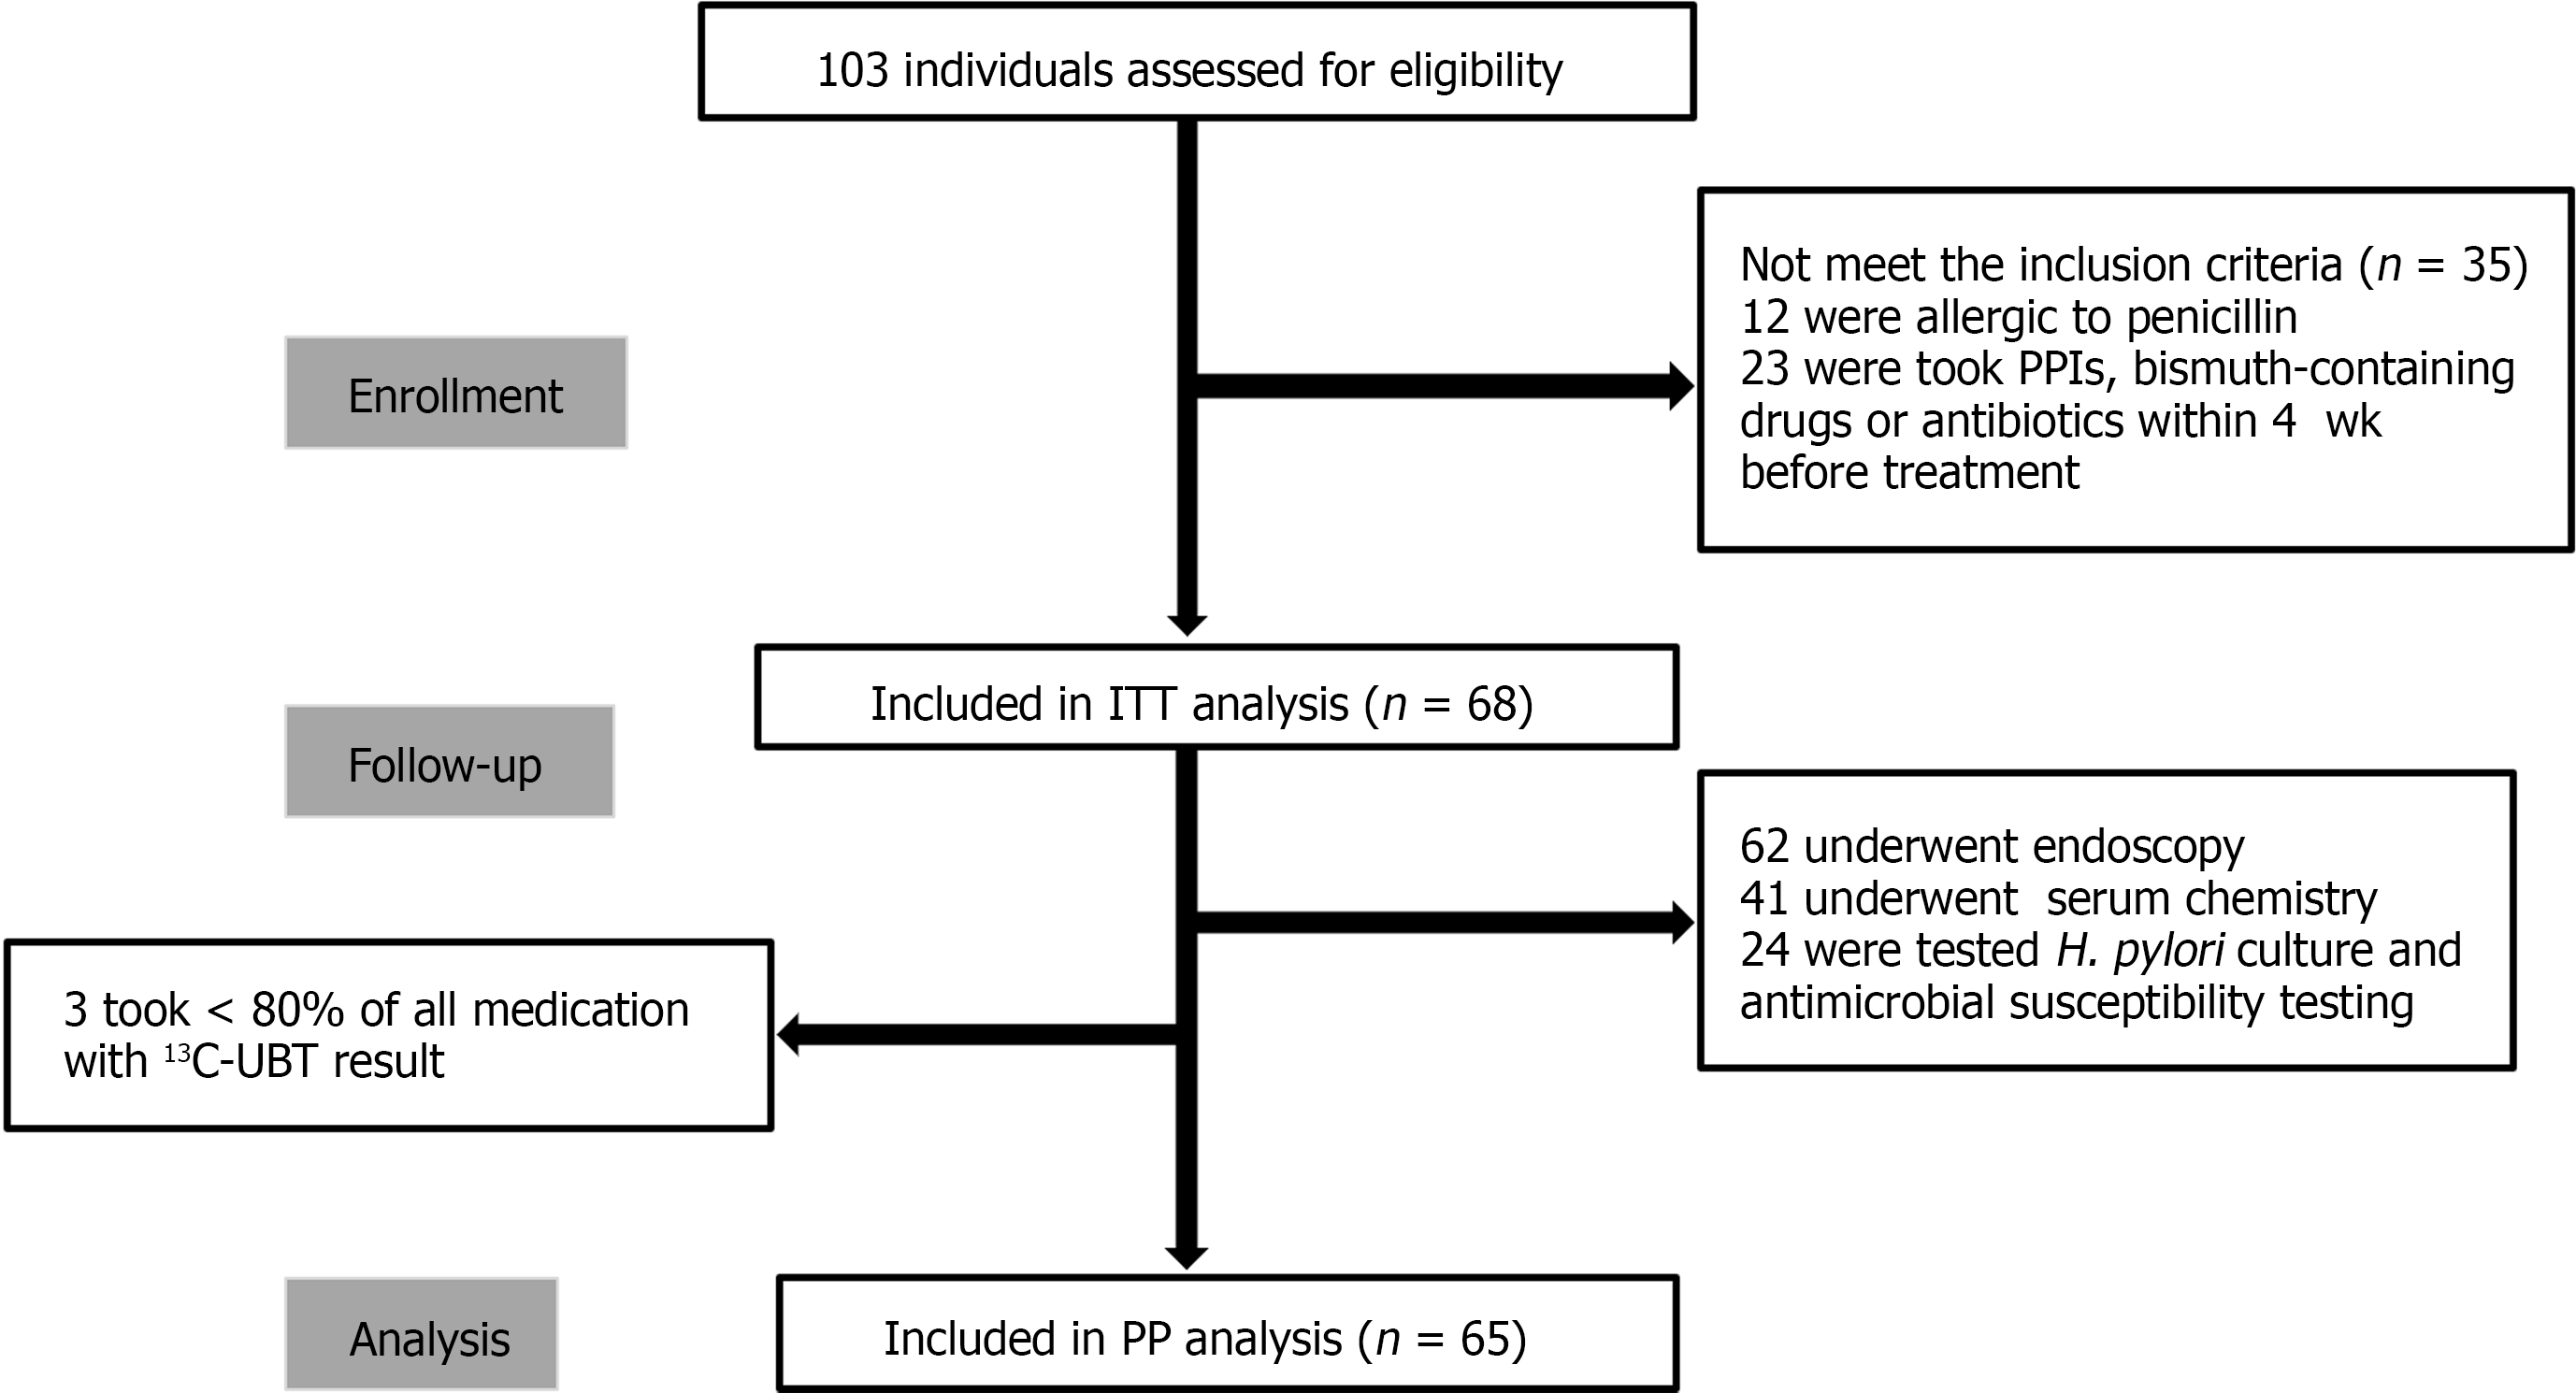
Figure 1 Flow chart of the study.
PPI: Proton pump inhibitor; ITT: Intention-to-treat analysis; PP: Per-protocol analysis; UBT: Urea breath test; H. pylori: Helicobacter pylori.
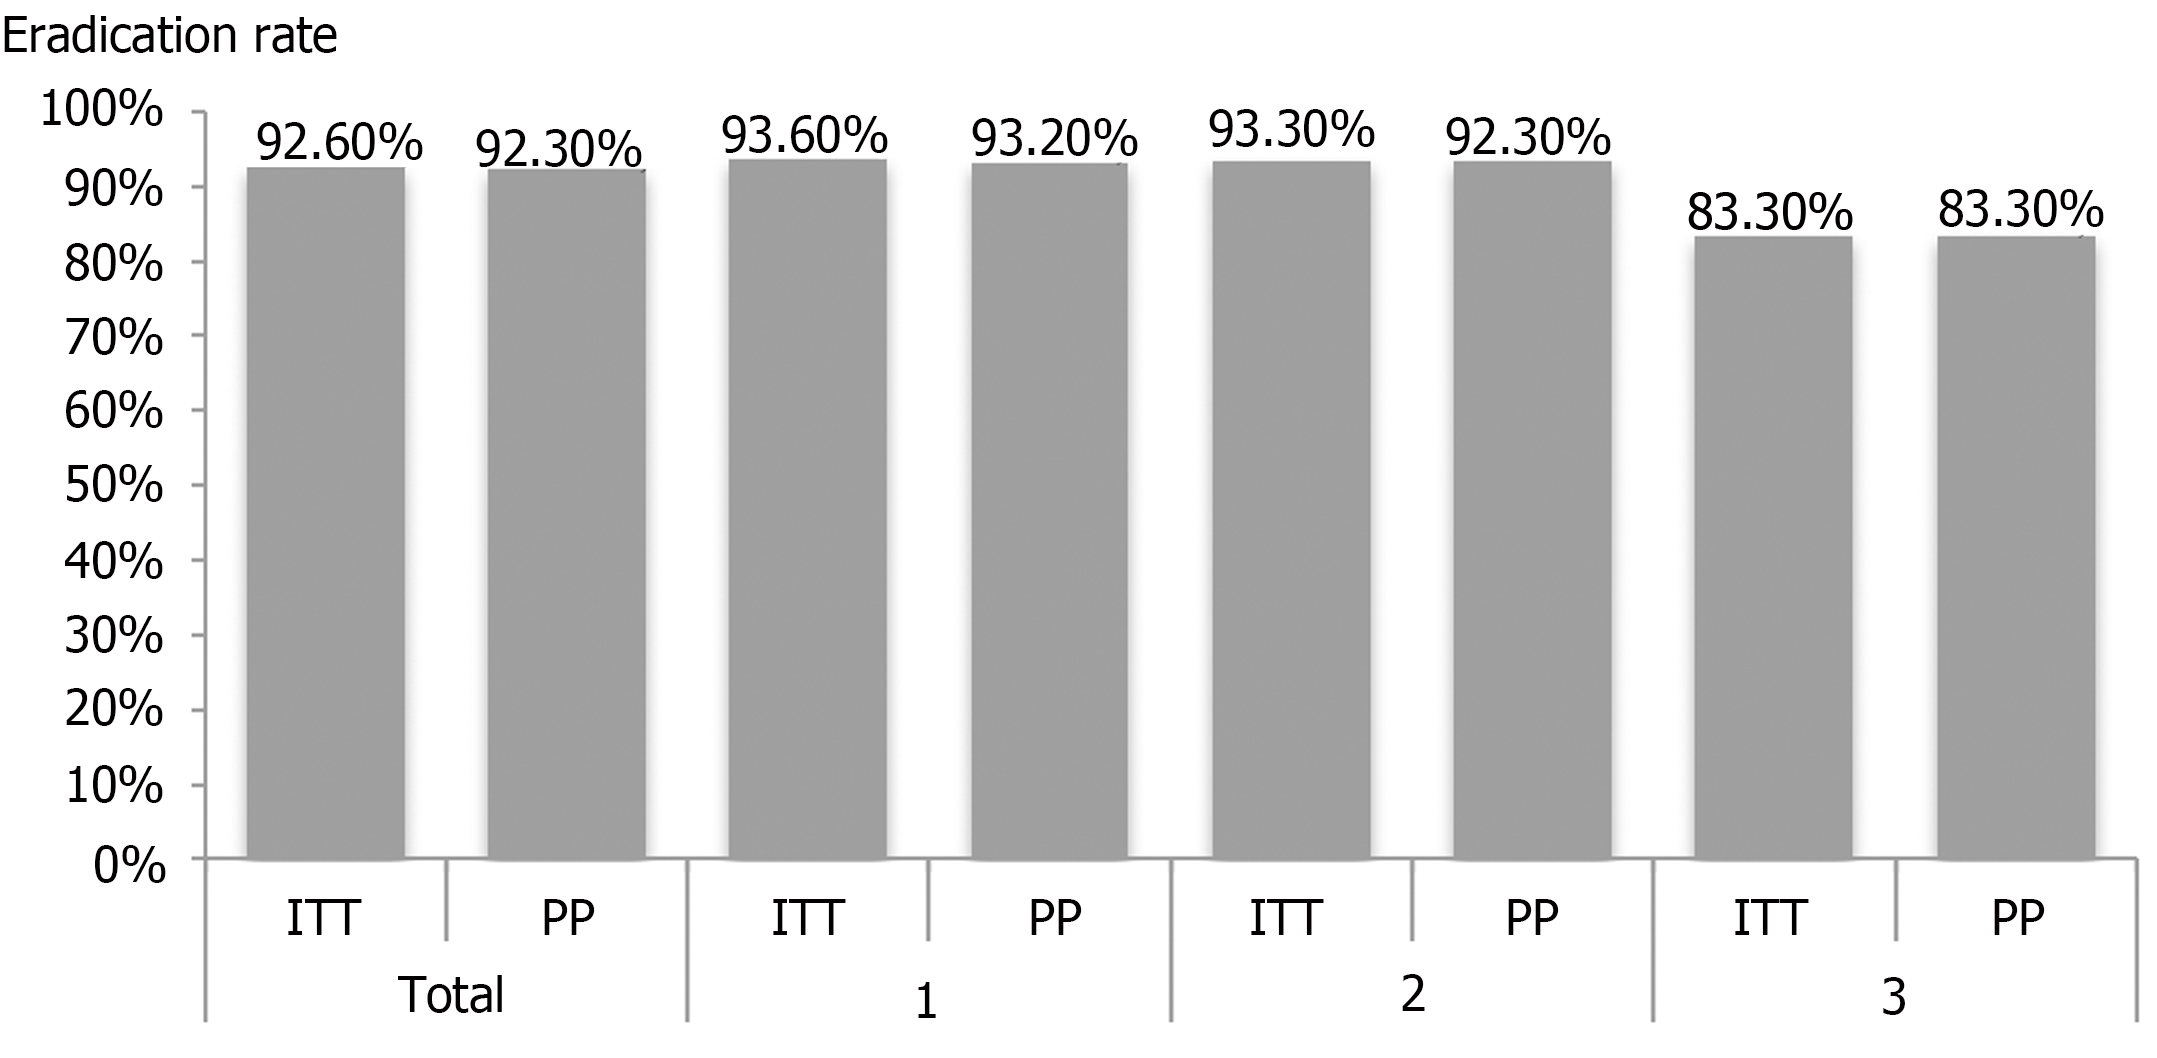
Figure 2 Eradication rates stratified by number of prior treatment failures.
ITT: 93.6% vs 93.3% vs 83.3%, P = 0.433; PP: 93.2% vs 93.3% vs 83.3%, P = 0.585). ITT: Intention-to-treat analysis; PP: Per-protocol analysis.
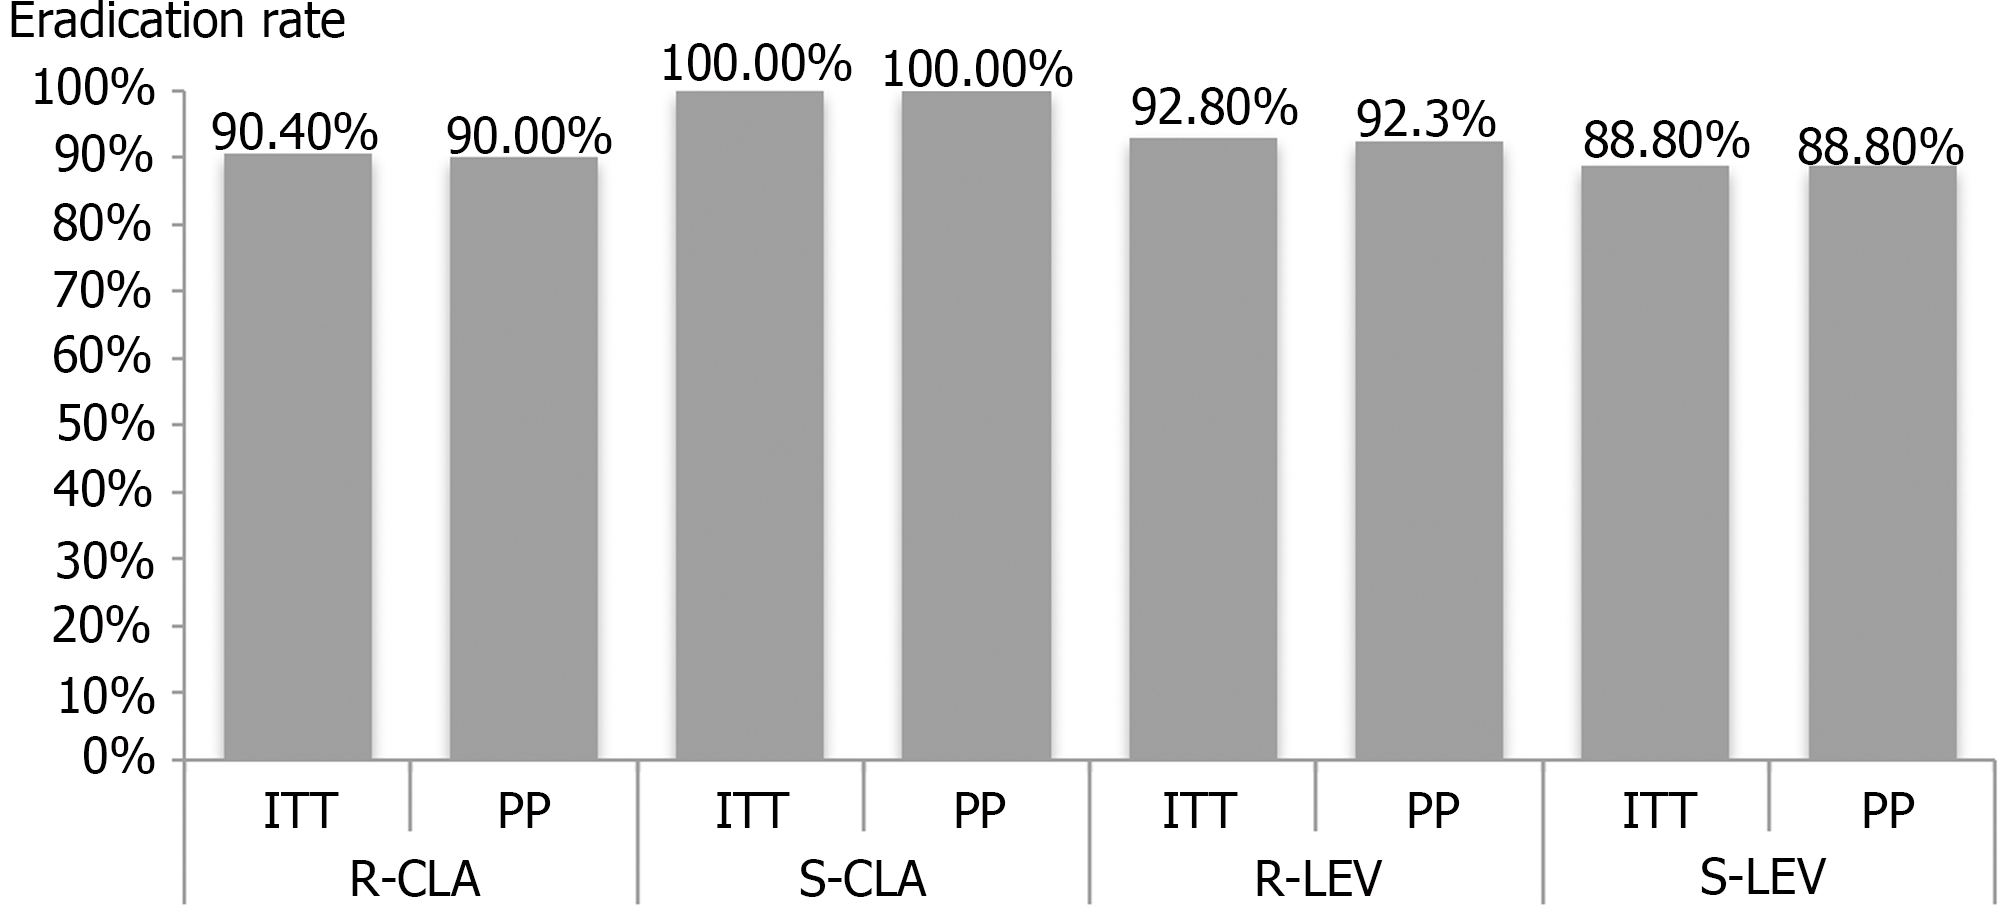
Figure 3 Impact of bacterial antibiotic resistance on eradication rate.
ITT: Clarithromycin resistant vs clarithromycin sensitive, P = 1.00; levofloxacin resistant vs levofloxacin sensitive, P = 1.00; PP: Clarithromycin resistant vs clarithromycin sensitive, P = 1.00; levofloxacin resistant vs levofloxacin sensitive, P = 1.00). R-CLA: Clarithromycin resistant; S-CLA: Clarithromycin sensitive; R-LEV: Levofloxacin resistant; S-LEV: Levofloxacin sensitive; ITT: Intention-to-treat analysis; PP: Per-protocol analysis.
- Citation: Yu J, Lv YM, Yang P, Jiang YZ, Qin XR, Wang XY. Safety and effectiveness of vonoprazan-based rescue therapy for Helicobacter pylori infection. World J Gastroenterol 2023; 29(20): 3133-3144
- URL: https://www.wjgnet.com/1007-9327/full/v29/i20/3133.htm
- DOI: https://dx.doi.org/10.3748/wjg.v29.i20.3133


