Copyright
©The Author(s) 2023.
World J Gastroenterol. May 28, 2023; 29(20): 3103-3118
Published online May 28, 2023. doi: 10.3748/wjg.v29.i20.3103
Published online May 28, 2023. doi: 10.3748/wjg.v29.i20.3103
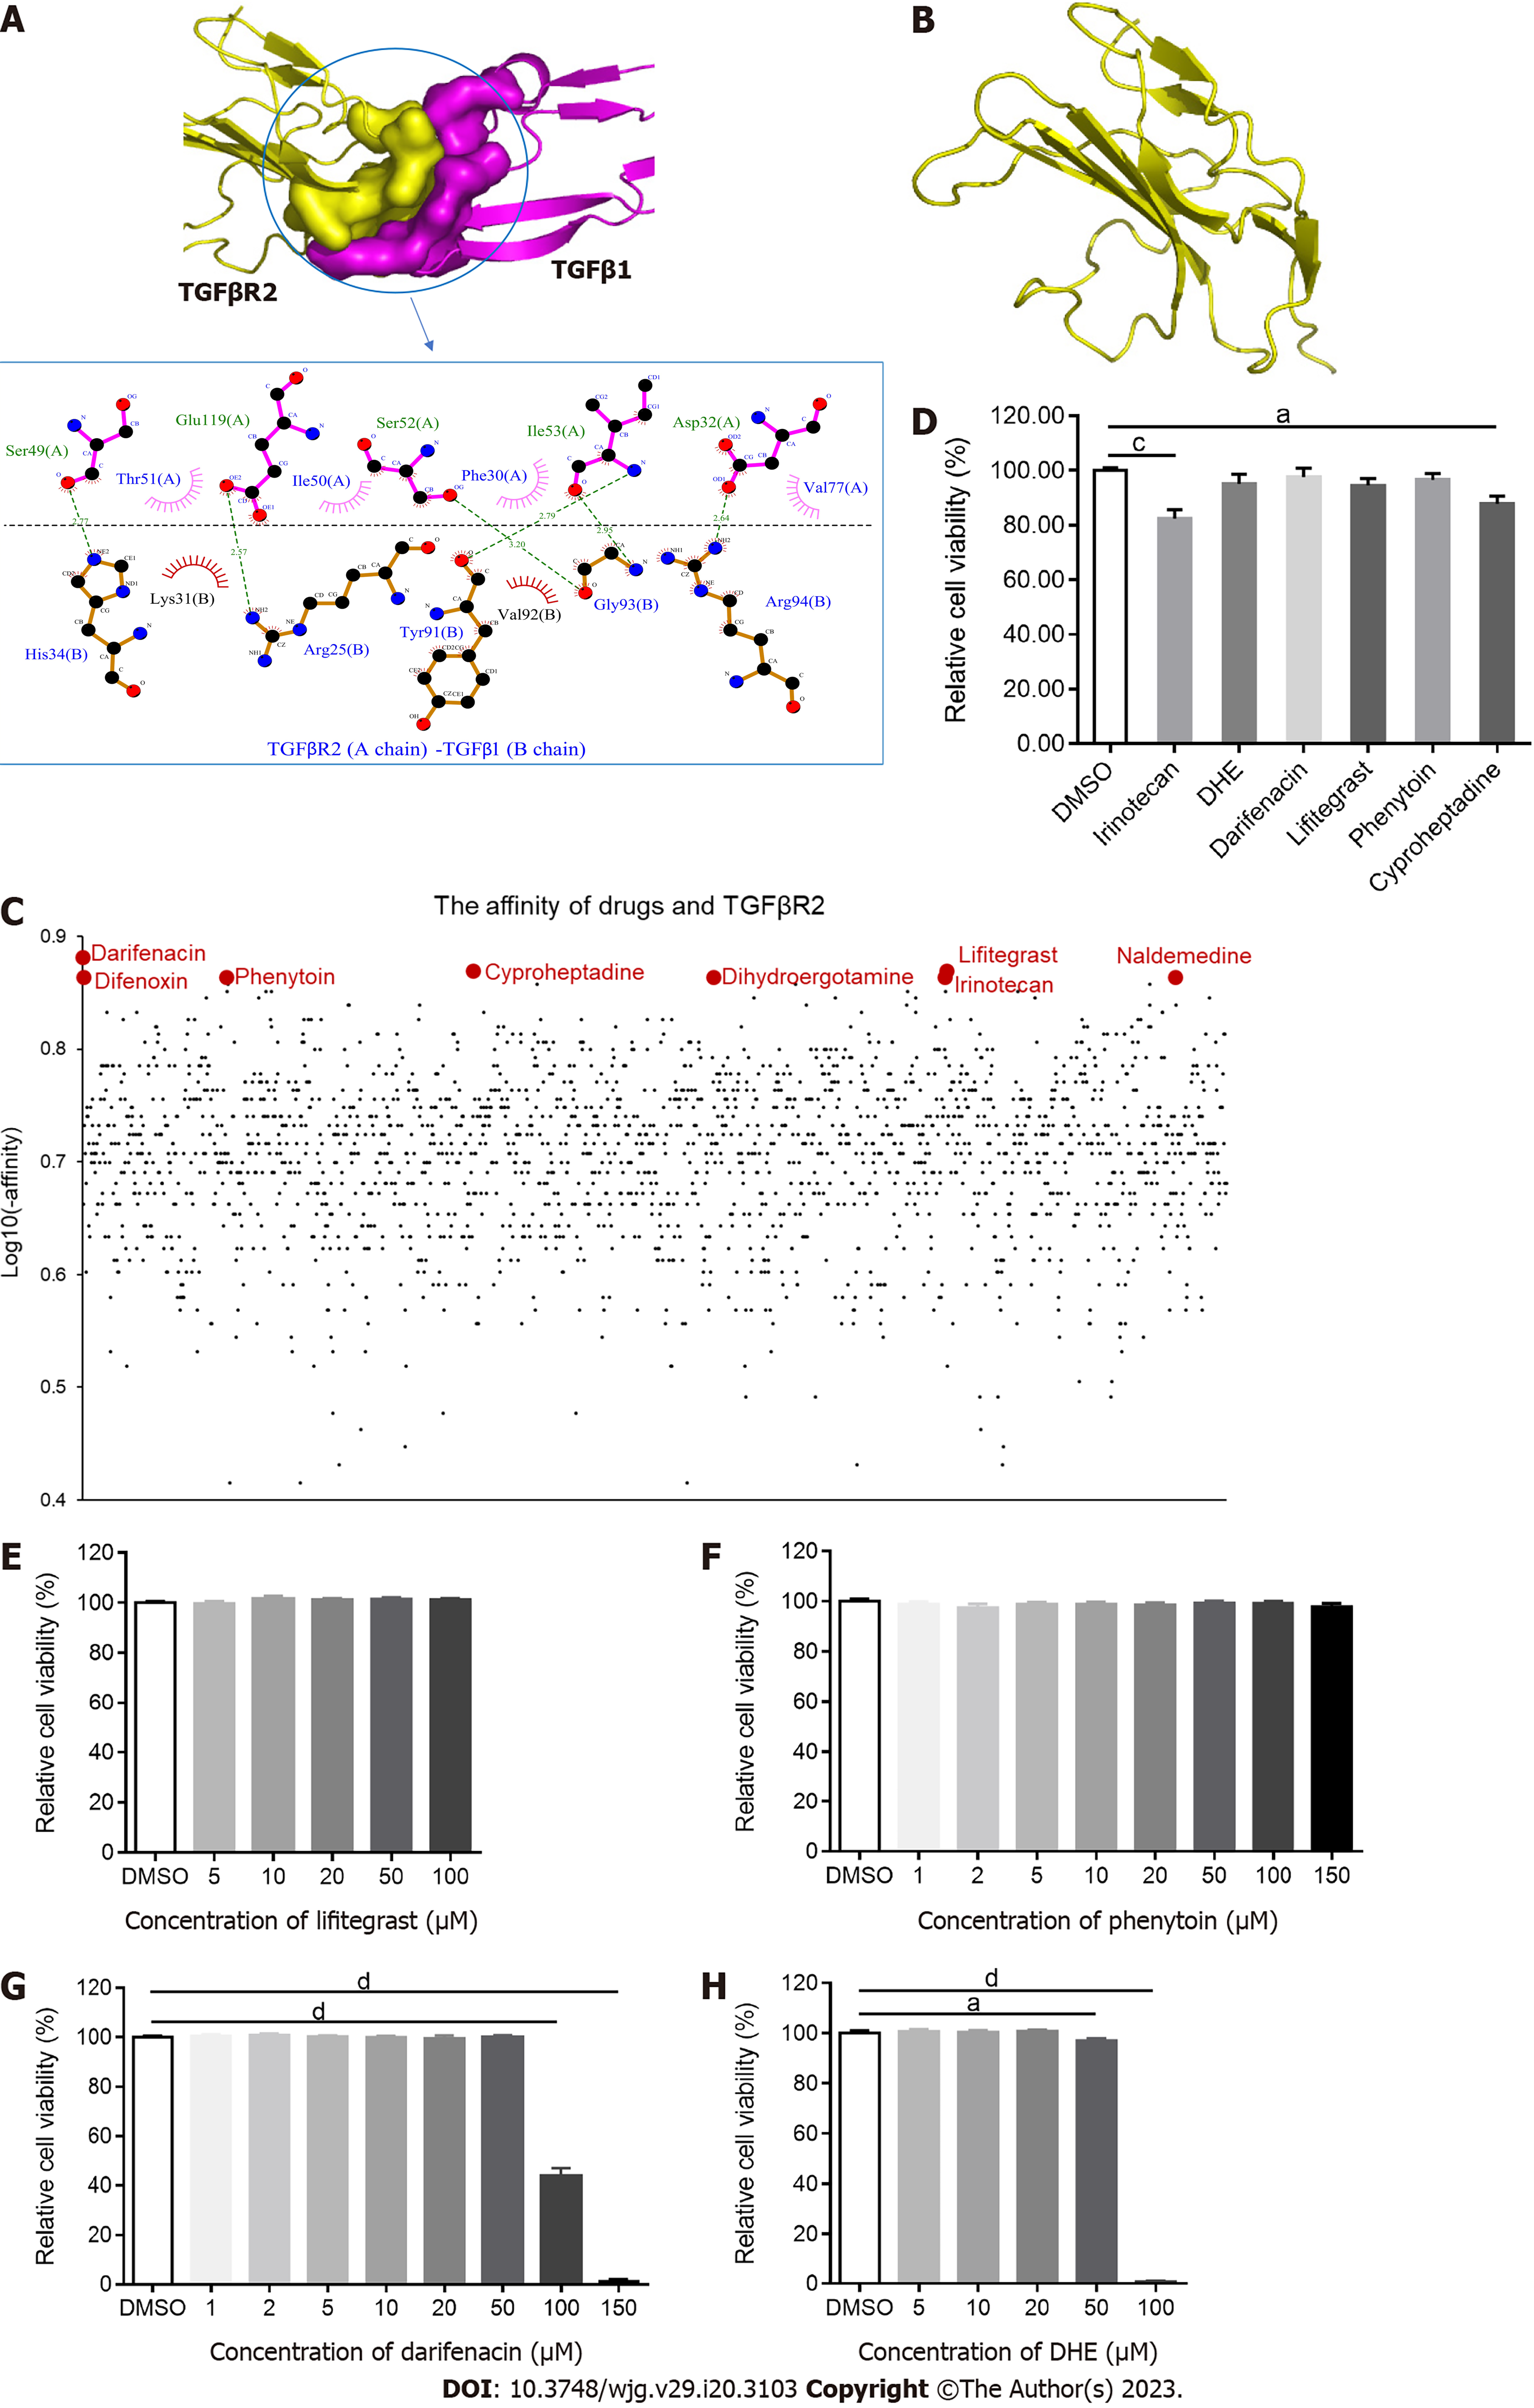
Figure 1 Screening Food and Drug Administration-approved drugs for binding to transforming growth factor β type II receptor.
A: The combination of transforming growth factor β type II receptor (TGFβR2) and transforming growth factor β 1 (TGFβ1); B: The structure of TGFβR2; C: The affinity of each Food and Drug Administration-approved drug and TGFβR2. The affinity of TGFβR2 and darifenacin, cyproheptadine, lifitegrast, difenoxin, phenytoin, dihydroergotamine (DHE), naldemedine, and irinotecan was -7.6, -7.4, -7.4, -7.3, -7.3, -7.3, -7.3, and -7.3 kcal/mol, respectively; D: Cell viability of LX-2 treated with 20 μM of the drugs for 24 h (n = 5); E-H: Cell viability following LX-2 treatment with different concentrations of darifenacin, DHE, lifitegrast, and phenytoin for 24 h (n = 6). All data are presented as mean ± standard error of the mean. One-way ANOVA test was performed. aP < 0.05, bP < 0.01, cP < 0.001, and dP < 0.0001. TGFβ: Transforming growth factor β; TGFβR: Transforming growth factor β receptor; DHE: Dihydroergotamine.
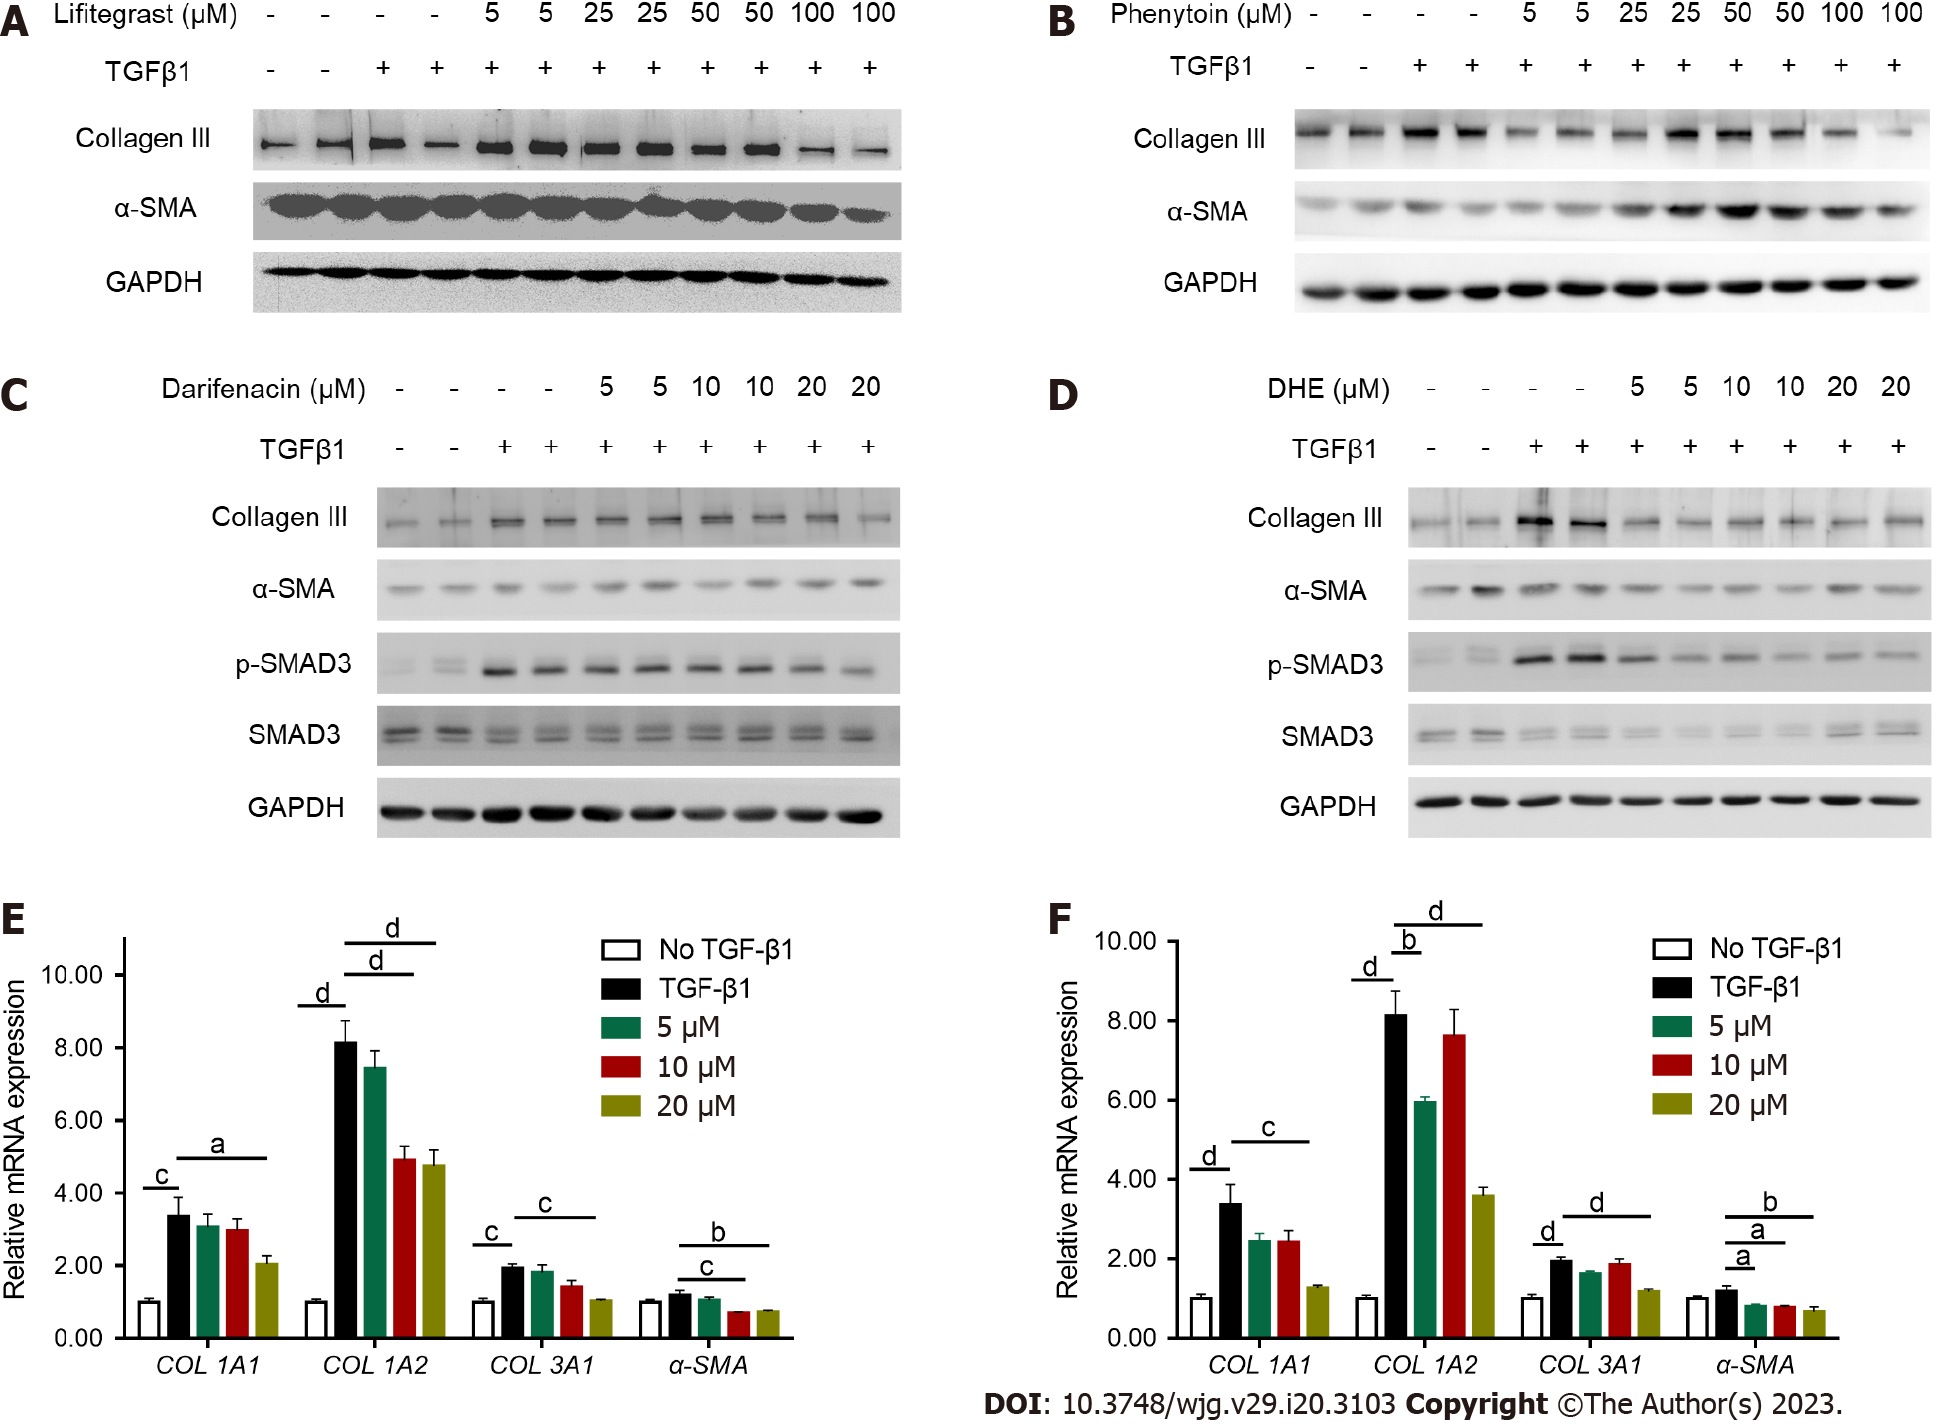
Figure 2 Treatment inhibiting the activation of LX-2 cells.
A and B: After LX-2 cell was activated with transforming growth factor β 1 (TGFβ1) (5 ng/mL) for 24 h, different concentrations of lifitegrast and phenytoin were added for 24 h, and the protein levels of collagen III and α-SMA were detected by western blot; C and D: After LX-2 was activated with TGFβ1 (5 ng/mL) for 24 h, different concentrations of darifenacin and dihydroergotamine (DHE) were added for further treatment for 24 h, and the protein levels of collagen III, α-SMA, and p-SMAD3 were detected by western blot; E: Real-time polymerase chain reaction (RT-PCR) was performed to detect the expression of COL1A1, COL1A2, COL3A1, and α-SMA of LX-2 after different concentrations of darifenacin treatment (n = 6); F: RT-PCR was performed to detect the expression of COL1A1, COL1A2, COL3A1, and α-SMA of LX-2 after different concentrations of DHE treatment (n = 5-6). All data are presented as means ± standard error of the mean. One-way ANOVA test was performed. aP < 0.05, bP < 0.01, cP < 0.001, and dP < 0.0001. TGFβ: Transforming growth factor β; TGFβR: Transforming growth factor β receptor; DHE: Dihydroergotamine.
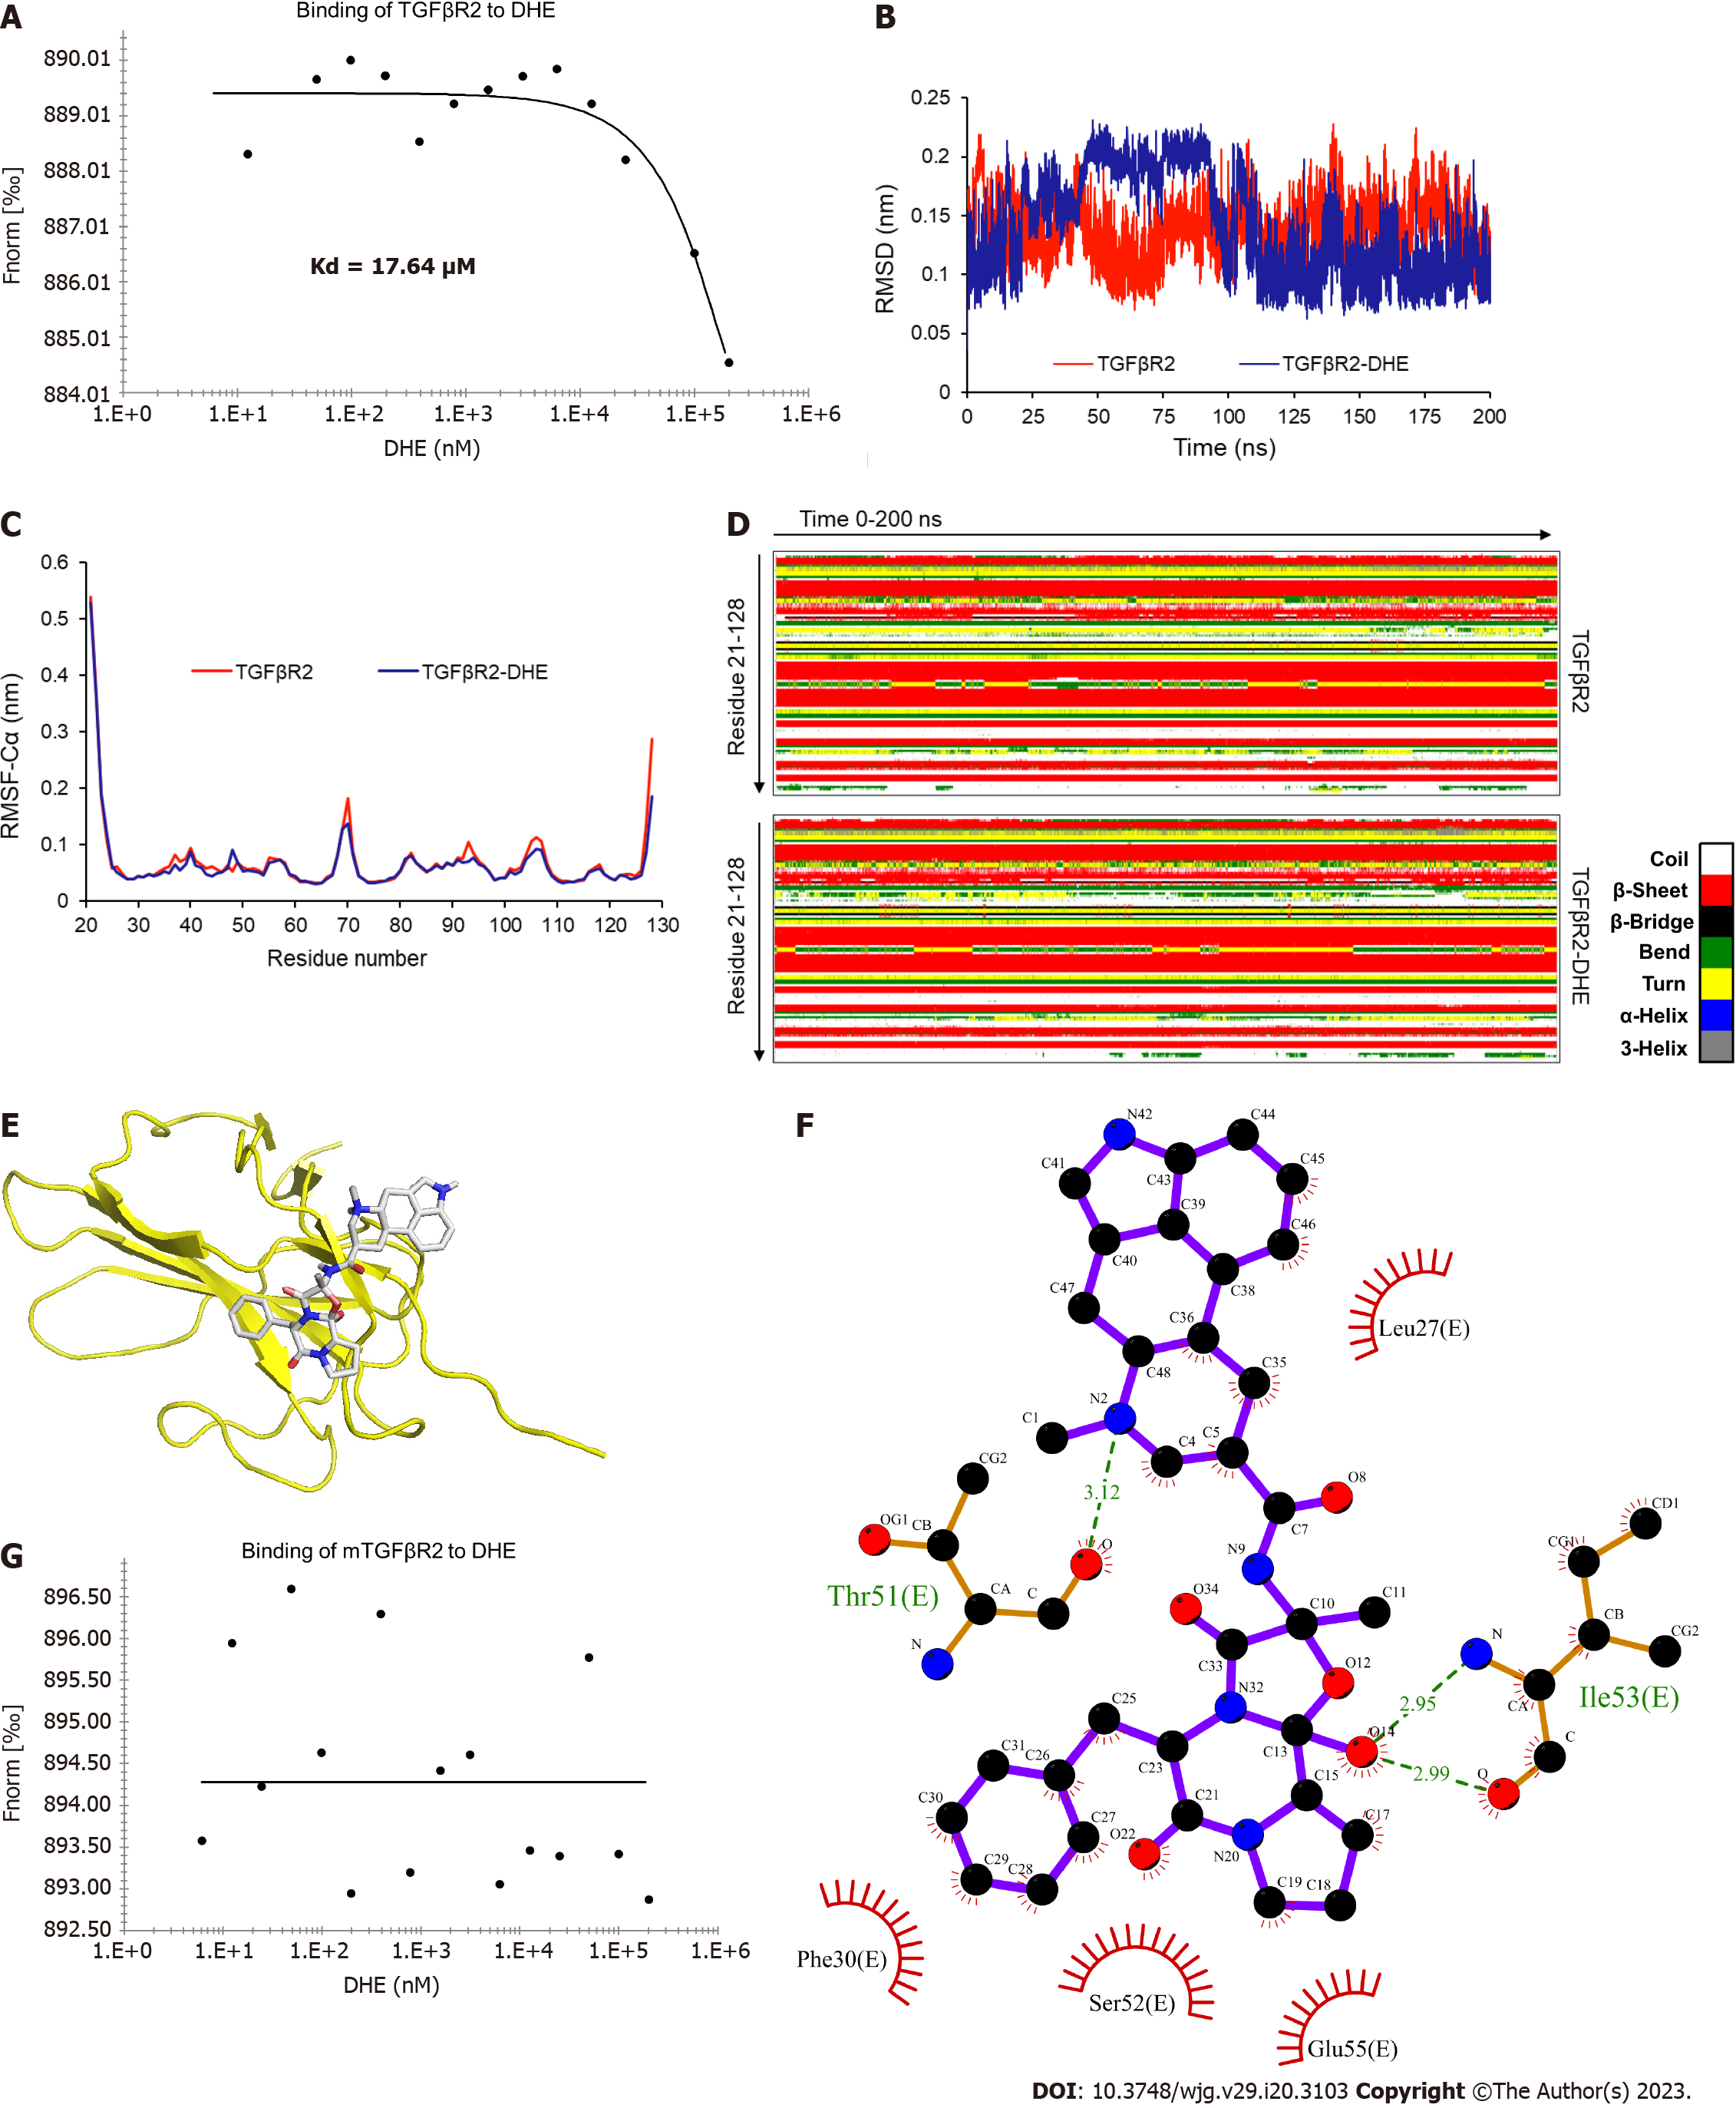
Figure 3 The binding affinity and sites of dihydroergotamine and transforming growth factor β type II receptor.
A: Transforming growth factor β type II receptor (TGFβR2) bound to dihydroergotamine (DHE) with a Kd of 17.64 μM; B: Molecular dynamics simulation results of DHE and TGFβR2. Root-mean-square deviation of TGFβR2 skeleton atom; C: Root-mean-square fluctuation of backbone Cα atoms of TGFβR2 skeleton atom; D: The secondary structure components of TGFβR2 and complex simulation systems in 0-200 ns; E and F: The binding sites of DHE and TGFβR2; G: The binding affinity of TGFβR2 mutants with DHE. TGFβ: Transforming growth factor β; TGFβR: Transforming growth factor β receptor; DHE: Dihydroergotamine.
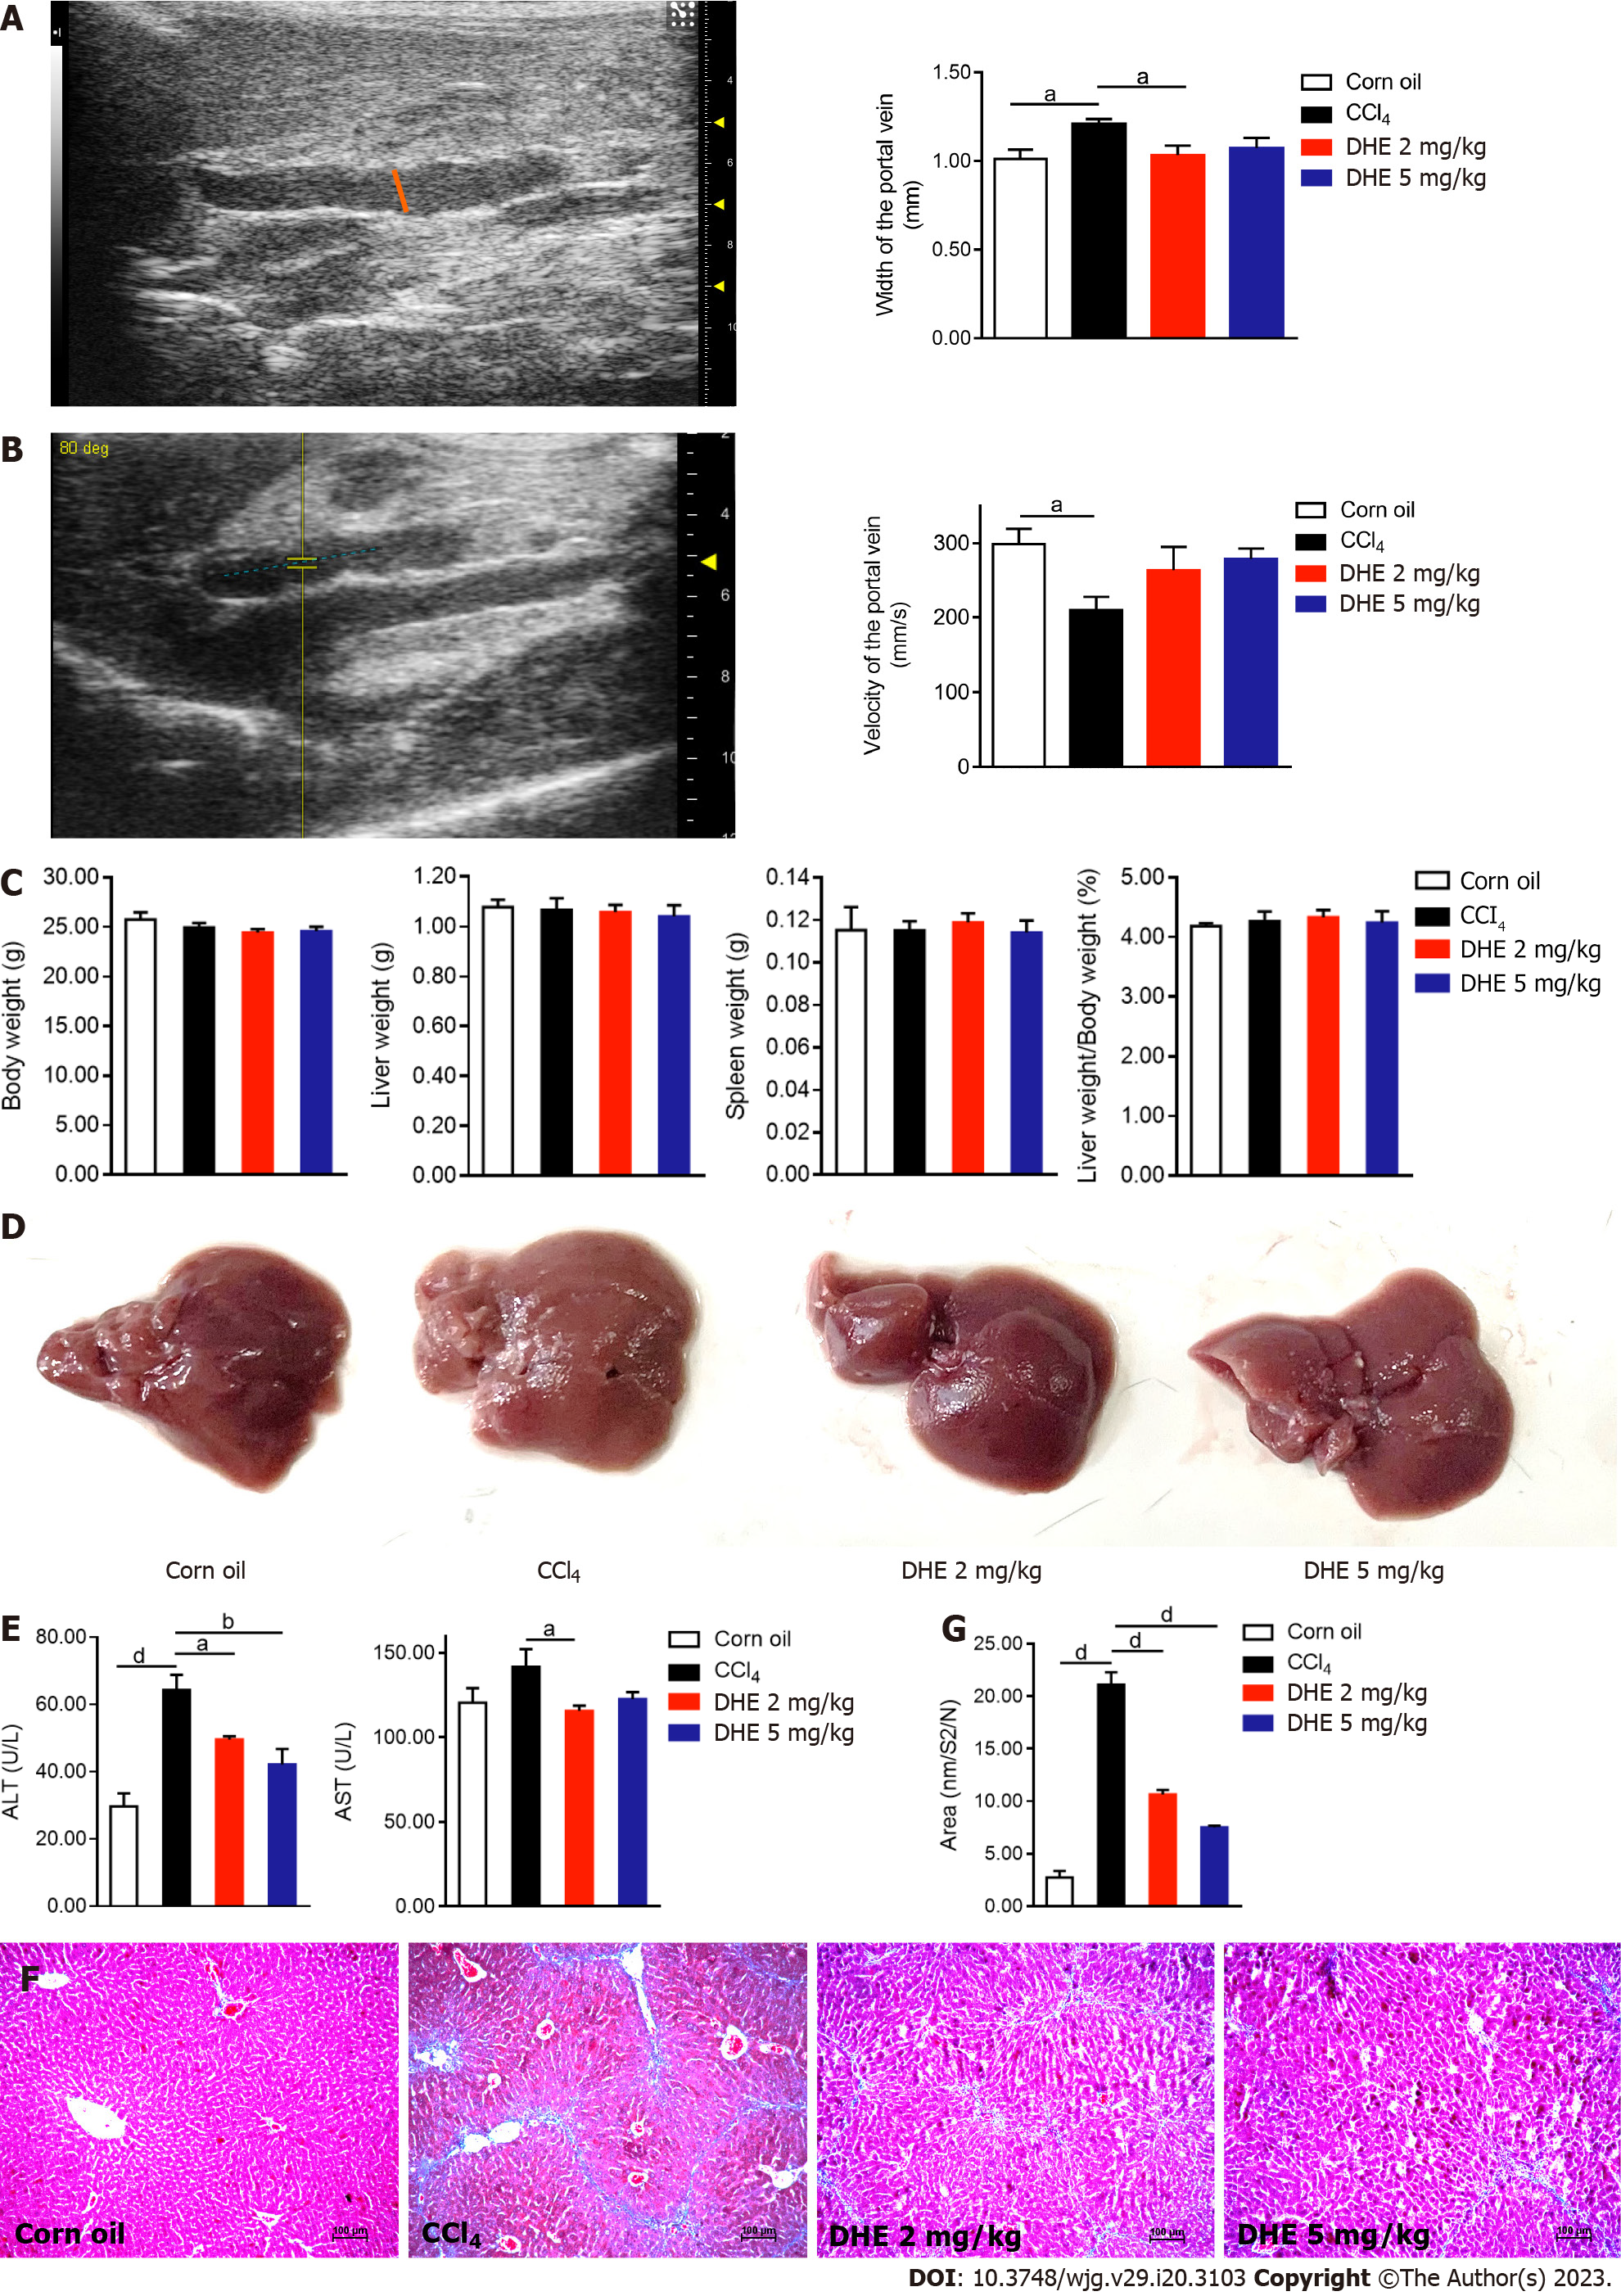
Figure 4 Dihydroergotamine alleviated fibrosis in CCl4-induced liver fibrosis model mice.
A: The width of the portal vein (left panel); portal vein width of mice in each group (right panel, n = 7); B: The velocity of the portal vein (left panel); the velocity of mice in each group (right panel, n = 7); C: Body weight, liver weight, spleen weight, and liver weight/body weight of mice in each group (n = 6-8); D: Gross liver specimens of the mice in each group; E: An automated biochemistry analyzer determined the enzymatic activities of serum levels of alanine aminotransferase and aspartate aminotransferase (n = 6-7); F: Masson’s trichrome staining was performed on liver sections; G: Collagen area in Masson’s trichrome staining (n = 7-8). All data were presented as means ± standard error of the mean. One-way ANOVA test was performed. aP < 0.05, bP < 0.01, cP < 0.001, and dP < 0.0001. TGFβ: Transforming growth factor β; TGFβR: Transforming growth factor β receptor; DHE: Dihydroergotamine.
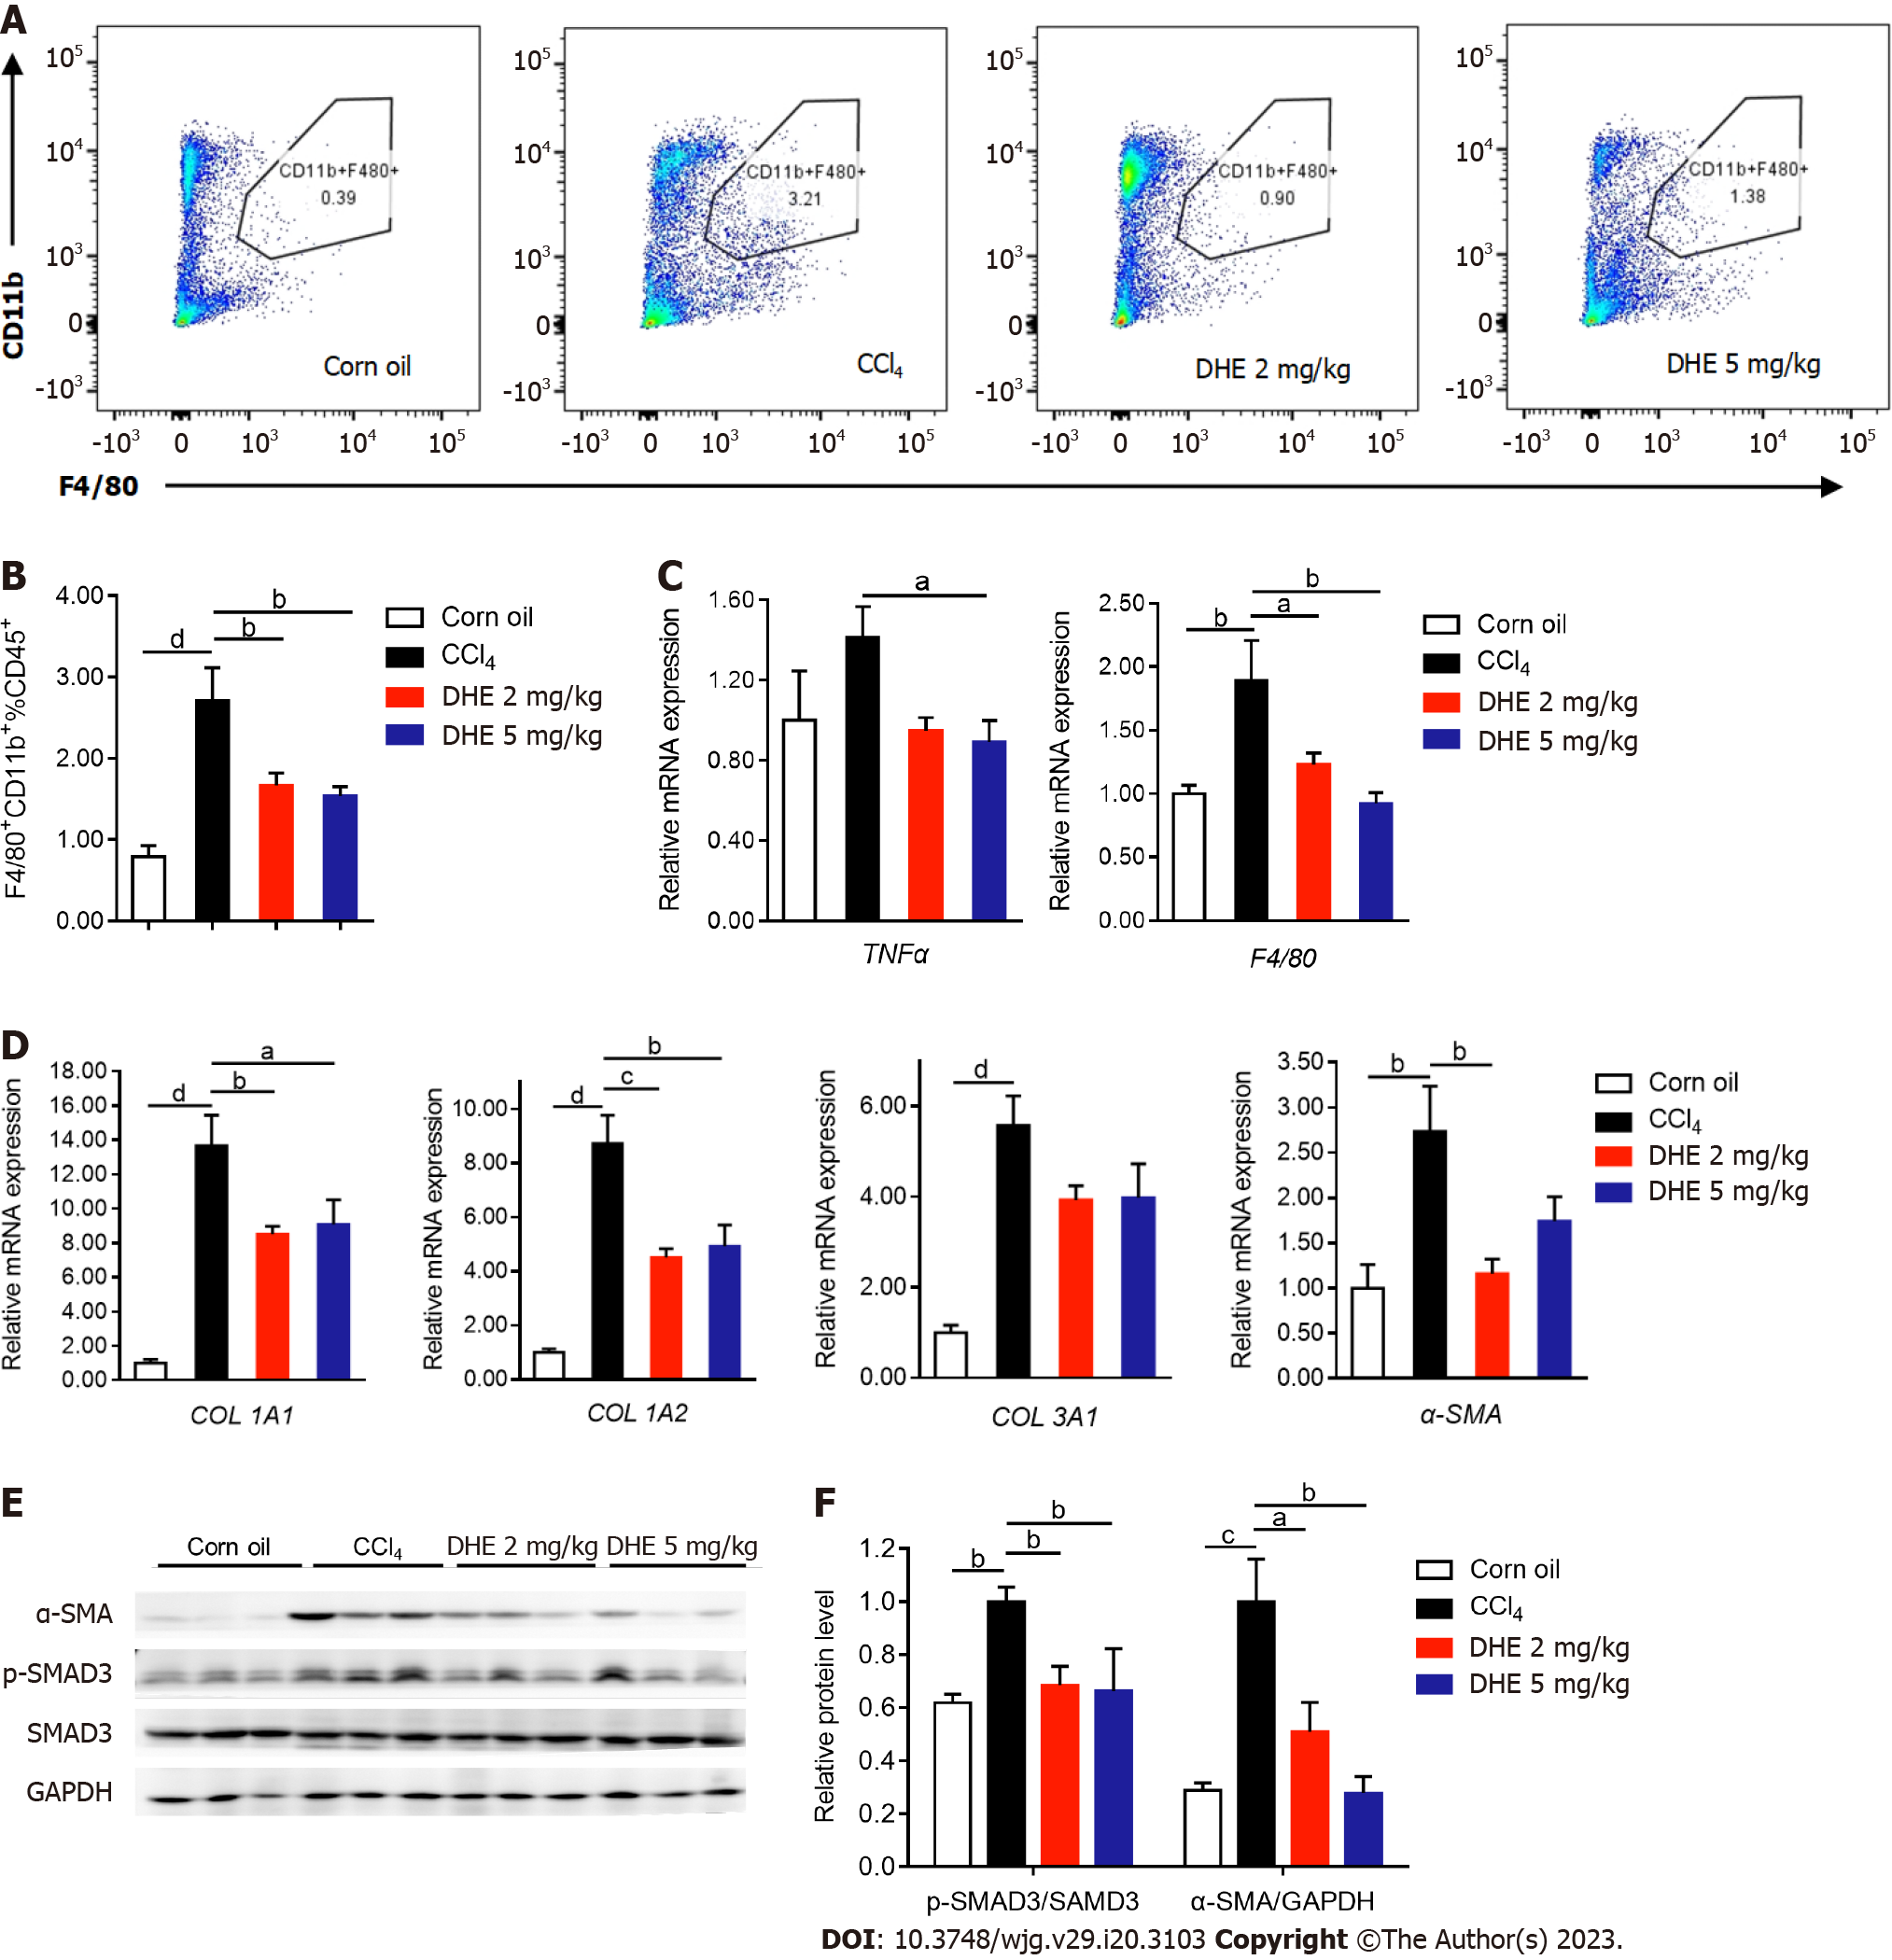
Figure 5 Dihydroergotamine decreased the inflammatory infiltration of macrophages and extracellular matrix deposition in the liver.
A and B: The flow cytometric analysis of CD11b+ cells (n = 6-8); C: The effects of dihydroergotamine (DHE) treatment on the mRNA expression levels of inflammation-related genes (n = 6-8); D: The effects of DHE treatment on the mRNA expression levels of extracellular matrix-related genes (n = 6-8); E: The protein levels of p-SMAD3 and α-SMA in liver tissues of mice in each group were detected by western blot (n = 3). All data are presented as means ± standard error of the mean. One-way ANOVA test was performed. aP < 0.05, bP < 0.01, cP < 0.001, and dP < 0.0001. TGFβ: Transforming growth factor β; TGFβR: Transforming growth factor β receptor; DHE: Dihydroergotamine.
- Citation: Zheng KX, Yuan SL, Dong M, Zhang HL, Jiang XX, Yan CL, Ye RC, Zhou HQ, Chen L, Jiang R, Cheng ZY, Zhang Z, Wang Q, Jin WZ, Xie W. Dihydroergotamine ameliorates liver fibrosis by targeting transforming growth factor β type II receptor. World J Gastroenterol 2023; 29(20): 3103-3118
- URL: https://www.wjgnet.com/1007-9327/full/v29/i20/3103.htm
- DOI: https://dx.doi.org/10.3748/wjg.v29.i20.3103


