Copyright
©The Author(s) 2023.
World J Gastroenterol. May 28, 2023; 29(20): 3084-3102
Published online May 28, 2023. doi: 10.3748/wjg.v29.i20.3084
Published online May 28, 2023. doi: 10.3748/wjg.v29.i20.3084
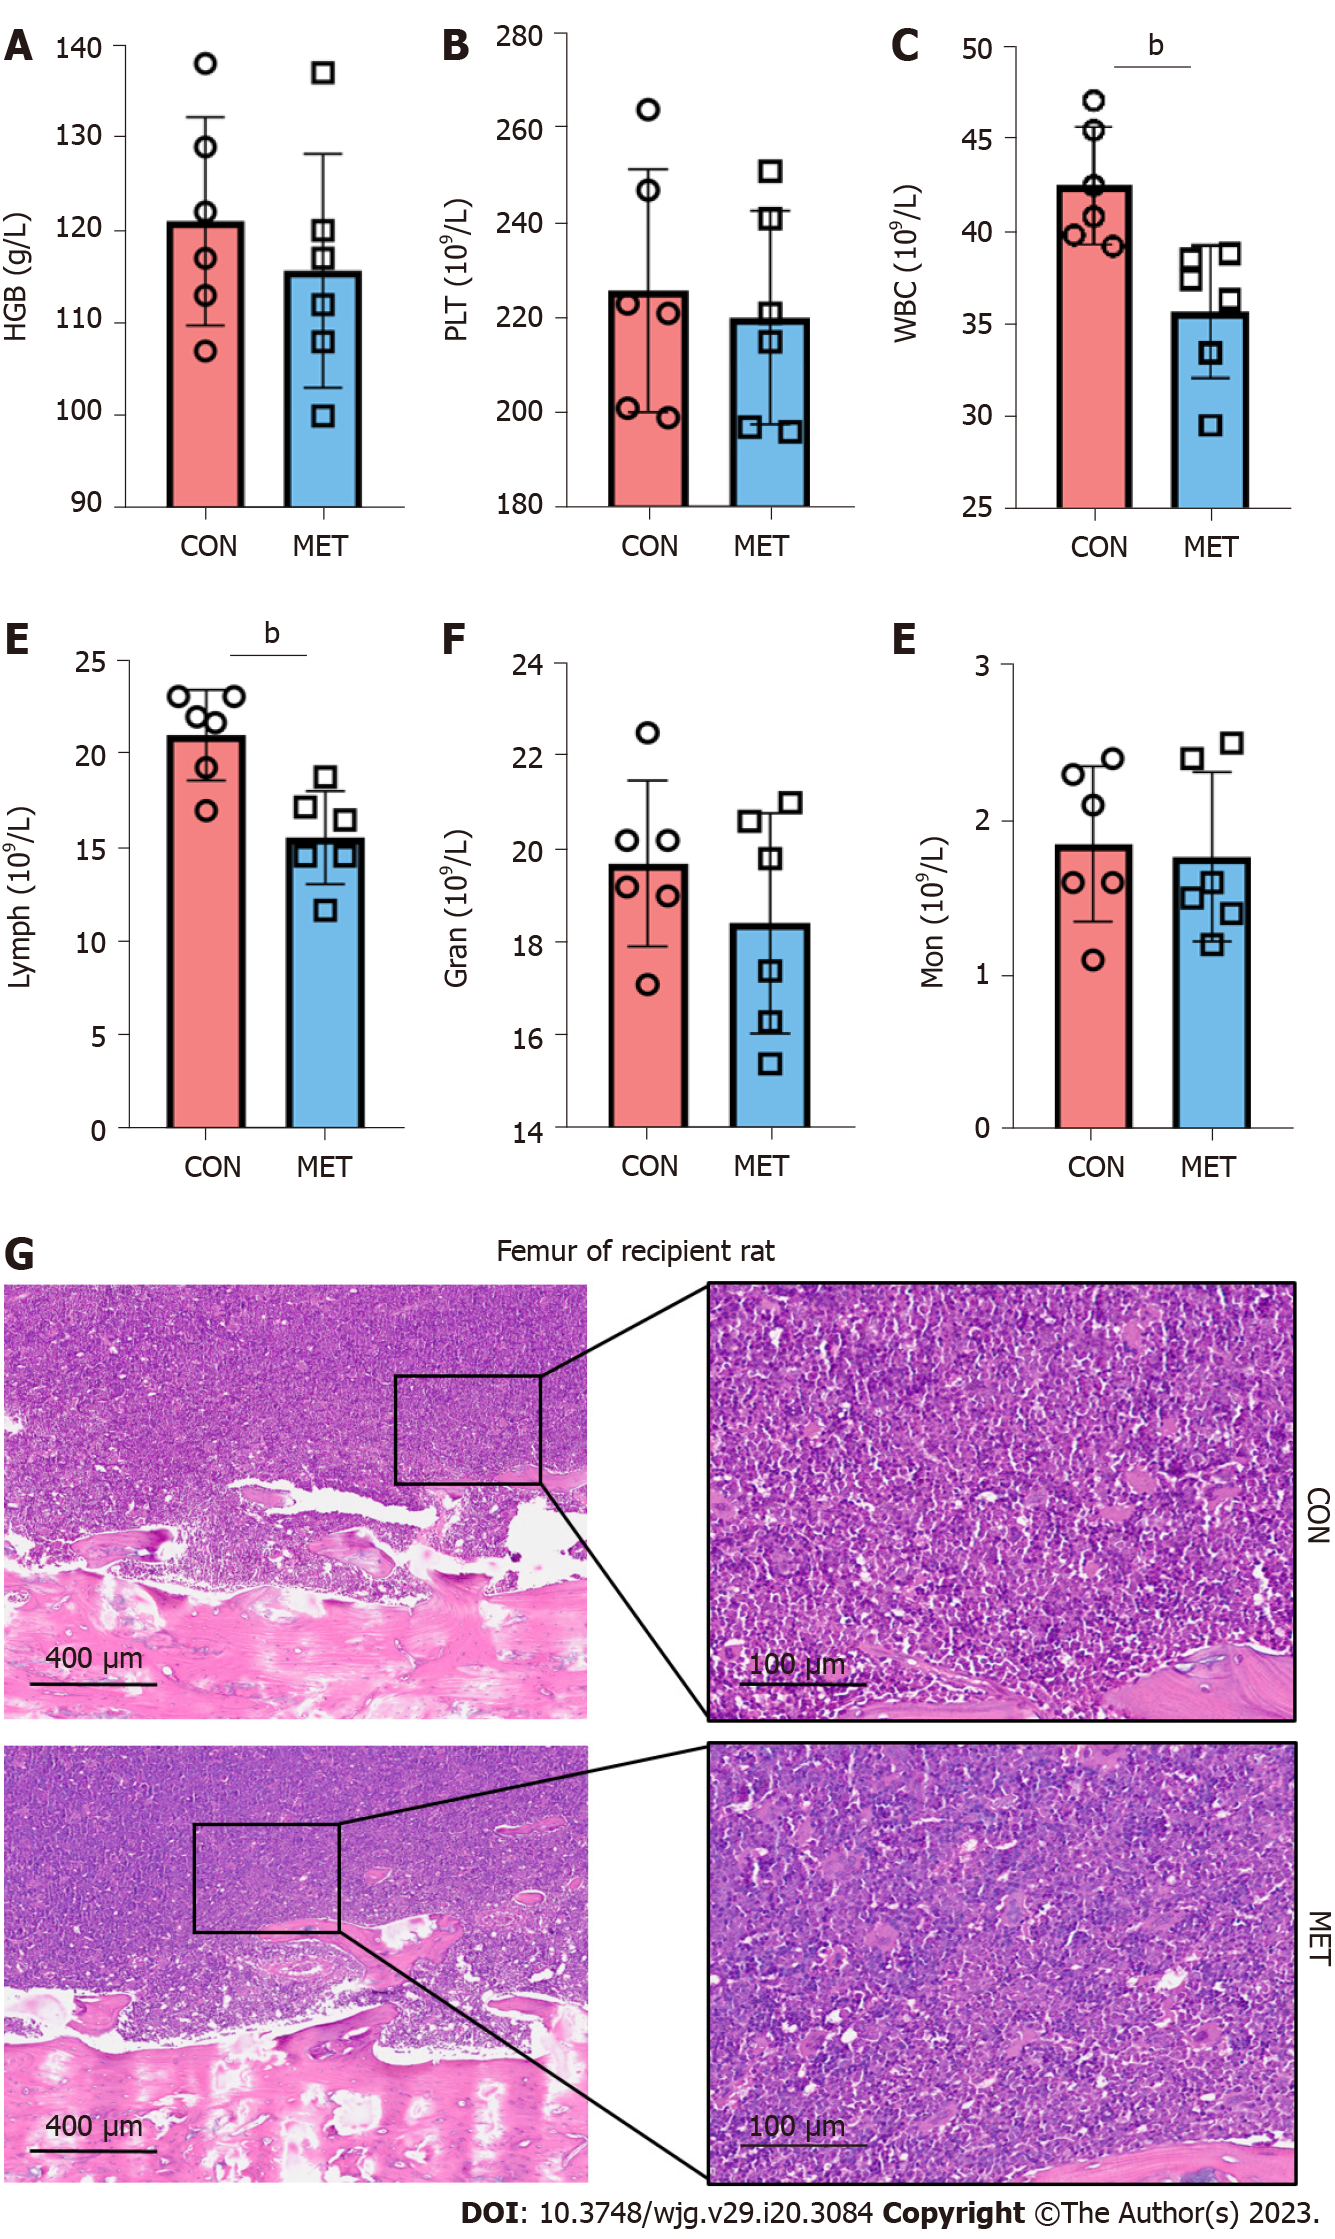
Figure 1 Metronomic capecitabine showed no significant myelosuppression.
A and B: Hemoglobin level and platelets count in the peripheral blood; C-F: White blood cells, lymphocytes, granulocytes, and monocytes counts in the peripheral blood; G: Bone marrow tissue was stained with hematoxylin and eosin (50 × and 200 ×). Statistical analysis was done by unpaired t-test, n = 6. Data are shown as mean ± SD; bP < 0.01 vs the control group. CON: Untreated control groups, rats received 0.9% normal saline for 7 d; MET: Metronomic capecitabine (CAP)-treated groups, rats received metronomic CAP (100 mg/kg/d) treated for 7 d; HGB: Hemoglobin; PLT: Platelets; WBC: White blood cells; lymph: Lymphocytes; Gran: Granulocytes; Mon: Monocytes.
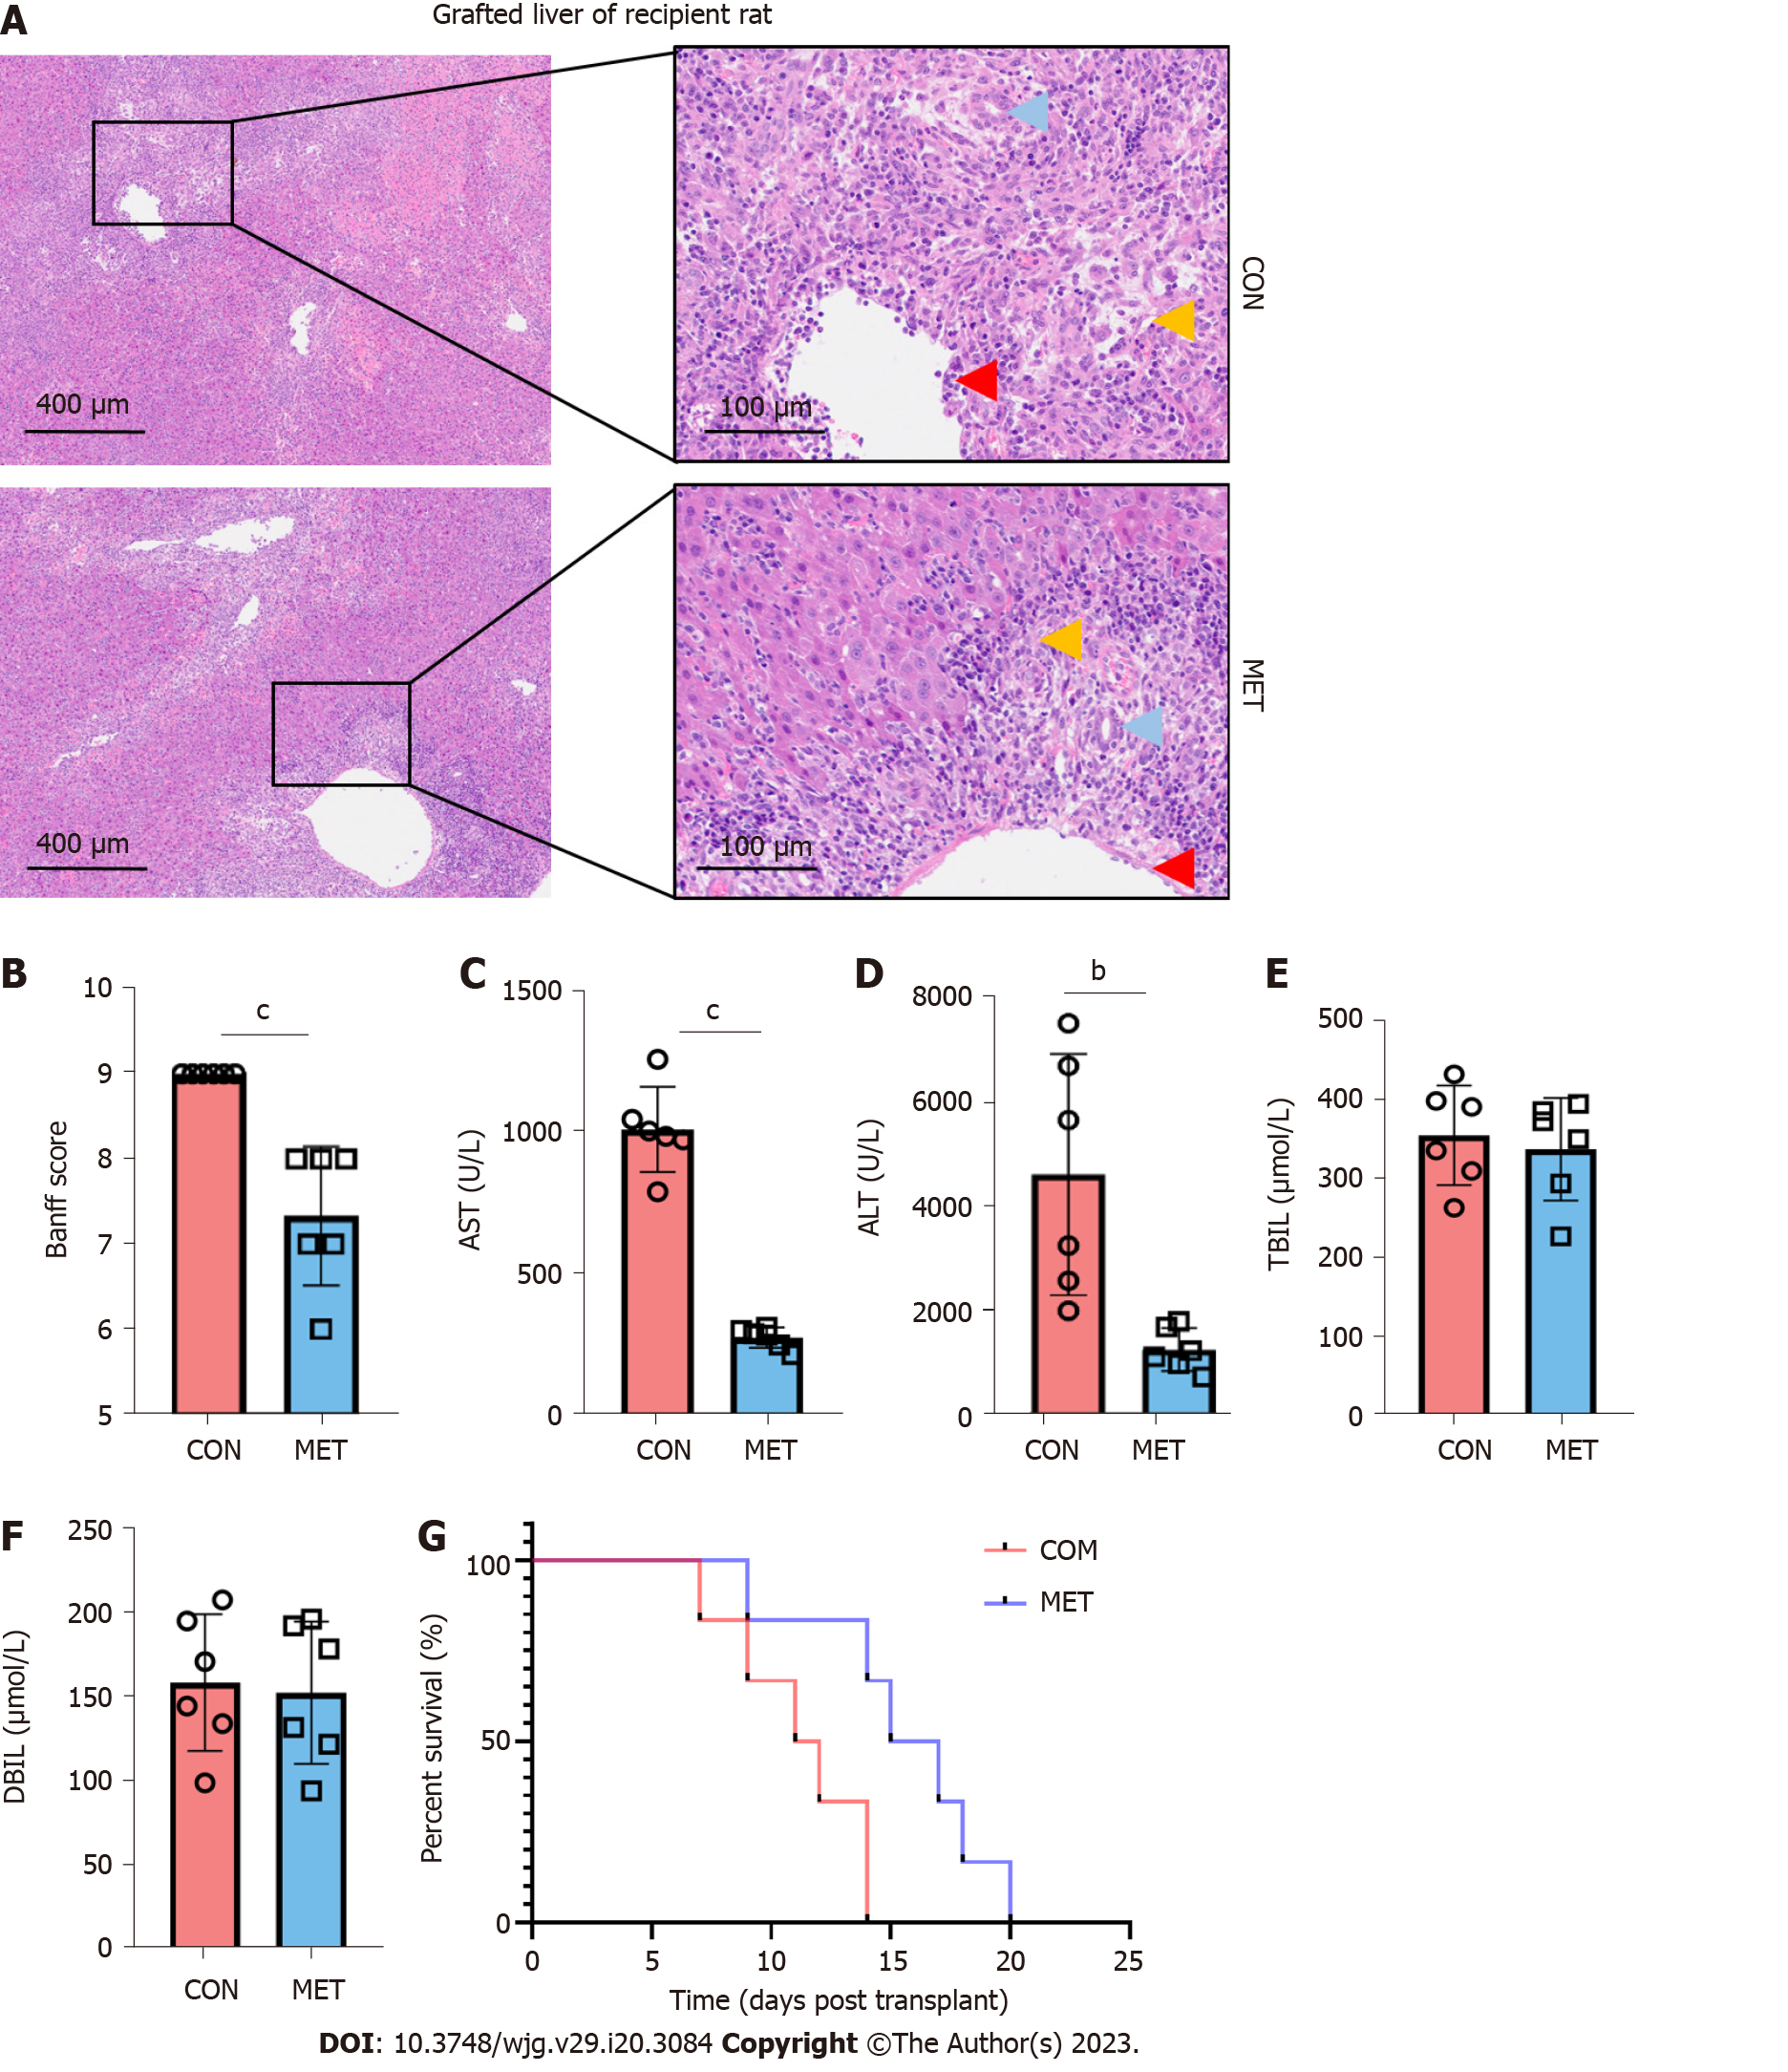
Figure 2 Metronomic capecitabine improves liver function and ameliorates liver allograft rejection.
A: Liver allograft tissue was stained with hematoxylin and eosin (50 × and 200 ×). Liver tissue, portal vein, and bile duct were significantly injured in the untreated control group (CON), with a large number of inflammatory cells infiltrated. In the metronomic capecitabine-treated groups (MET), liver tissue destruction was relatively mild, with limited infiltration of inflammatory cells (yellow arrows), relatively little degeneration of portal vein endothelium (red arrows), and bile duct epithelium (blue arrows); B: The severity of acute rejection was graded according to the Banff liver rejection criteria; C-F: Alanine transaminase, aspartate transaminase, total bilirubin, and direct bilirubin levels in the peripheral blood; G: Survival analysis of rats after liver transplantation. The median survival time of the CON and MET groups were 11.5 d and 16 d, respectively (P < 0.01). The survival analysis was done by log-rank (Mantel Cox) test, n = 6. Statistical analysis was done by unpaired t-test, n = 6. Data are shown as mean ± SD; bP < 0.01 vs the control group, cP < 0.001 vs the control group. CON: Untreated control groups, rats received 0.9% normal saline for 7 d; MET: Metronomic capecitabine (CAP)-treated groups, rats received metronomic CAP (100 mg/kg/d) treated for 7 d; ALT: Alanine transaminase; AST: Aspartate transaminase; TBIL: Total bilirubin; DBIL: Direct bilirubin.
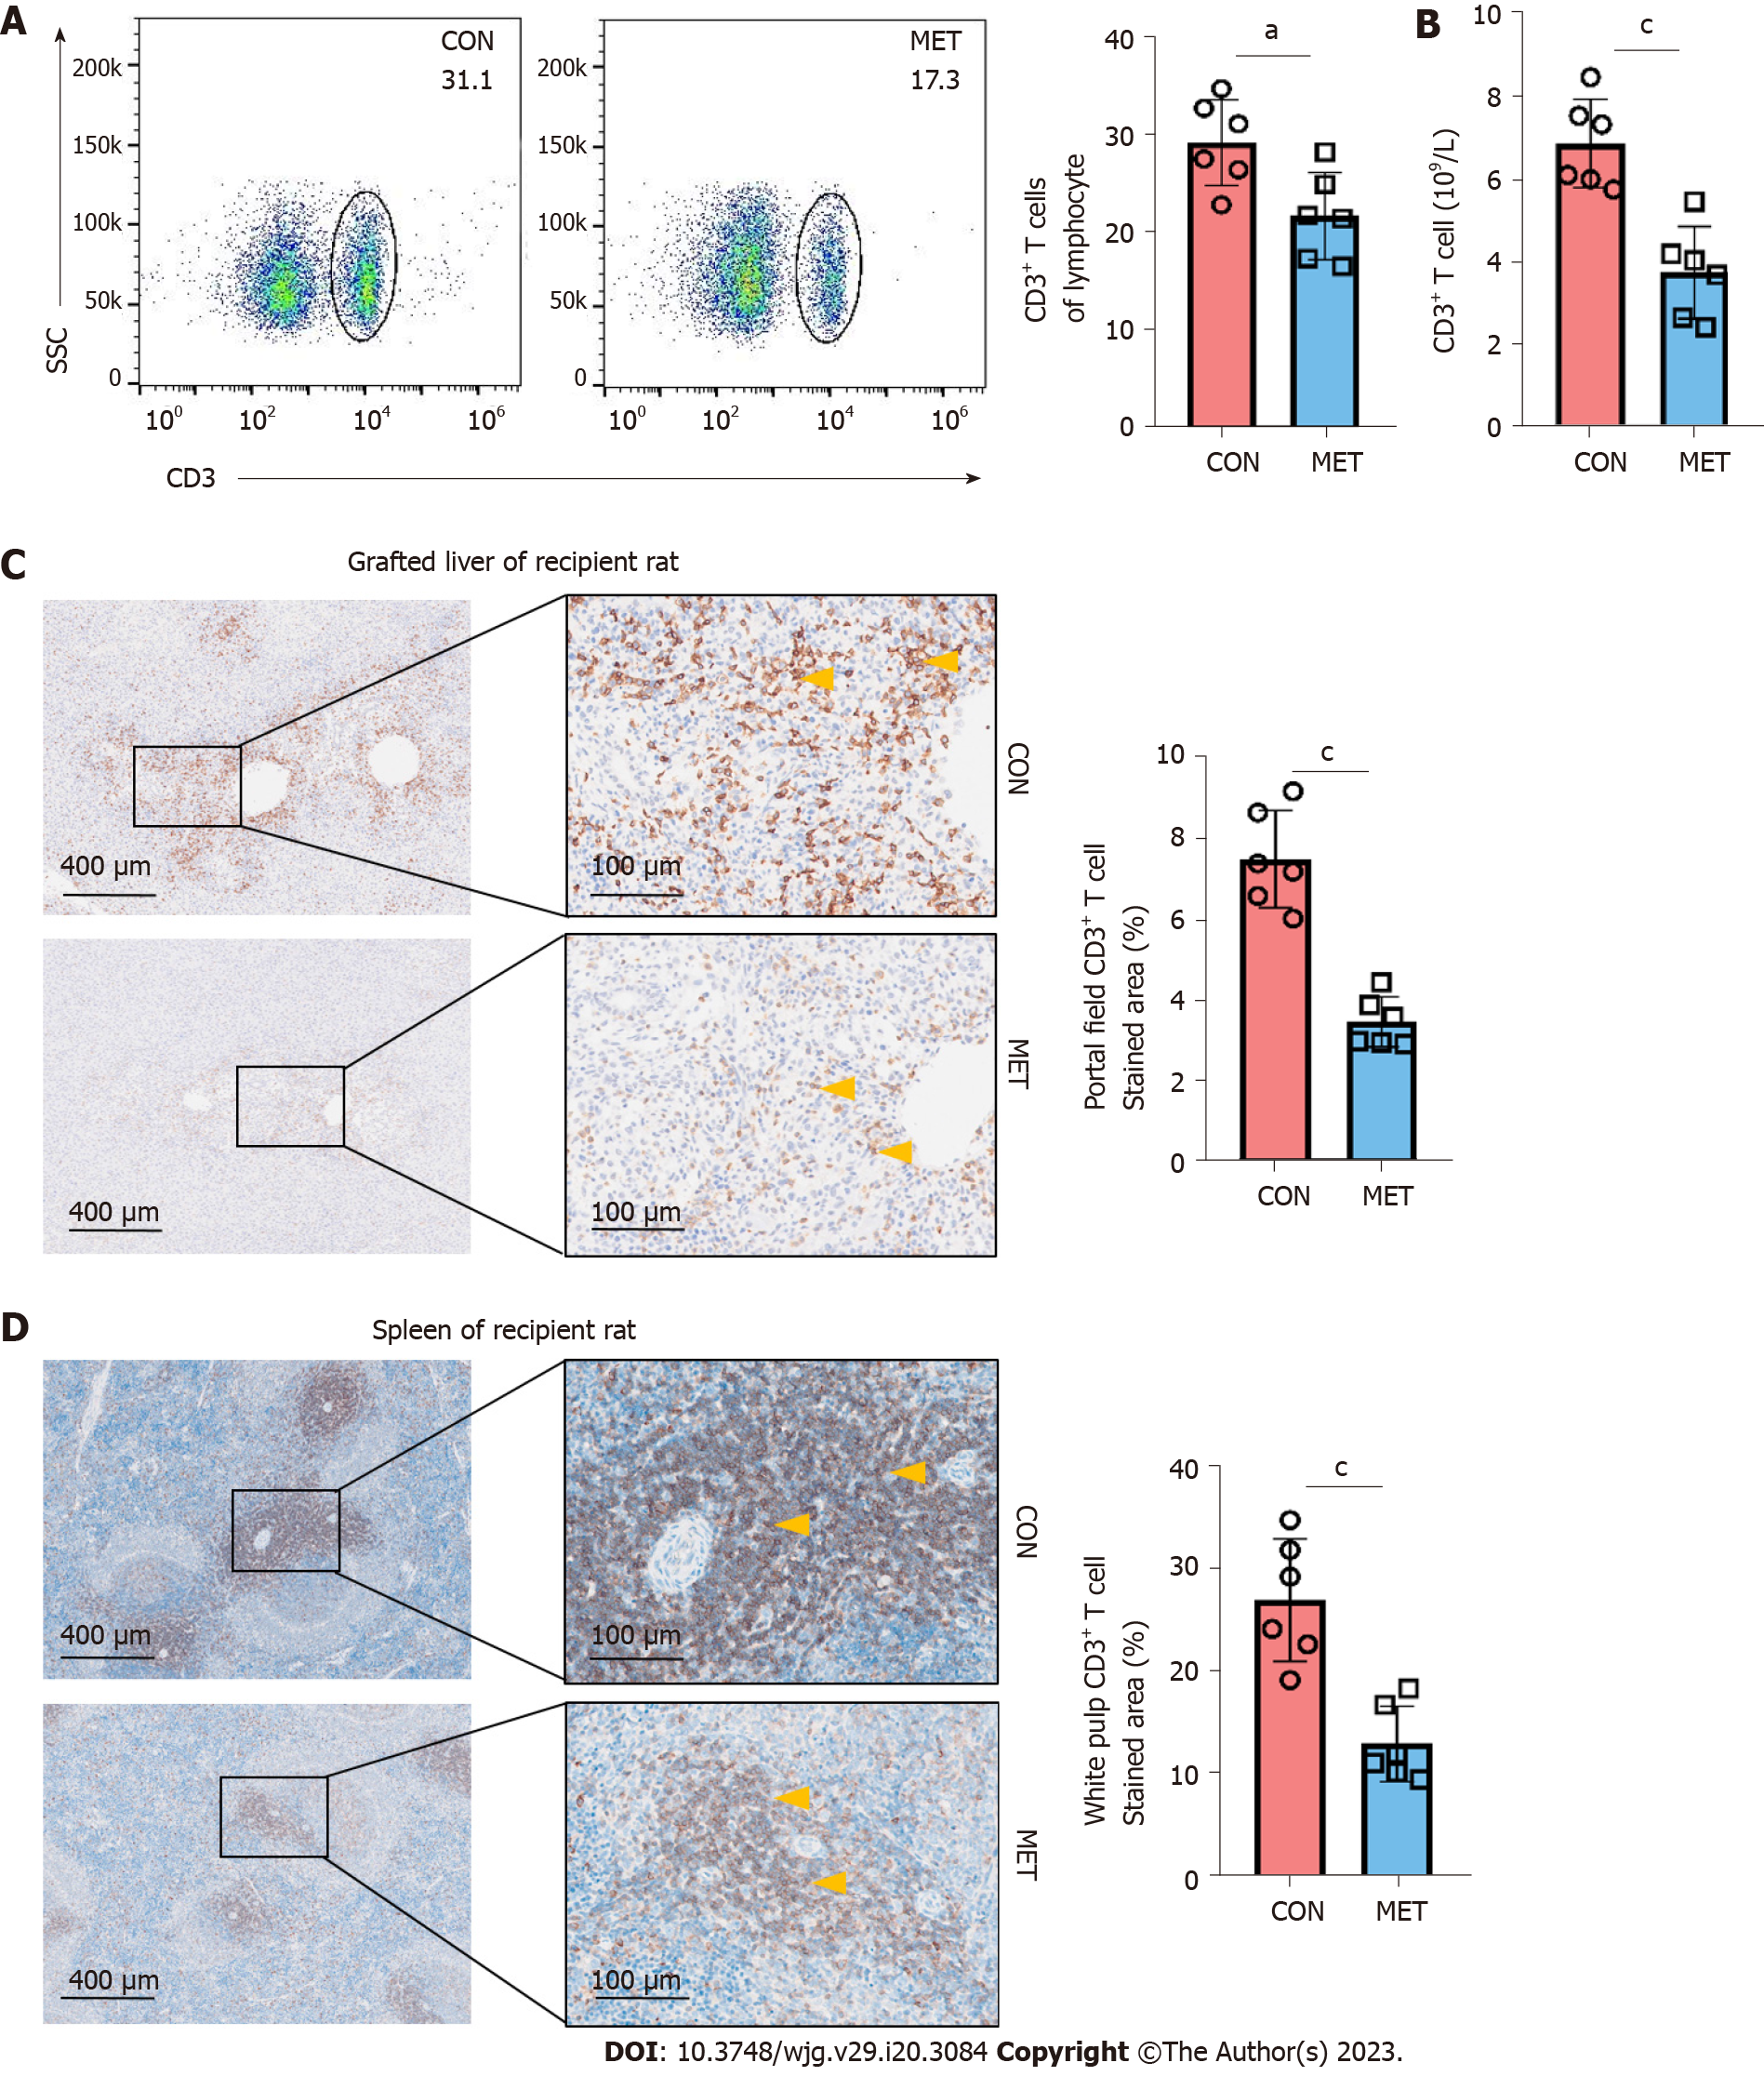
Figure 3 Metronomic capecitabine decreased the infiltration of CD3+ T cells in peripheral blood, liver allografts, and spleen.
A: The percentage of CD3+ T cells among lymphocytes in the peripheral blood at postoperative day 7; B: The number of CD3+ T cells in the peripheral blood at postoperative day 7; C and D: Grafted liver (C) and spleen (D) sections were stained for CD3. The samples from each group were collected on postoperative day 7. The arrows show positive staining (50 × and 200 ×). Quantification of the proportion of CD3+ positive area within a given section (%). Statistical analysis was done by unpaired t-test, n = 6. Data are shown as mean ± SD; aP < 0.05 vs the control group, cP < 0.001 vs the control group. CON: Untreated control groups, rats received 0.9% normal saline for 7 d; MET: Metronomic capecitabine (CAP)-treated groups, rats received metronomic CAP (100 mg/kg/d) treated for 7 d.
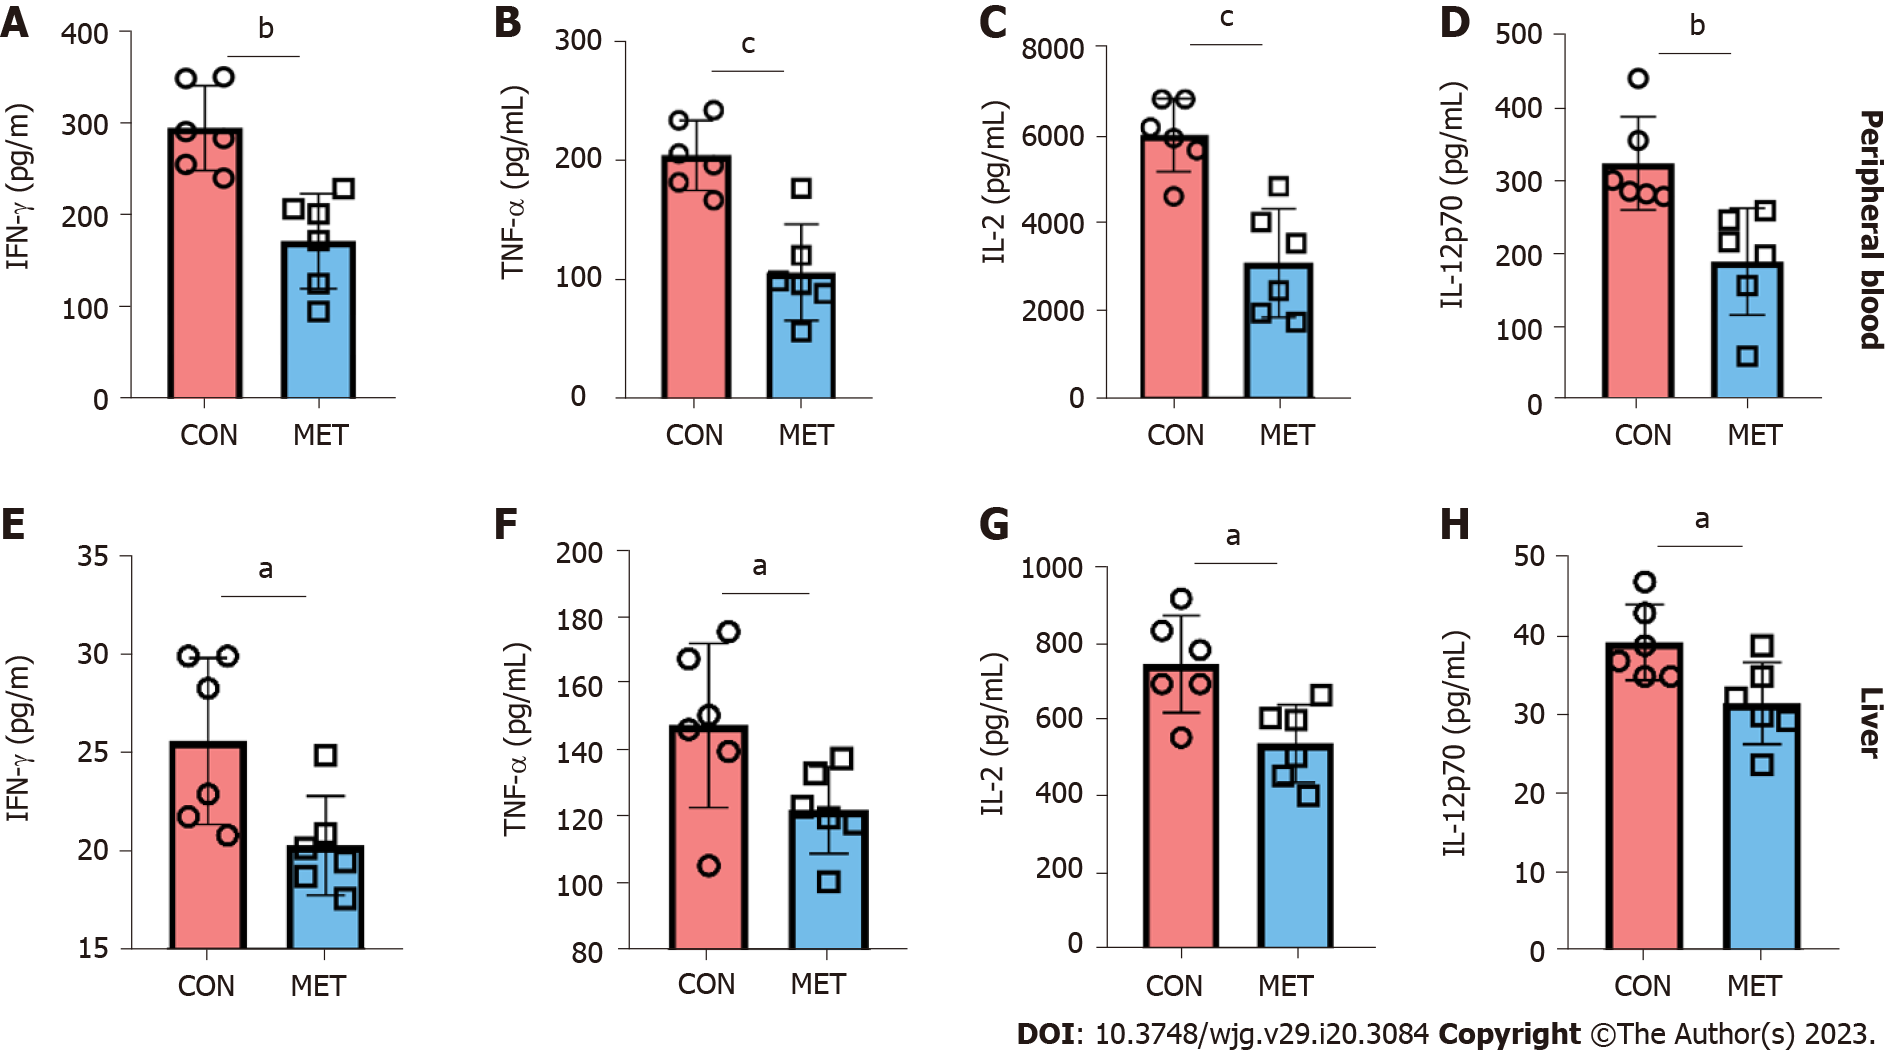
Figure 4 Cytokine concentrations of peripheral blood and liver graft in transplanted rats.
Use Luminex assay to detect the concentrations of interferon gamma (IFN-γ), tumor necrosis factor alpha (TNF-α), interleukin (IL)-2 and IL-12 in peripheral blood and graft. A and E: IFN-γ; B and F: TNF-α; C and G: IL-2; D and H: IL-12. Statistical analysis was done by unpaired Students t-test, n = 6. Data are shown as mean ± SD; aP < 0.05 vs the control group, bP < 0.01 vs the control group, cP < 0.001 vs the control group. CON: Untreated control groups, rats received 0.9% normal saline for 7 d; MET: Metronomic capecitabine (CAP)-treated groups, rats received metronomic CAP (100 mg/kg/d) treated for 7 d; IFN-γ: Interferon gamma; TNF-α: Tumor necrosis factor alpha; IL: Interleukin.
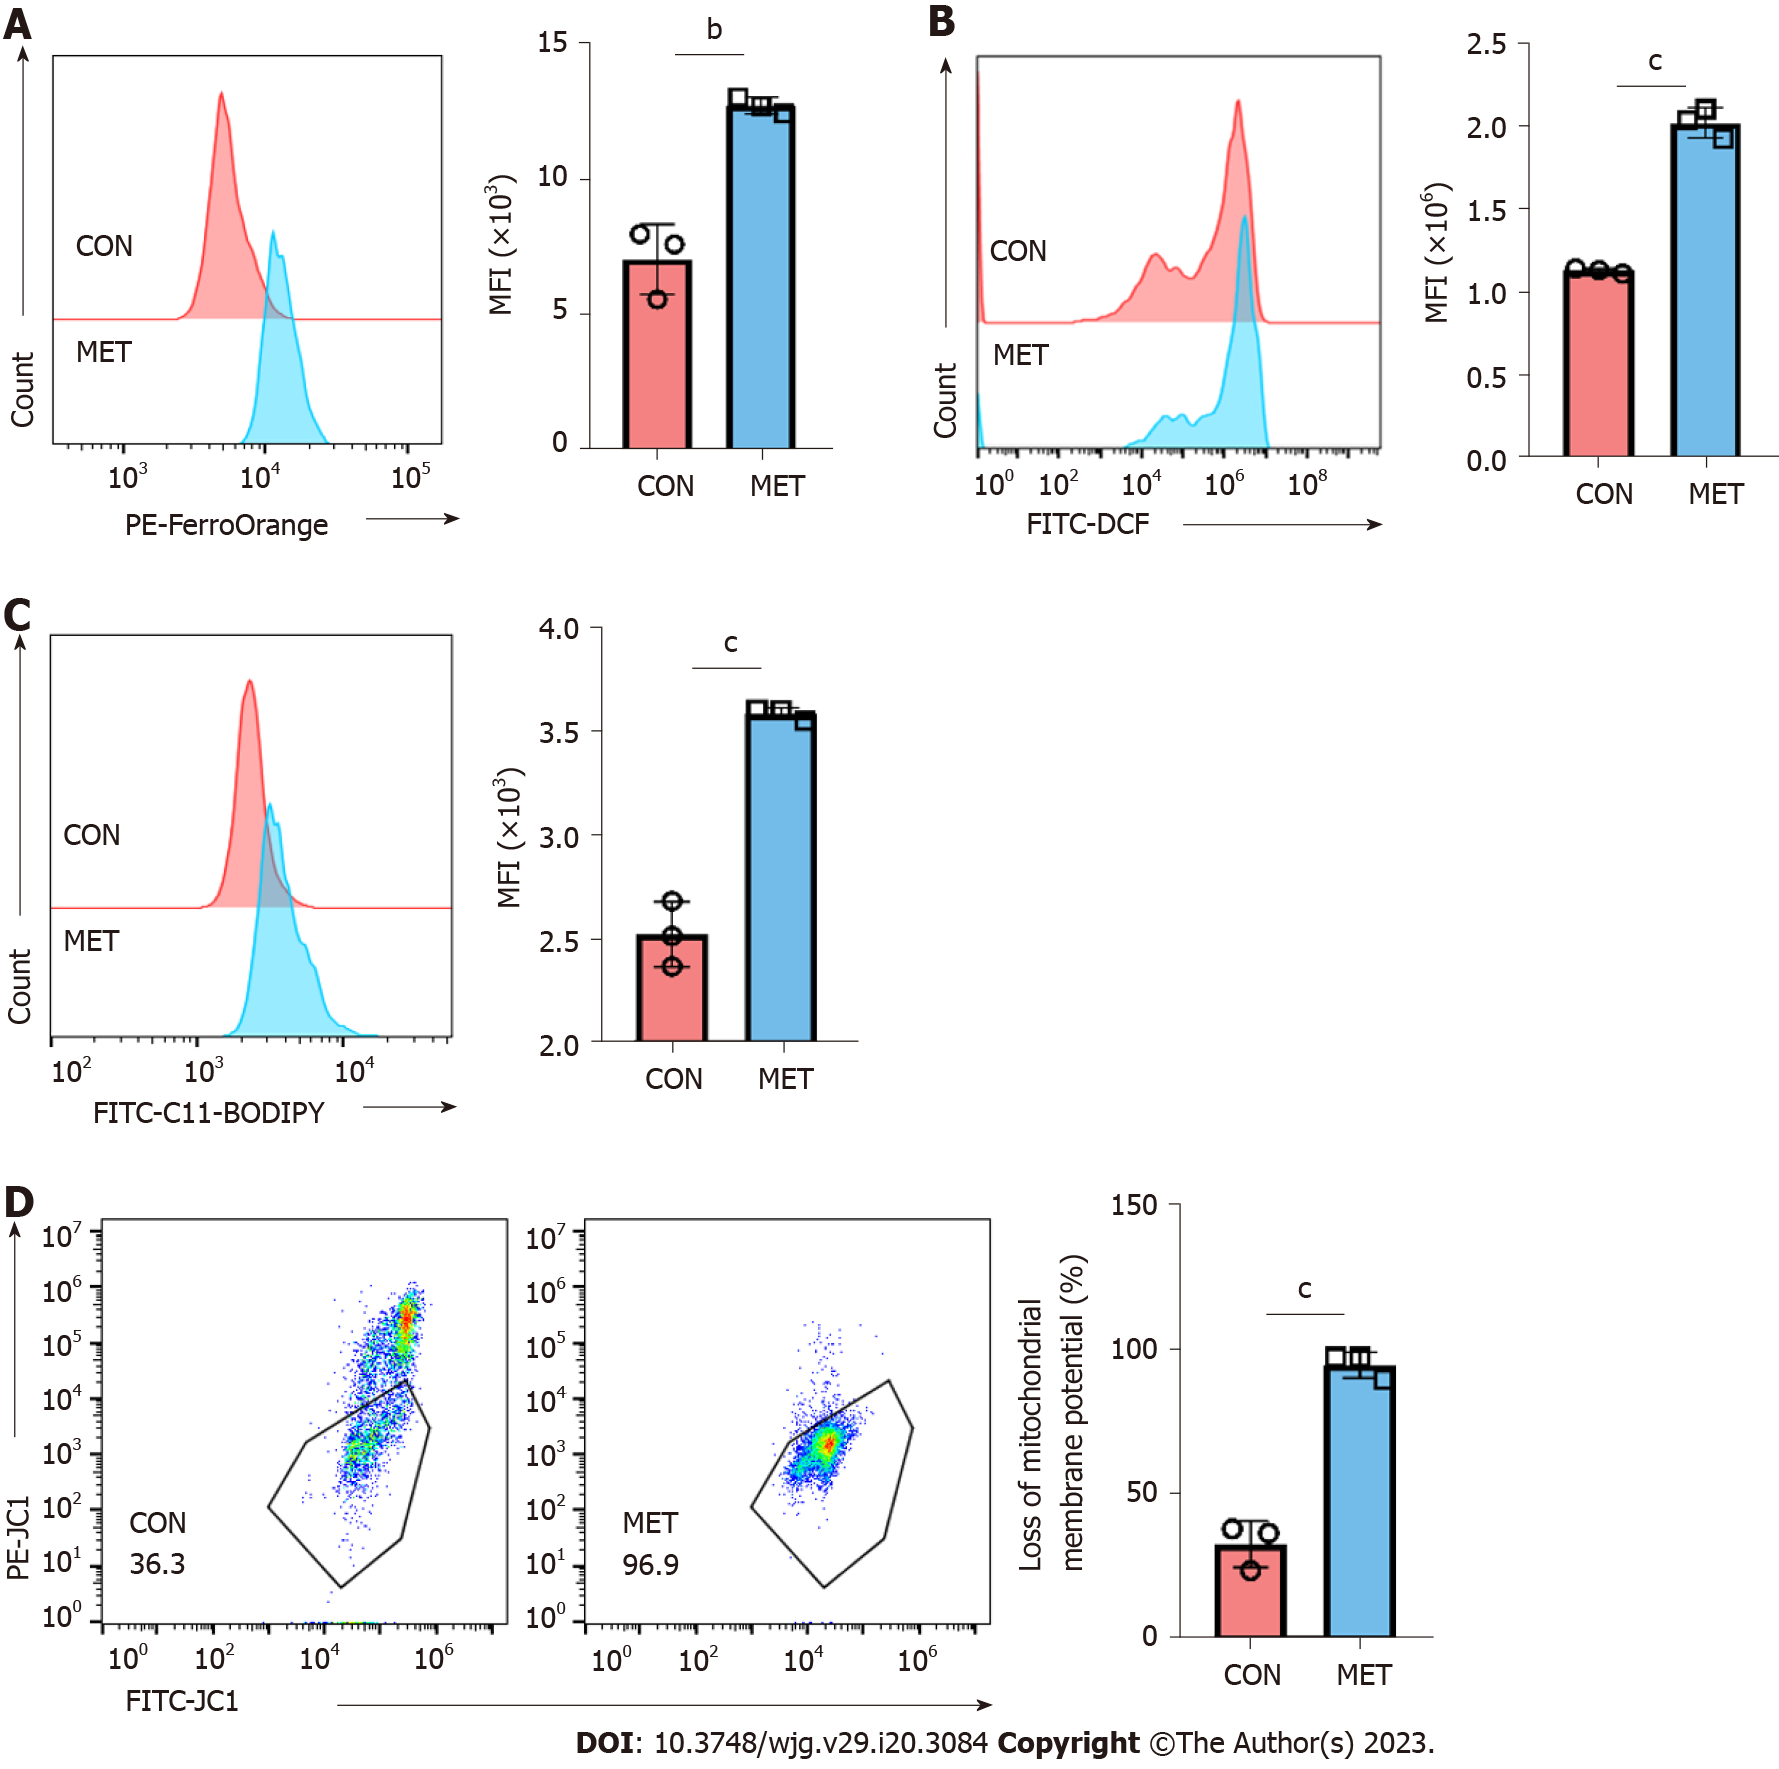
Figure 5 Metronomic capecitabine caused the increase of free ferrous ions and oxidative stress in peripheral blood CD3+ T cells of transplanted rats.
A: Representative FACS data showing differential FerroOrange staining reflecting different cytoplasmic labile iron concentrations in control groups and metronomic capecitabine-treated rats, followed by statistical analysis of mean fluorescence intensity (MFI); B and C: Reactive oxygen species (ROS) and lipid ROS detected by FACS using DCFH-DA and C11-BODIPY respectively, BODIPY emission was recorded on oxidized C11 (FITC channel) signal. The graph shows the statistical analysis of differential MFIs in the two groups; D: The proportion of cells with reduced mitochondrial membrane potential was assessed by flow cytometry. Statistical analysis was done by unpaired t-test, n = 3. Data are shown as mean ± SD; bP < 0.01 vs the control group, cP < 0.001 vs the control group. CON: Untreated control groups, rats received 0.9% normal saline for 7 d; MET: Metronomic capecitabine (CAP)-treated groups, rats received metronomic CAP (100 mg/kg/d) treated for 7 d; MFI: Mean fluorescence intensity.
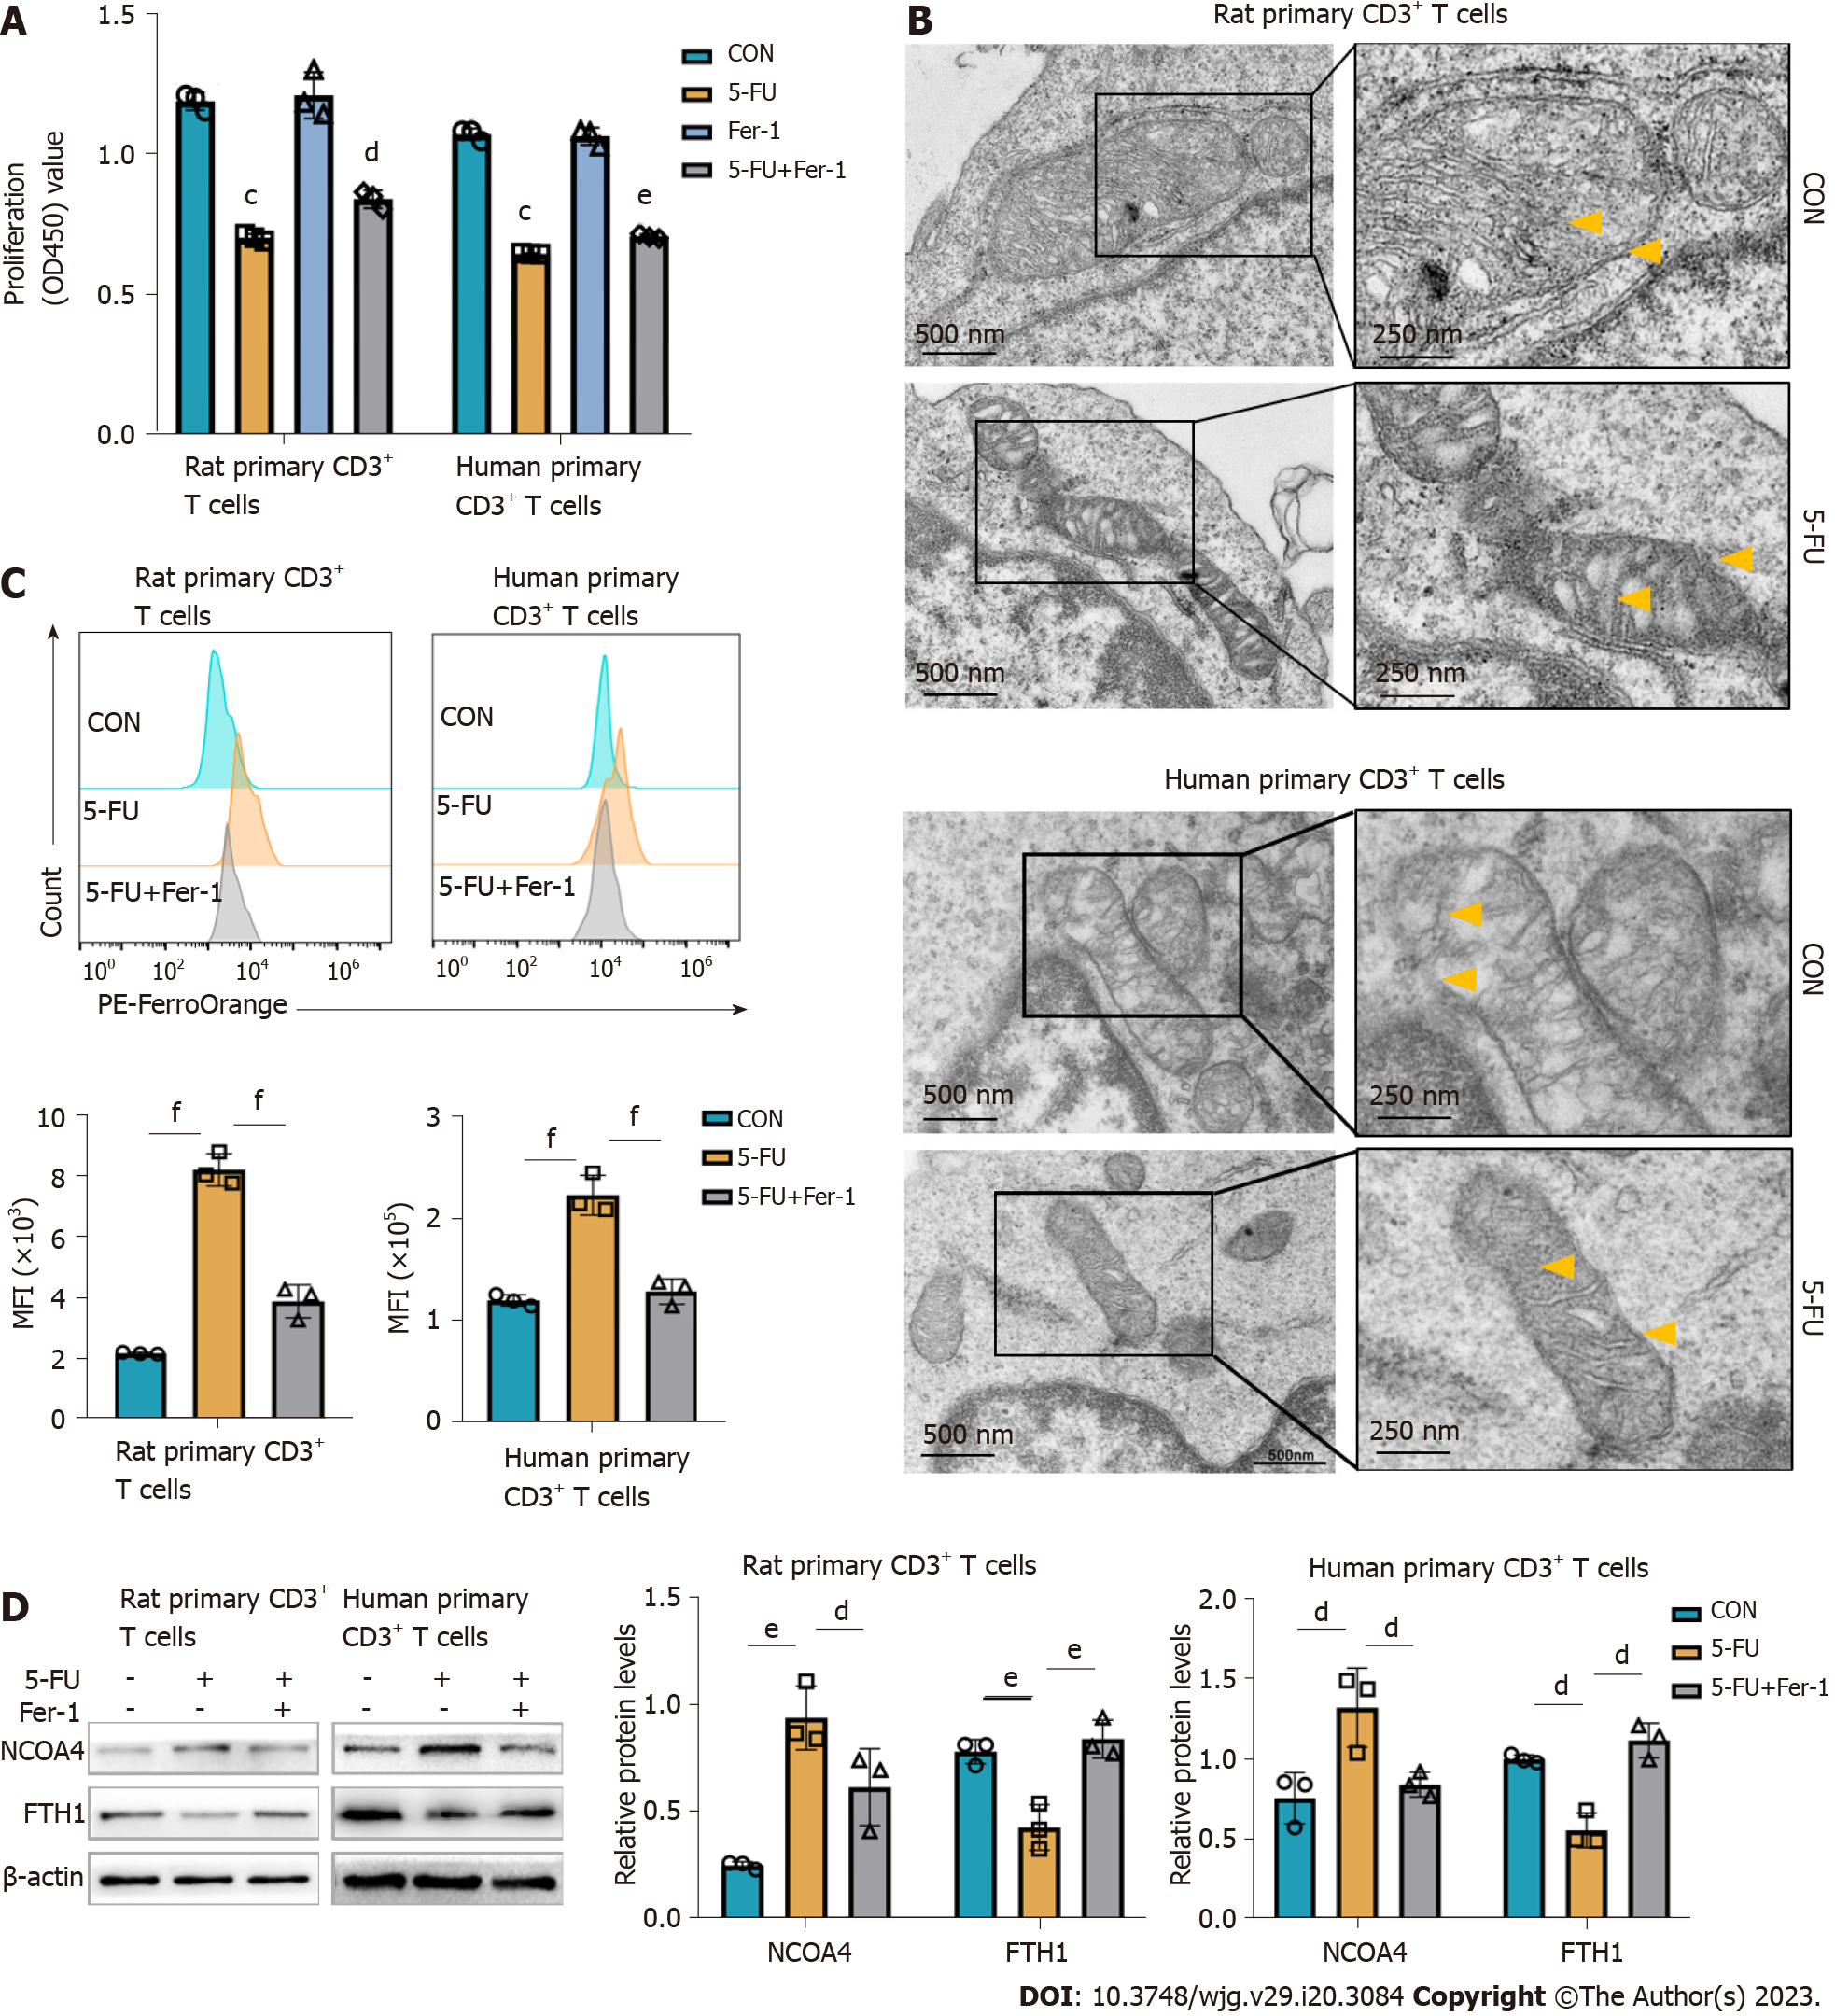
Figure 6 5-fluorouracil increases the pool of labile iron and contributes to ferroptosis in CD3+ T cells.
Vitro experiments were conducted on rat splenic and human peripheral blood CD3+ T cells, which were sorted by immunomagnetic beads. According to predetermined IC50, the rat, and human primary CD3+ T cells were treated with 5-fluorouracil (5-FU) (15 μmol/L) and ferrostatin-1 (Fer-1) (2 μmol/L) for 48 h. A: Cell viability was assessed with a Cell Counting Kit-8 kit; the results are expressed as optical density read at 450 nm; B: Transmission electron microscopy images of mitochondria in T cells show increased membrane density (yellow arrows) and a shrunk morphology (Scale bar, 500 nm, and 250 nm); C: Representative FACS data showing FerroOrange staining as the measurement of the level of cytoplasmic labile iron in primary CD3+ T cells. The graph shows the statistical analysis of mean fluorescence intensity in the different groups; D: Levels of ferritinophagy-related proteins nuclear receptor coactivator 4 and ferritin heavy chain 1 were assessed by western blot. CON groups: T cells were treated with DMSO for 48 h; 5-FU groups: T cells were treated with 5-FU (15 μmol/L) for 48 h; 5-FU+ Fer-1 groups: T cells were treated with 5-FU (15 μmol/L) and Fer-1 (2 μmol/L) for 48 h. Statistical analysis was done by one-way ANOVA, n = 3. Data are shown as mean ± SD. Data are shown as mean ± SD. cP < 0.001 vs the control group, dP < 0.05 vs the 5-FU group, eP < 0.01 vs the 5-FU group, fP < 0.001 vs the 5-FU group. CON: Untreated control groups; 5-FU: 5-fluorouracil; NCOA4: Nuclear receptor coactivator 4; FTH1: Ferritin heavy chain 1; Fer-1: Ferrostatin-1.
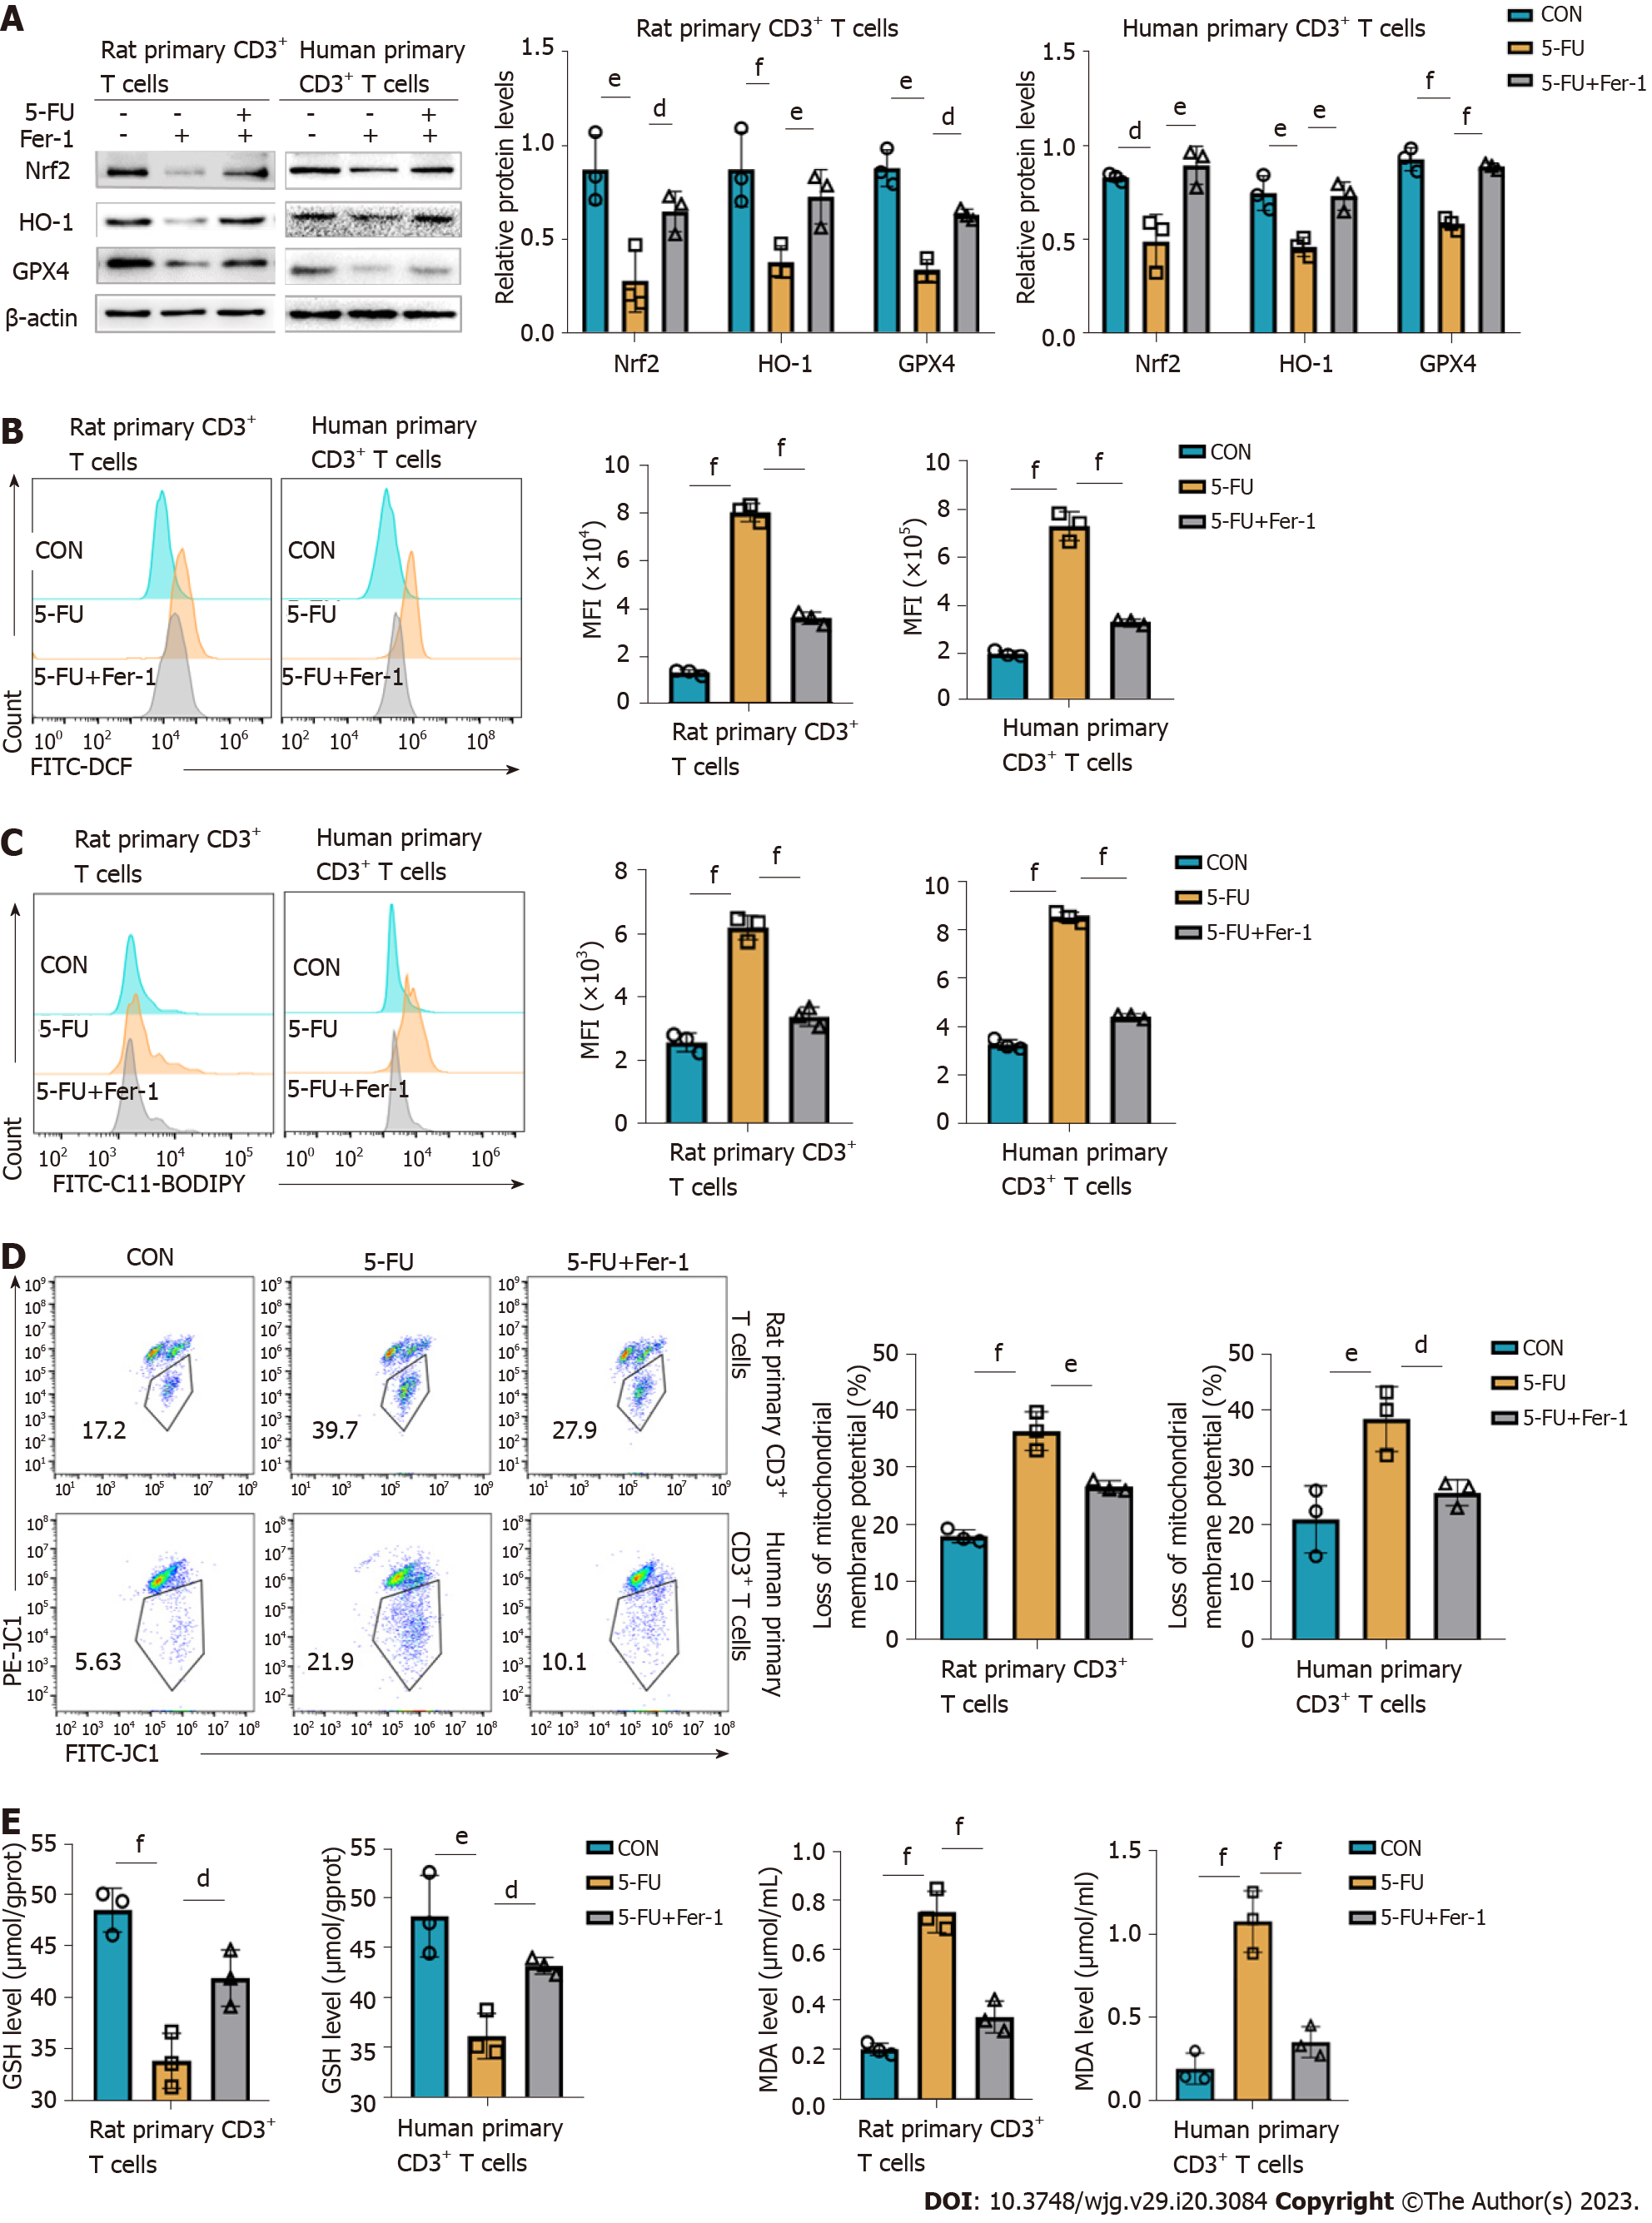
Figure 7 5-fluorouracil disturbs the antioxidative/oxidative balance, resulting in CD3+ T cells ferroptosis.
A: Levels of antioxidant proteins nuclear erythroid 2 p45-related factor 2, heme oxygenase-1, and glutathione peroxidase 4 assessed by western blot, and corresponding graphs showing the statistical comparison between groups; B and C: Reactive oxygen species (ROS) and lipid ROS of rat and human CD3+ T cells were detected by FACS using DCFH-DA and C11-BODIPY fluorescent conjugates, BODIPY emission was recorded on oxidized C11 (FITC channel) signal; the graphs display the comparison of mean fluorescence intensity levels in the different groups; D: Proportion of cells with reduced mitochondrial membrane potential assessed by flow cytometry; E and F: Glutathione and malondialdehyde content T cells after treatment for 48 h. CON groups: T cells were treated with DMSO for 48 h; 5-fluorouracil (5-FU) groups: T cells were treated with 5-FU (15 μmol/L) for 48 h; 5-FU+ferrostatin-1 (Fer-1) groups: T cells were treated with 5-FU (15 μmol/L) and Fer-1 (2 μmol/L) for 48 h. Statistical analysis was done by one-way ANOVA, n = 3. dP < 0.05 vs the 5-FU group, eP < 0.01 vs the 5-FU group, fP < 0.001 vs the 5-FU group. Nrf2: Nuclear erythroid 2 p45-related factor 2; HO-1: Heme oxygenase-1; GPX4: Glutathione peroxidase 4; GSH: Glutathione; MDA: Malondialdehyde; CON: Untreated control groups; 5-FU: 5-fluorouracil; Fer-1: Ferrostatin-1; MFI: Mean fluorescence intensity.
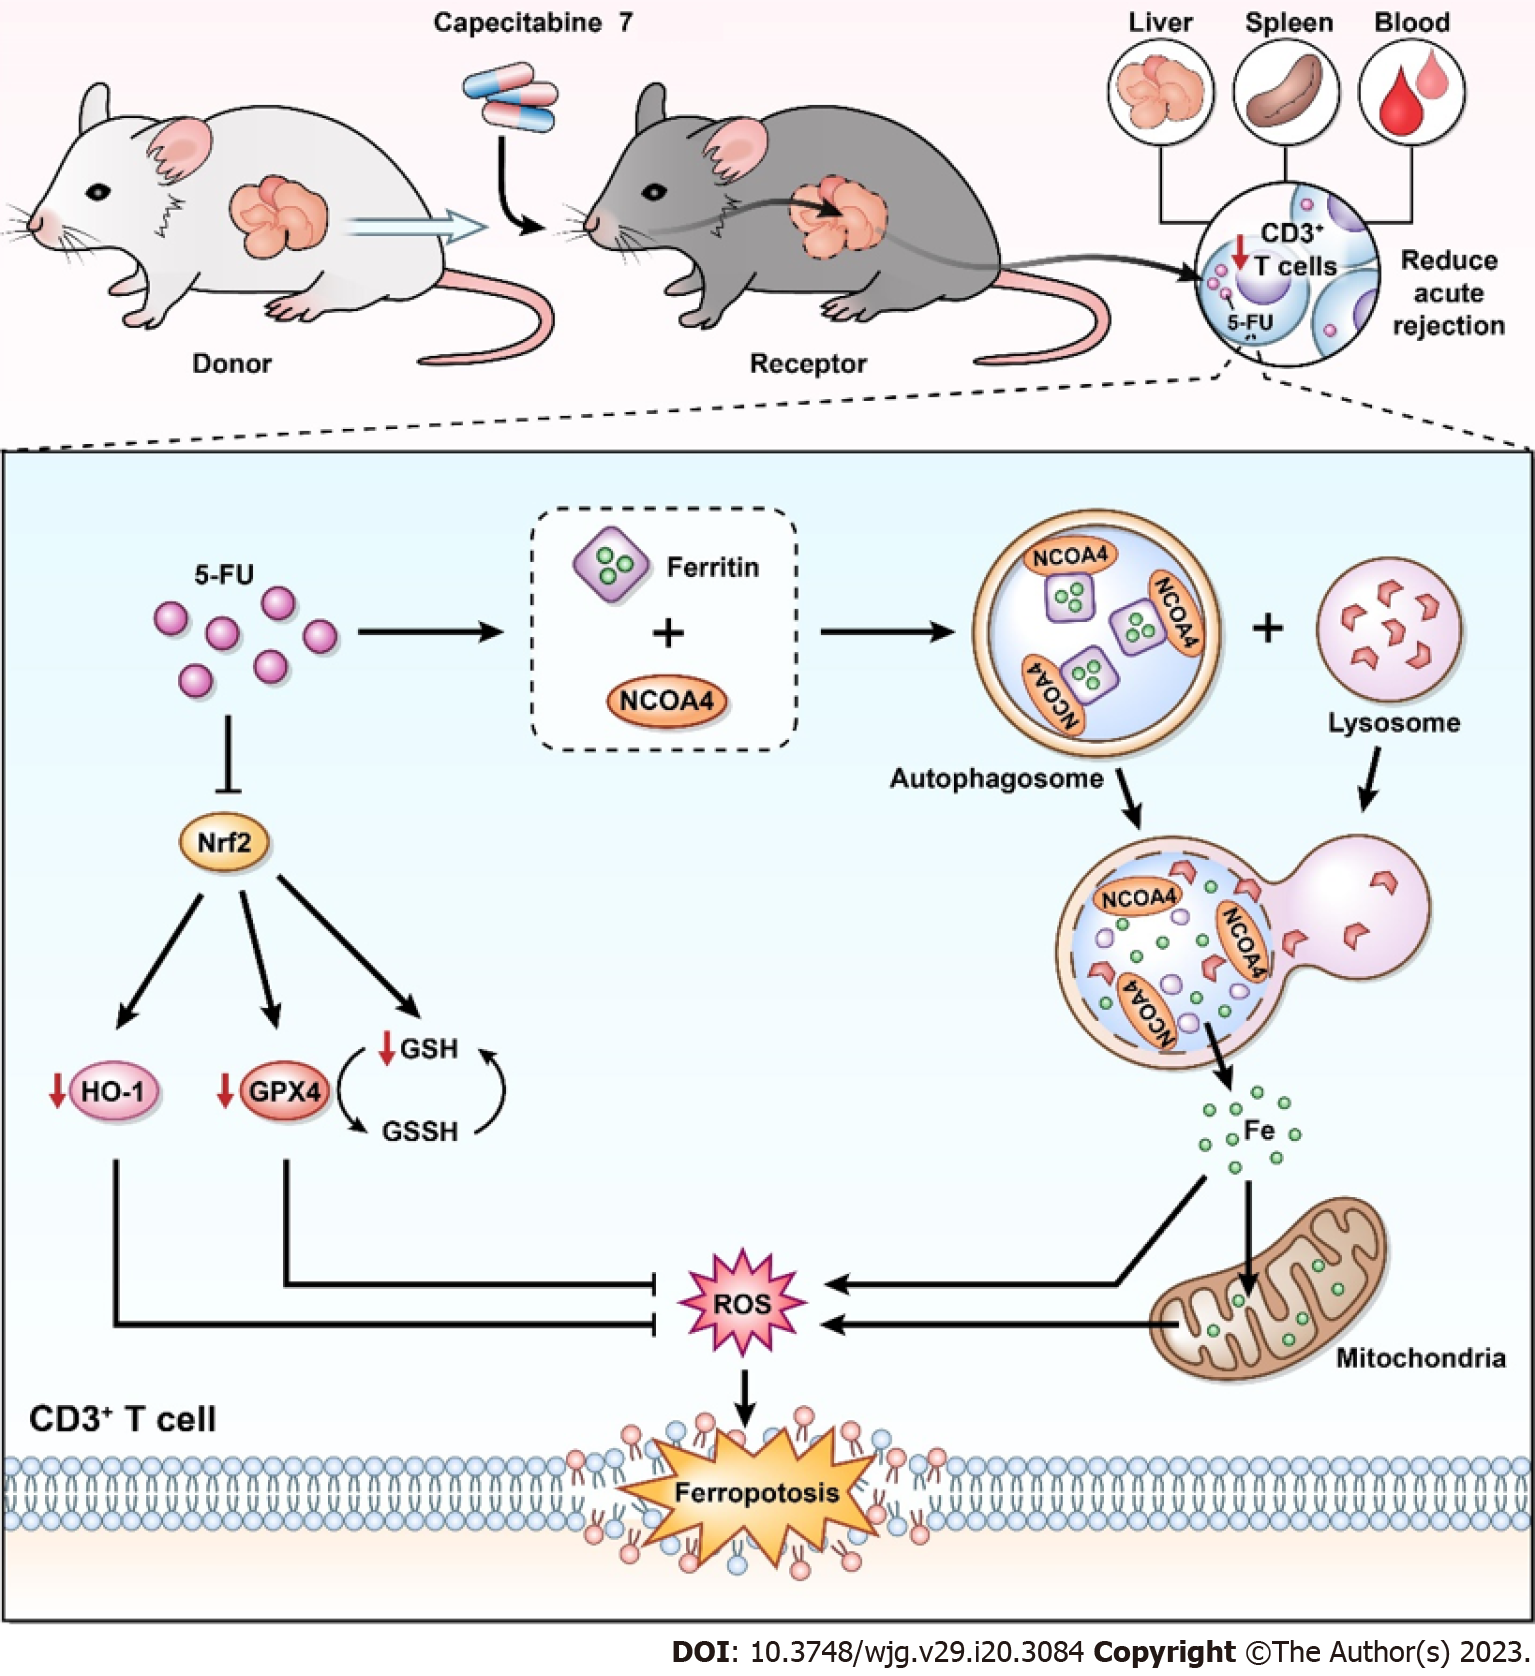
Figure 8 Possible immunosuppressive mechanisms of metronomic capecitabine on T cells by ferroptosis induction.
In the rat model of acute rejection after liver transplantation, metronomic capecitabine (CAP) exerts an immunosuppressive effect by decreasing T cell numbers in peripheral blood, liver graft, and spleen. Metronomic CAP increases the concentration of free ferrous ions by inducing ferritin degradation while inhibiting the expression of antioxidant proteins. Eventually, these effects lead to peroxidation damage and iron toxicity, which induce T cell death. 5-FU: 5-fluorouracil; Nrf2: Nuclear erythroid 2 p45-related factor 2; NCOA4: Nuclear receptor coactivator 4; HO-1: Heme oxygenase-1; GPX4: Glutathione peroxidase 4; GSH: Glutathione; GSSH: Oxidized glutathione; ROS: Reactive oxygen species.
- Citation: Wang H, Wang ZL, Zhang S, Kong DJ, Yang RN, Cao L, Wang JX, Yoshida S, Song ZL, Liu T, Fan SL, Ren JS, Li JH, Shen ZY, Zheng H. Metronomic capecitabine inhibits liver transplant rejection in rats by triggering recipients’ T cell ferroptosis. World J Gastroenterol 2023; 29(20): 3084-3102
- URL: https://www.wjgnet.com/1007-9327/full/v29/i20/3084.htm
- DOI: https://dx.doi.org/10.3748/wjg.v29.i20.3084


