Copyright
©The Author(s) 2022.
World J Gastroenterol. Feb 28, 2022; 28(8): 811-824
Published online Feb 28, 2022. doi: 10.3748/wjg.v28.i8.811
Published online Feb 28, 2022. doi: 10.3748/wjg.v28.i8.811
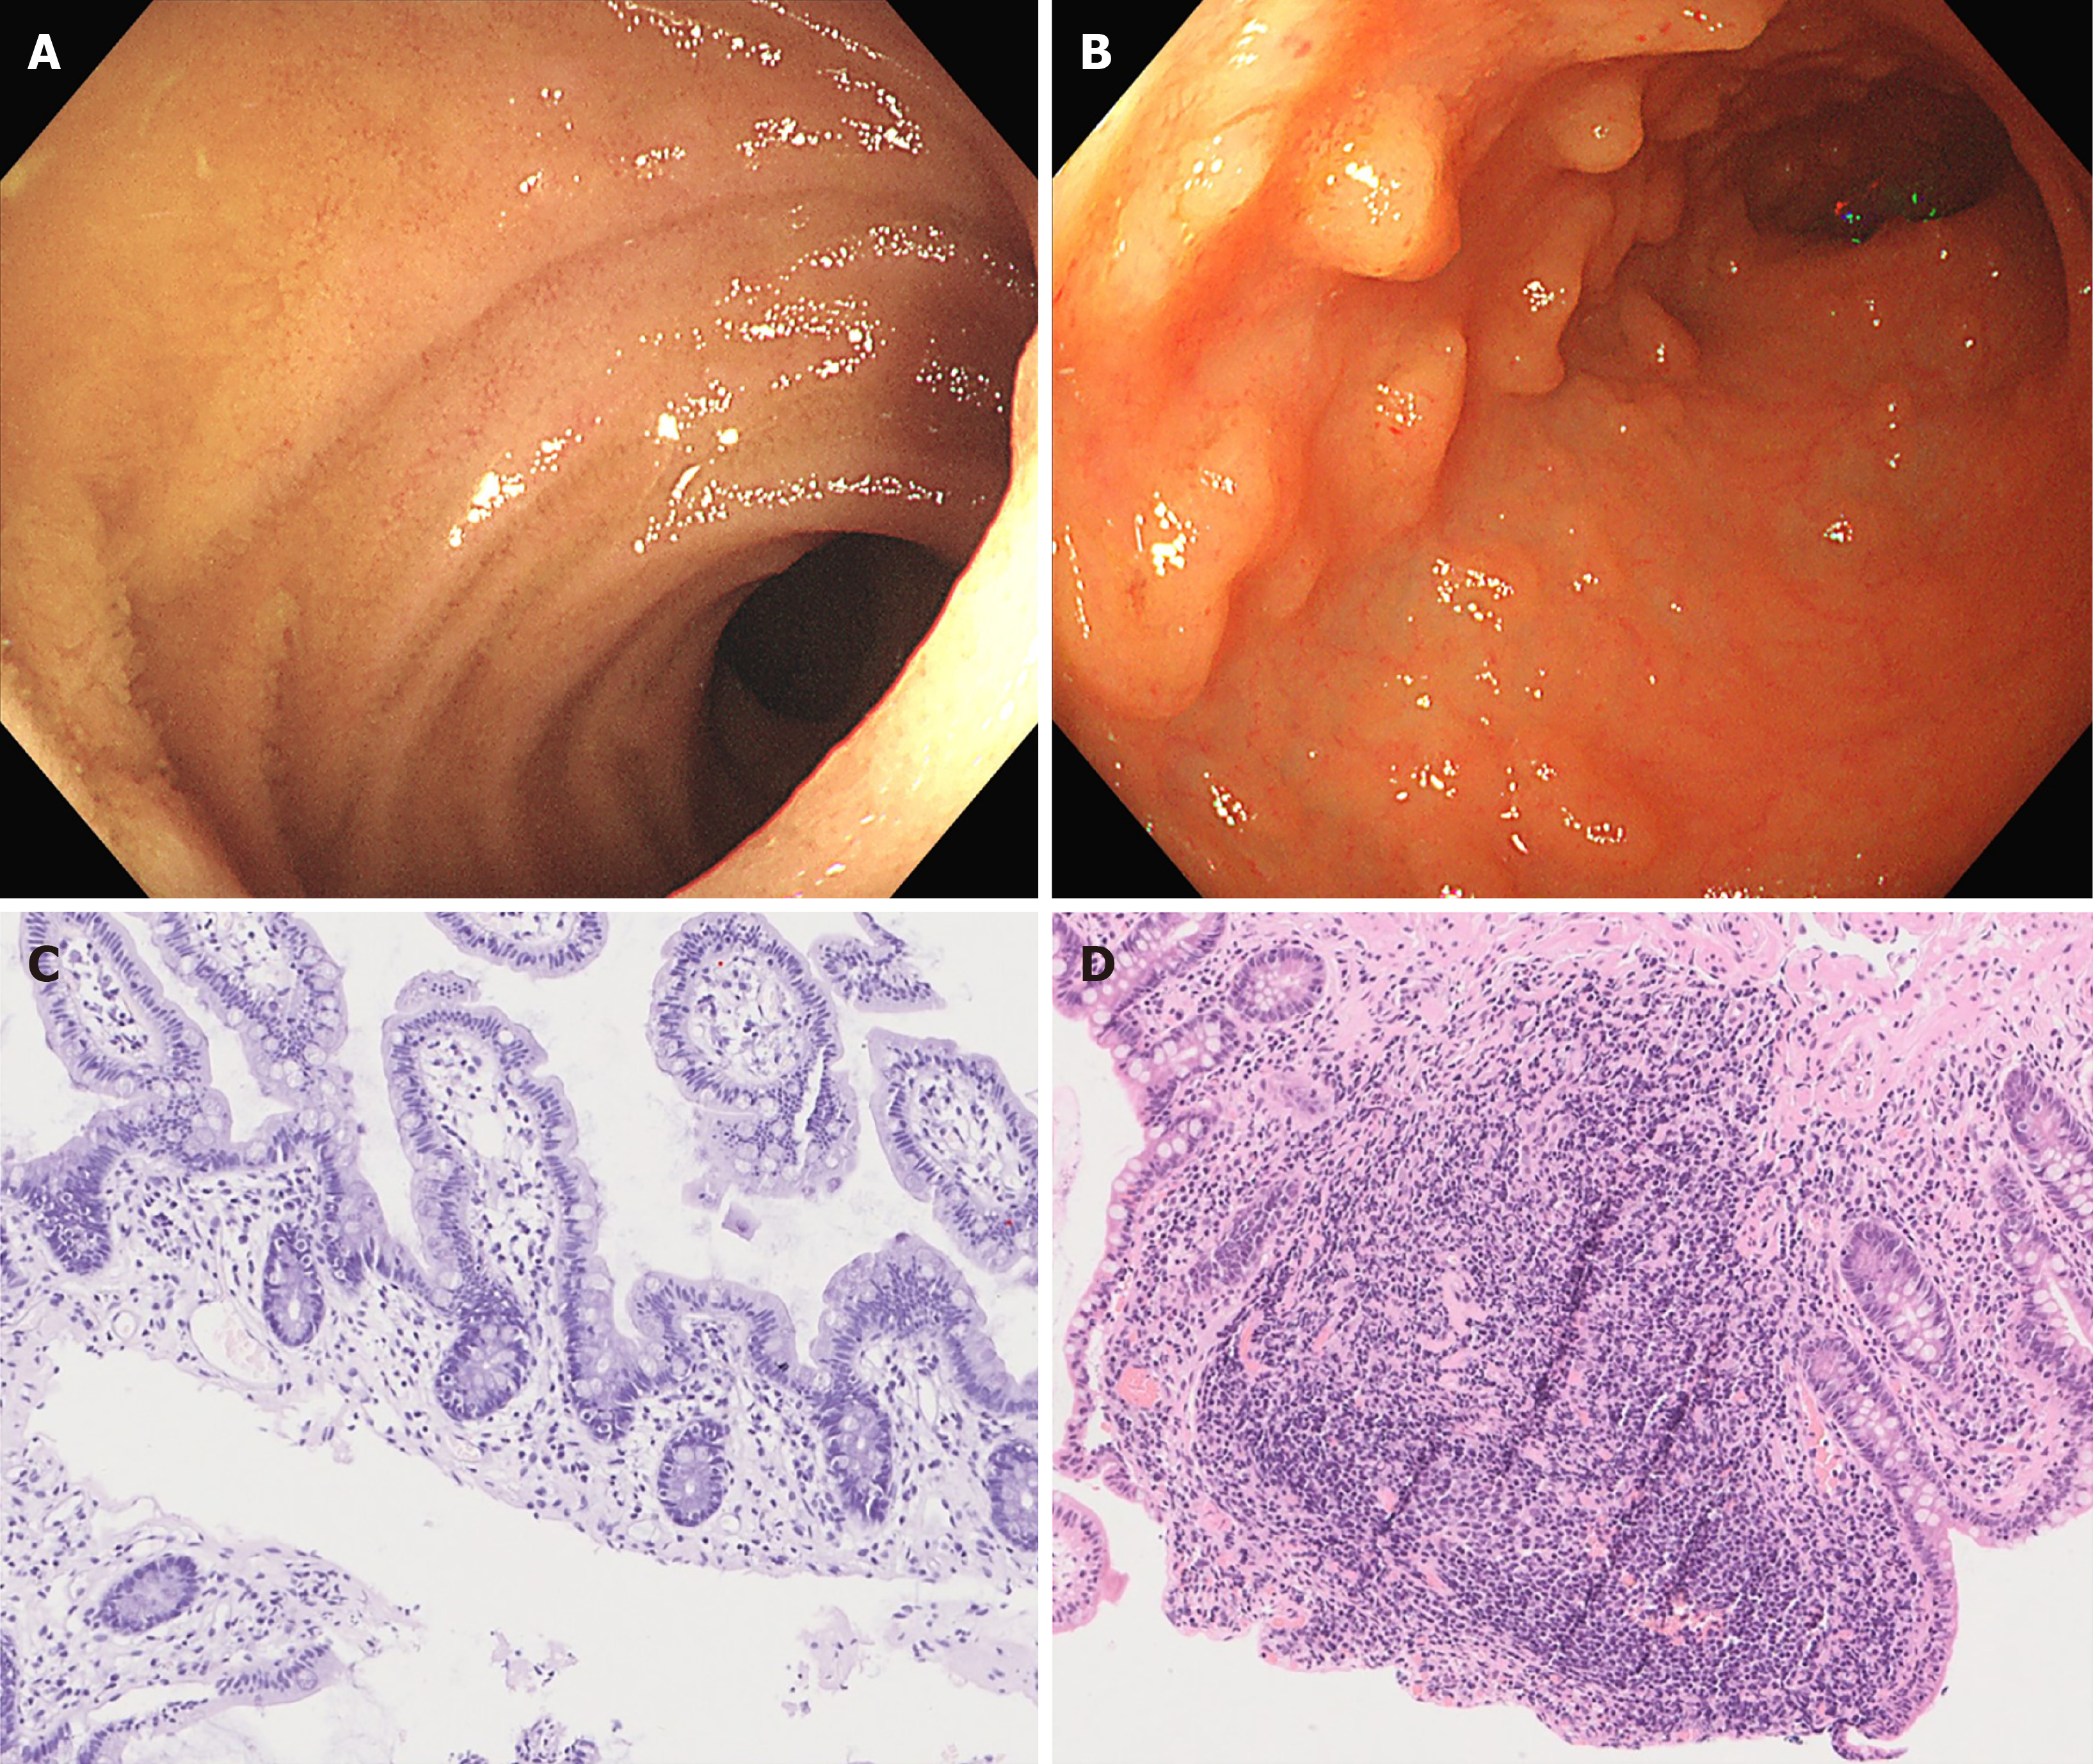
Figure 1 Endoscopic images and pathological characteristics of nodular lymphoid hyperplasia and normal mucosa in the terminal ileum.
A: Endoscopic image of a normal terminal ileum from a healthy volunteer; B: Endoscopic image of nodular lymphoid hyperplasia (NLH) in terminal ileum of a patients; C: Pathological characteristics of normal terminal ileal mucosa (×100; scale bar, 200 µm); D: Pathological characteristics of terminal ileal NLH: hyperplasic lymphoid follicles germinal centers (×100; scale bar, 200 µm).
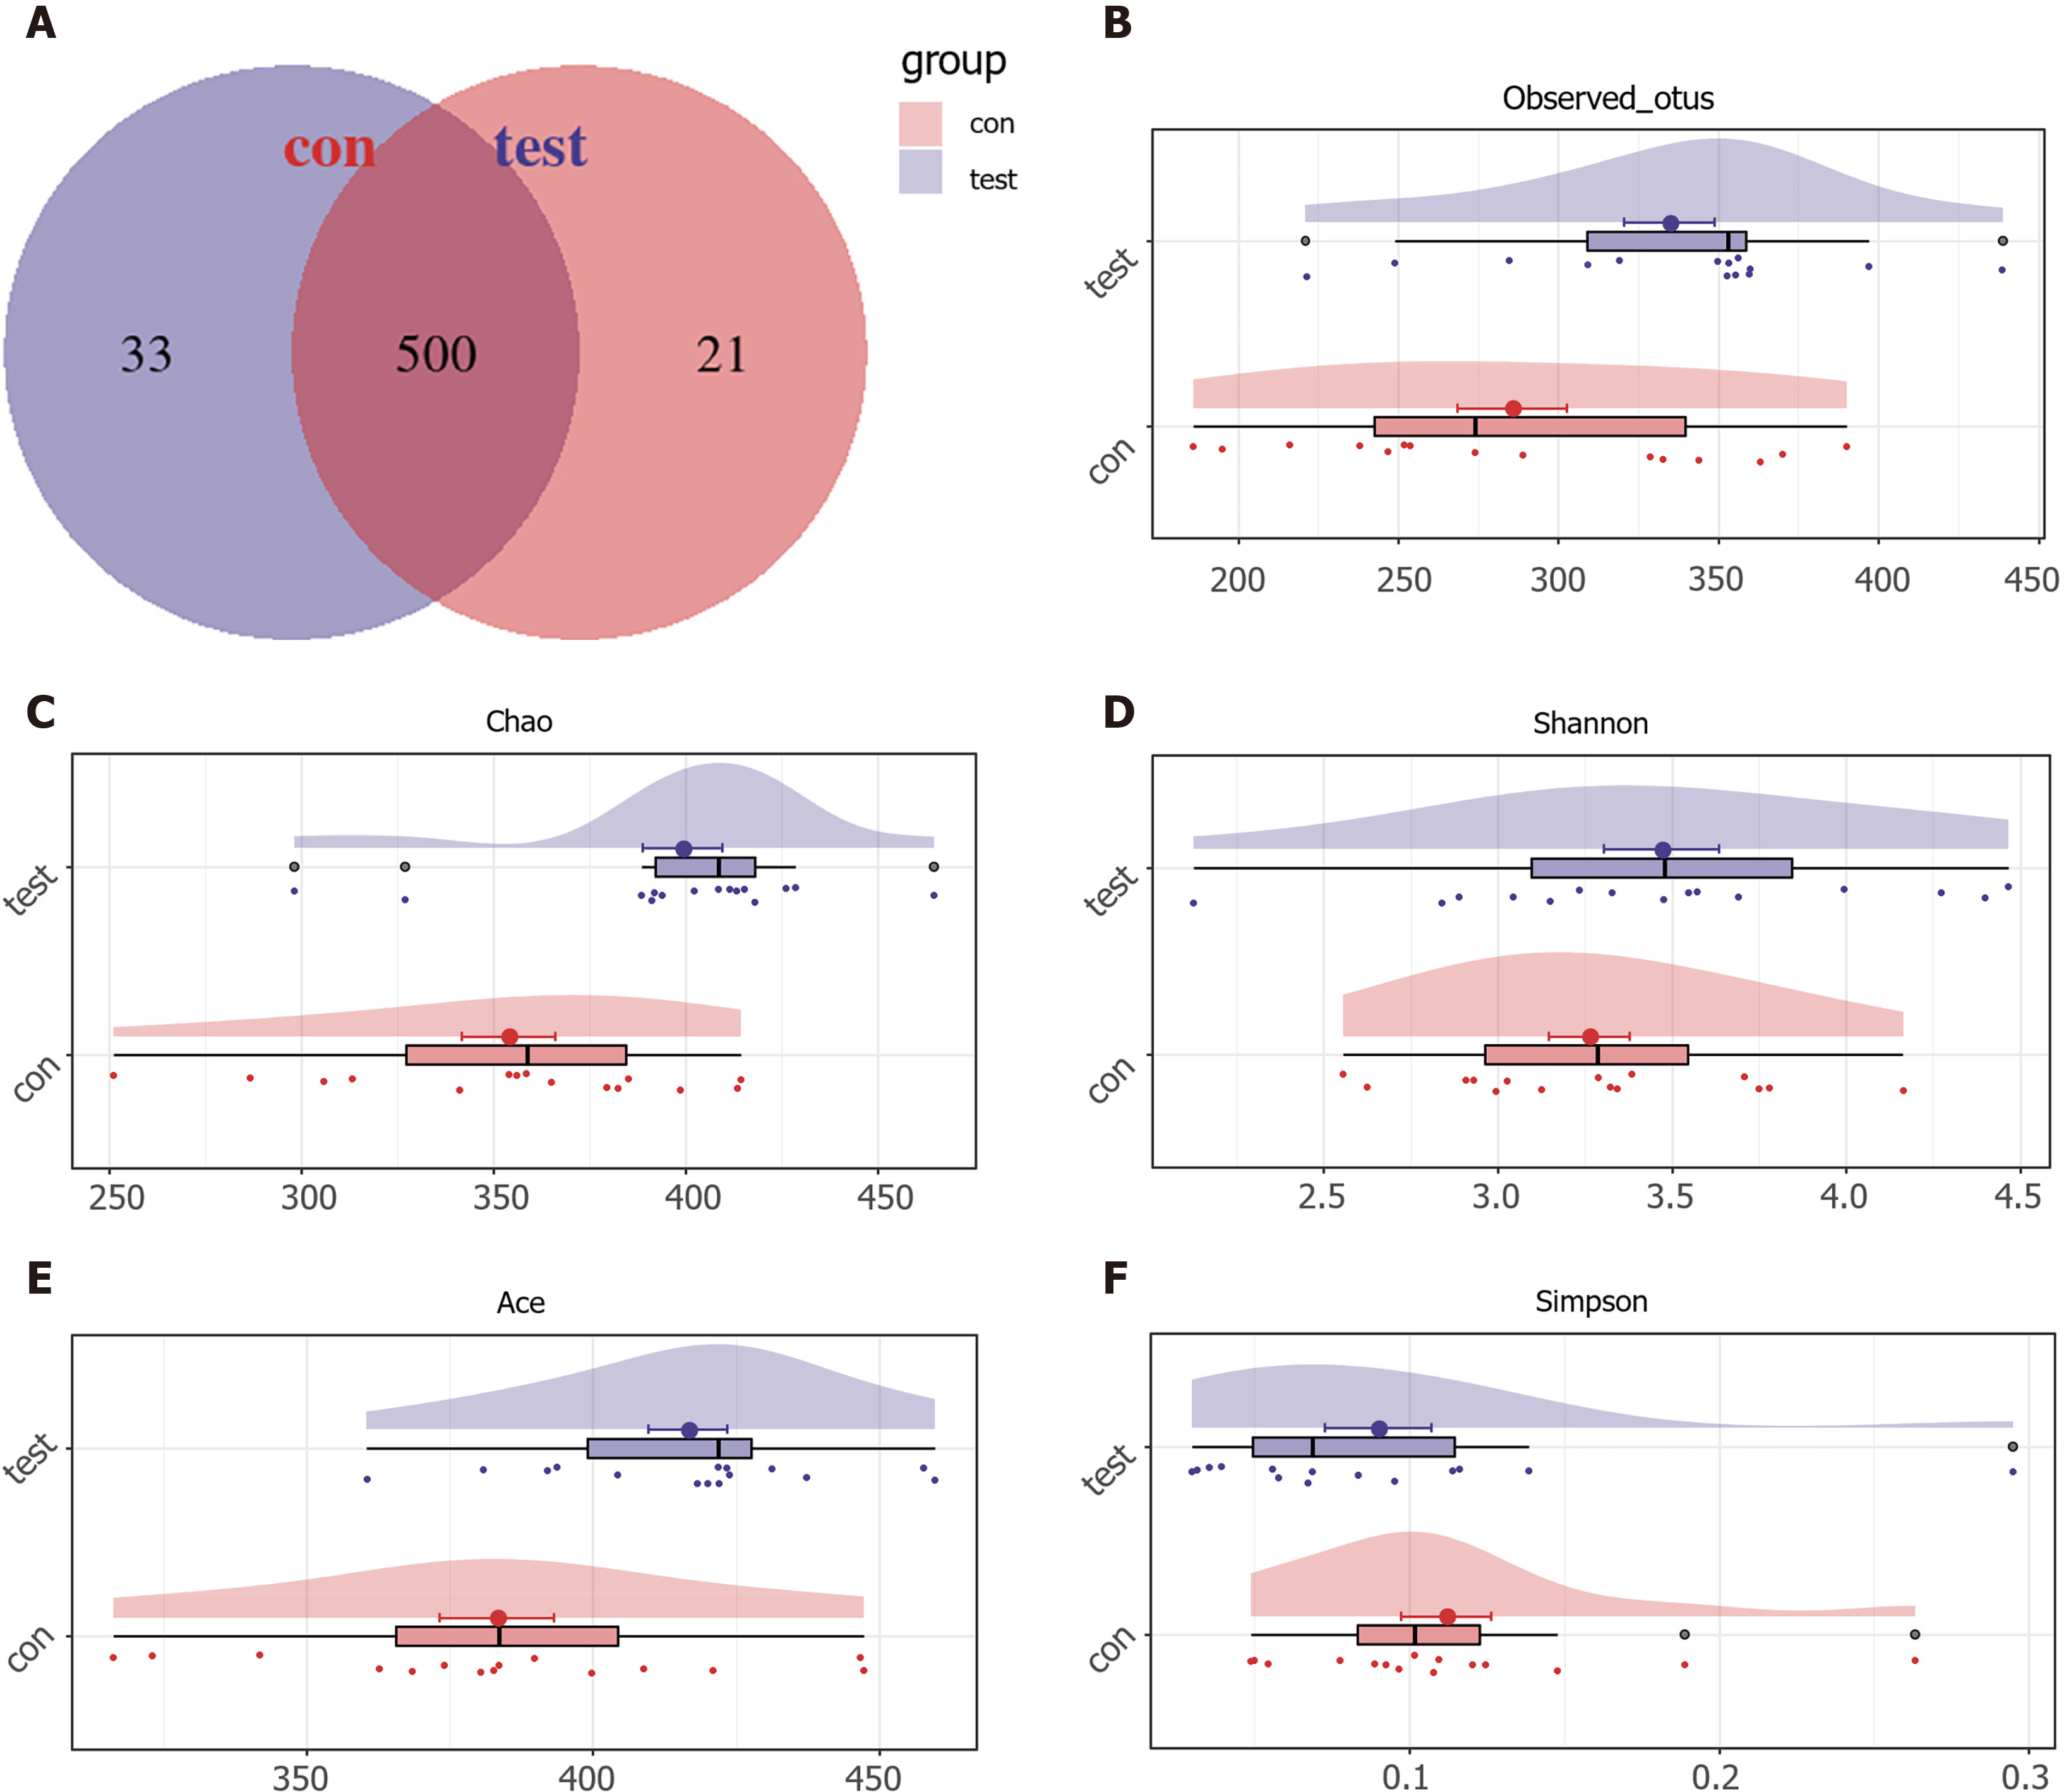
Figure 2 Operational Taxonomic Units clustering and alpha diversity analysis of mucosal intestinal microflora.
A: Venn diagram demonstrates the shared and unique Operational Taxonomic Units (OTUs) in both groups; B: The OTUs in the single sample from each group; C: Chao index; D: Shannon-Wiener diversity index; E: ACE estimator; F: Simpson diversity index.
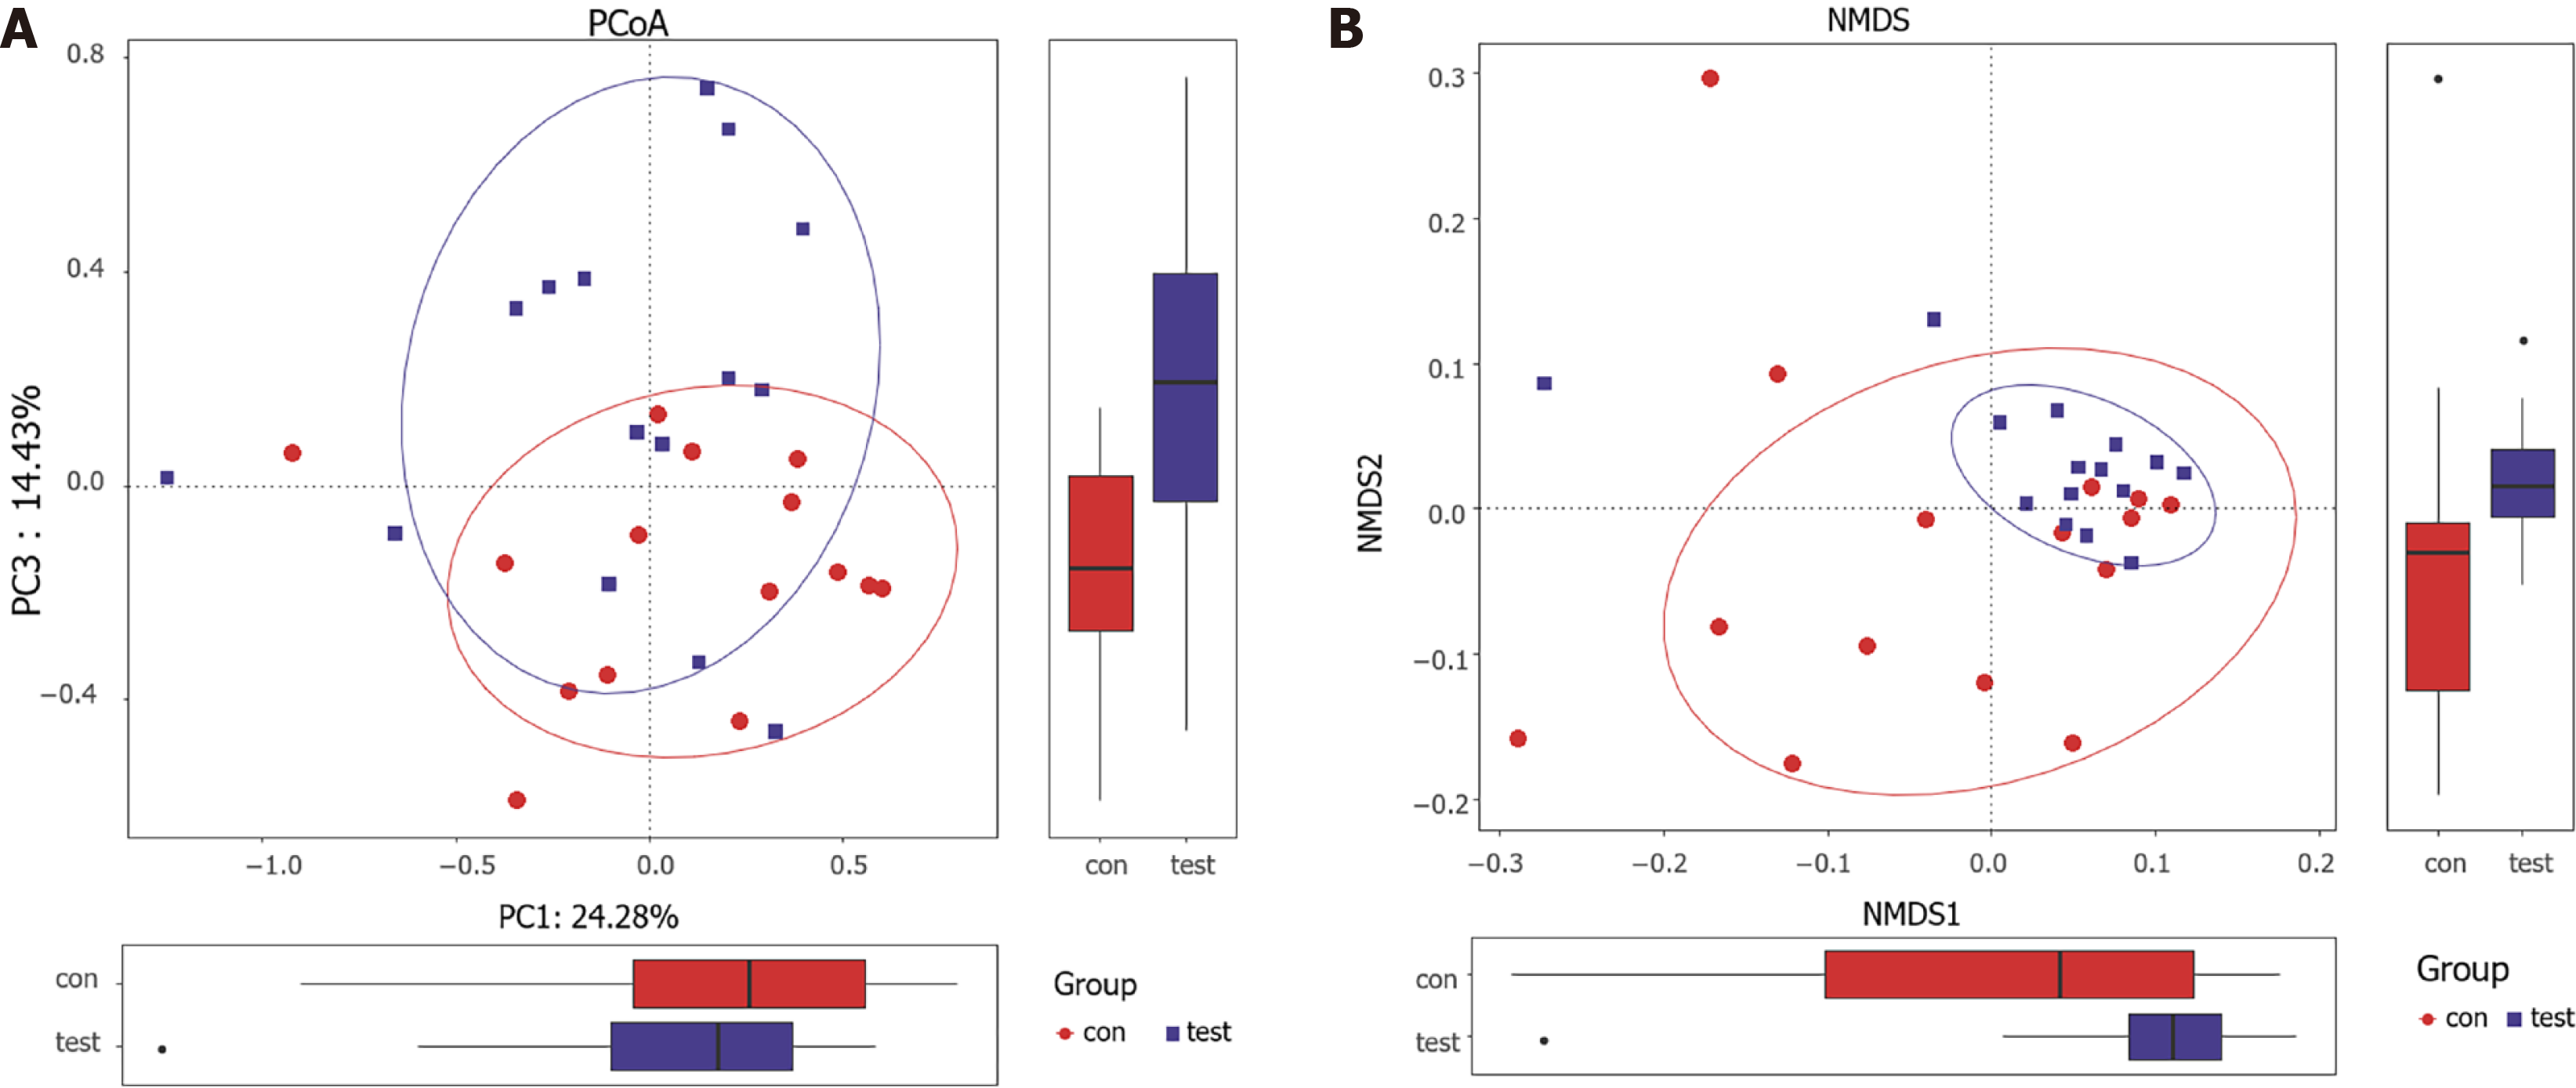
Figure 3 Analysis of beta diversity based on Operational Taxonomic Units levels.
A: Principal coordinates analysis plots based on the Bray-Curtis distances shows the differences in the bacterial flora between the terminal ileal nodular lymphoid hyperplasia and control groups; B: Nonmetric multidimensional scaling analysis based on the Bray-Curtis distances shows the differences between both groups. Each symbol represents one sample.
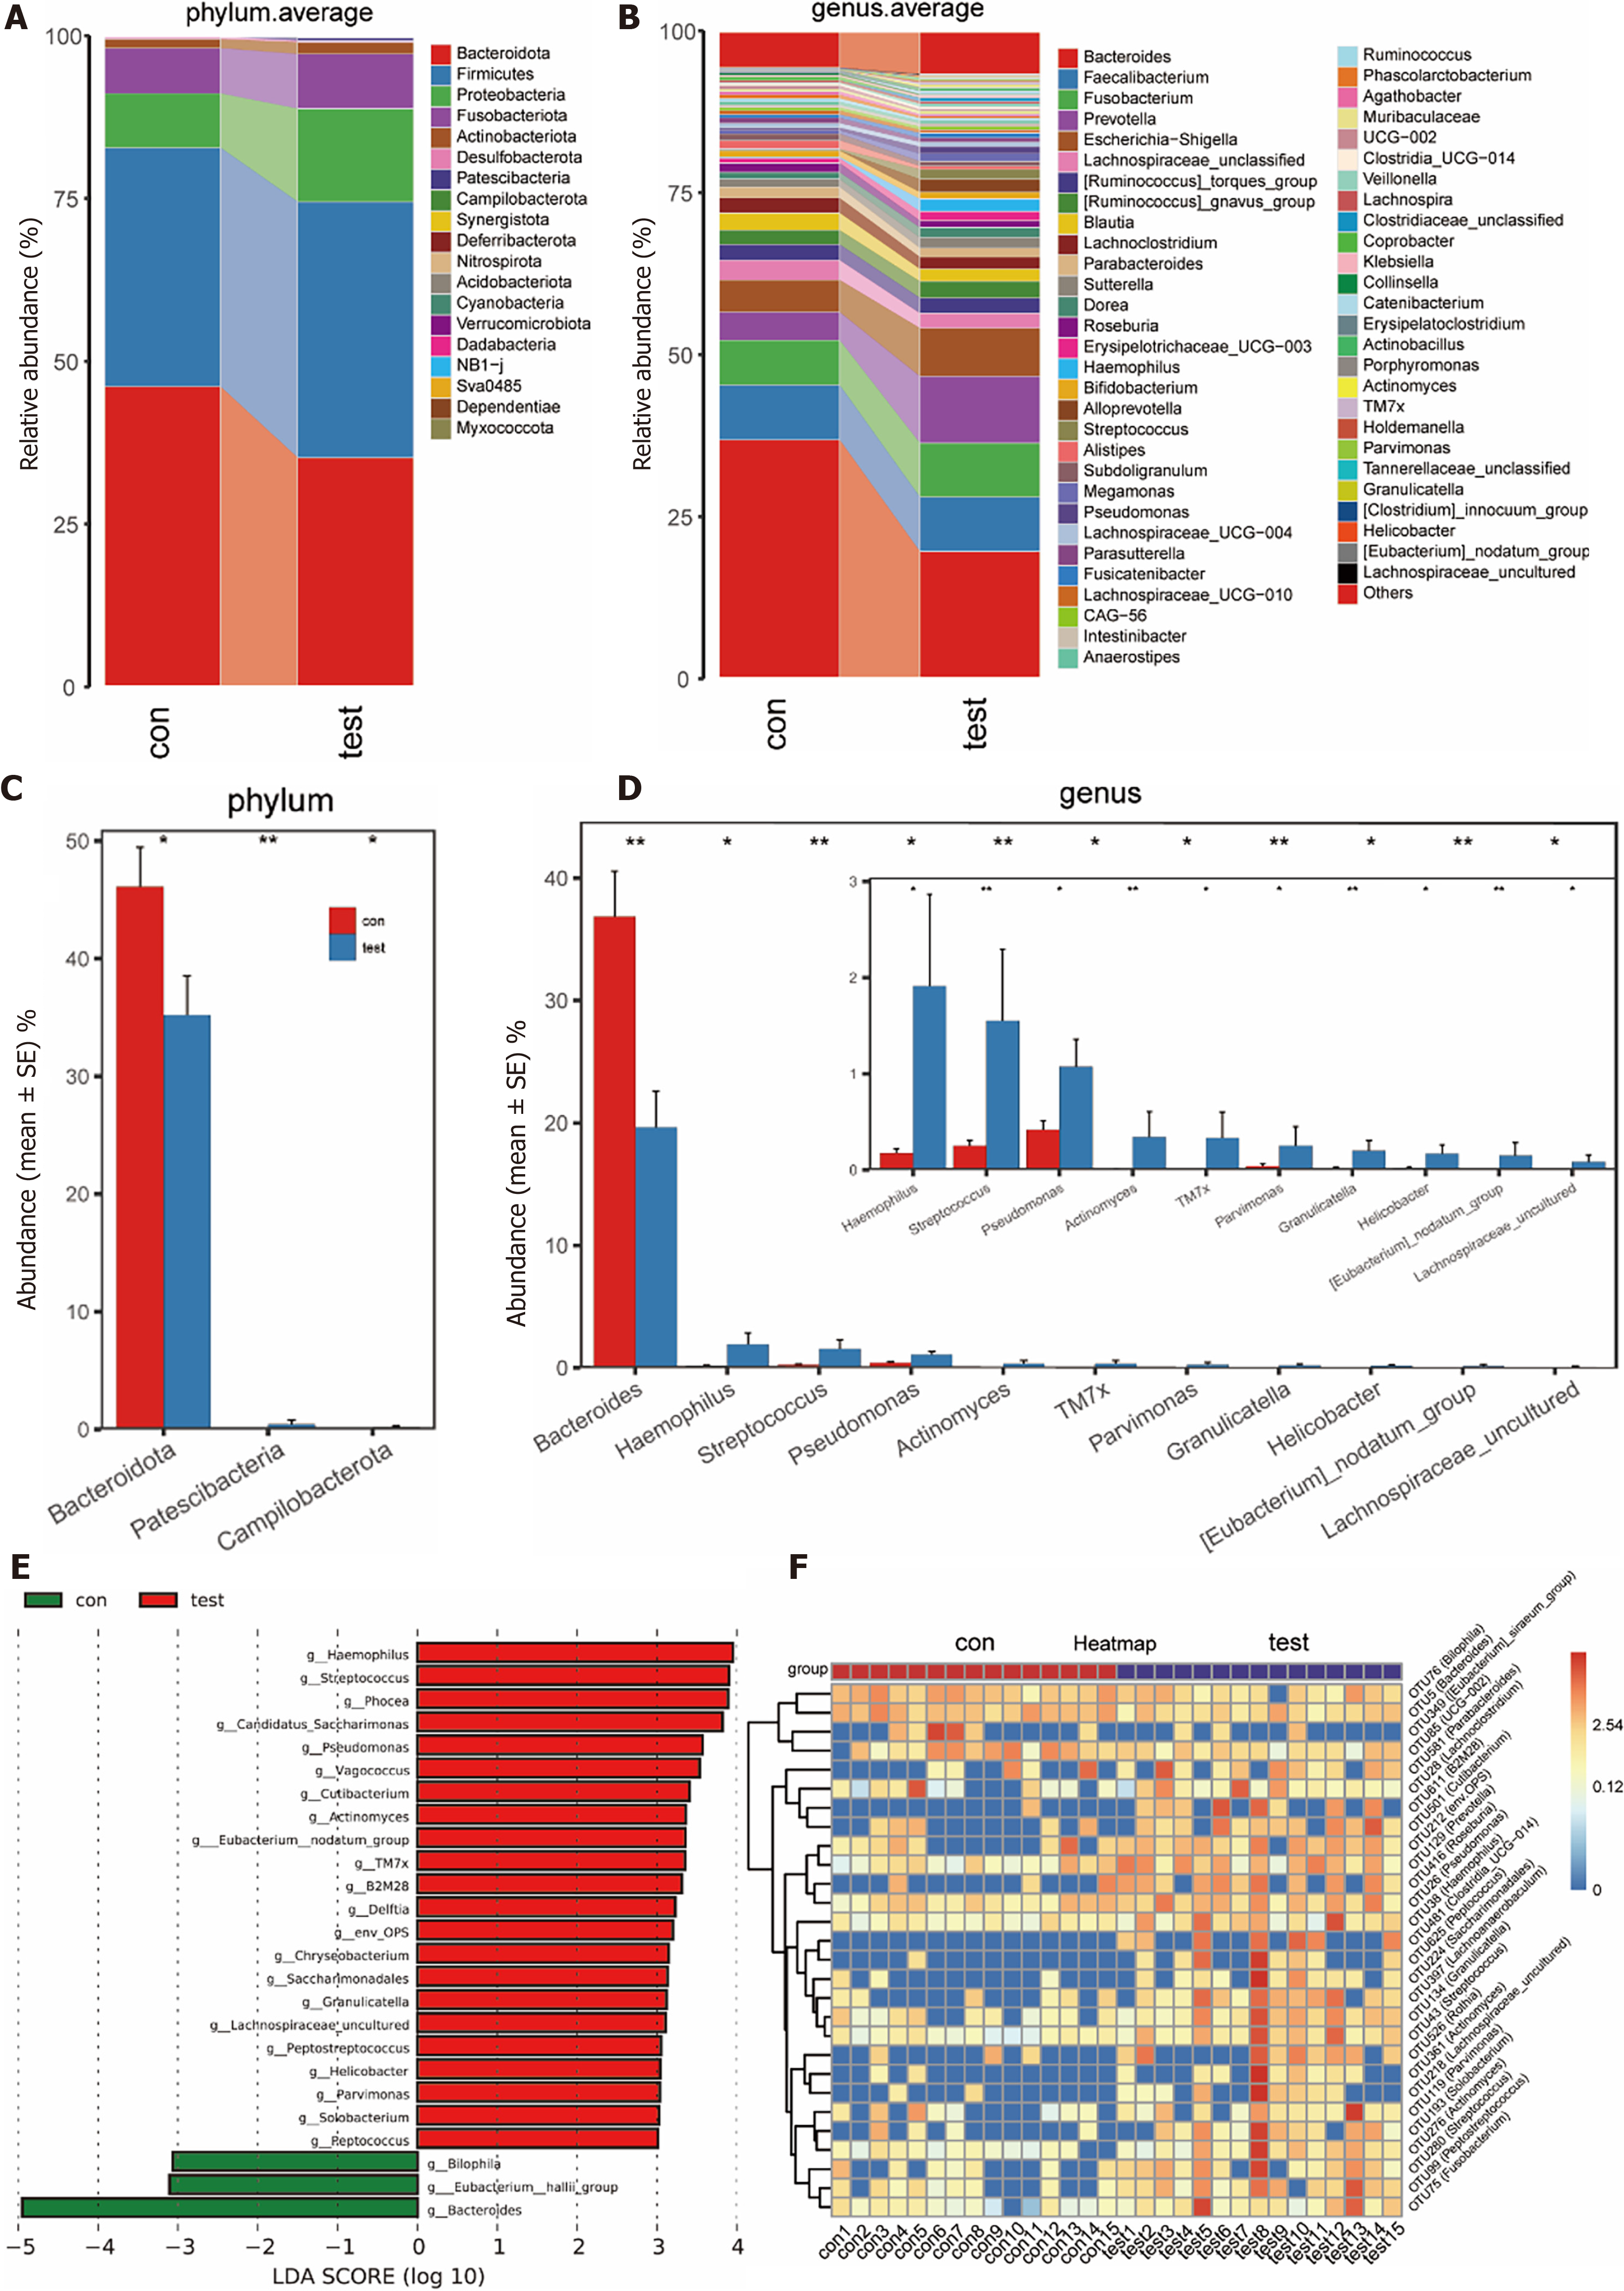
Figure 4 Flora composition and comparison of microbiome composition in both groups.
A: Flora composition at the phylum level; B: Flora composition at the genus level; C: The abundance of Bacteroidetes was significantly lower at the phylum level in the test group, as assessed by a Wilcoxon rank-sum test; D: Differences in the flora at the genus level between the groups, as assessed by a Wilcoxon rank-sum test; E: Flora differences at the genus level, as assessed by Linear discriminant analysis effect size; F: A heatmap analysis of the microbiomes using a random forest model.
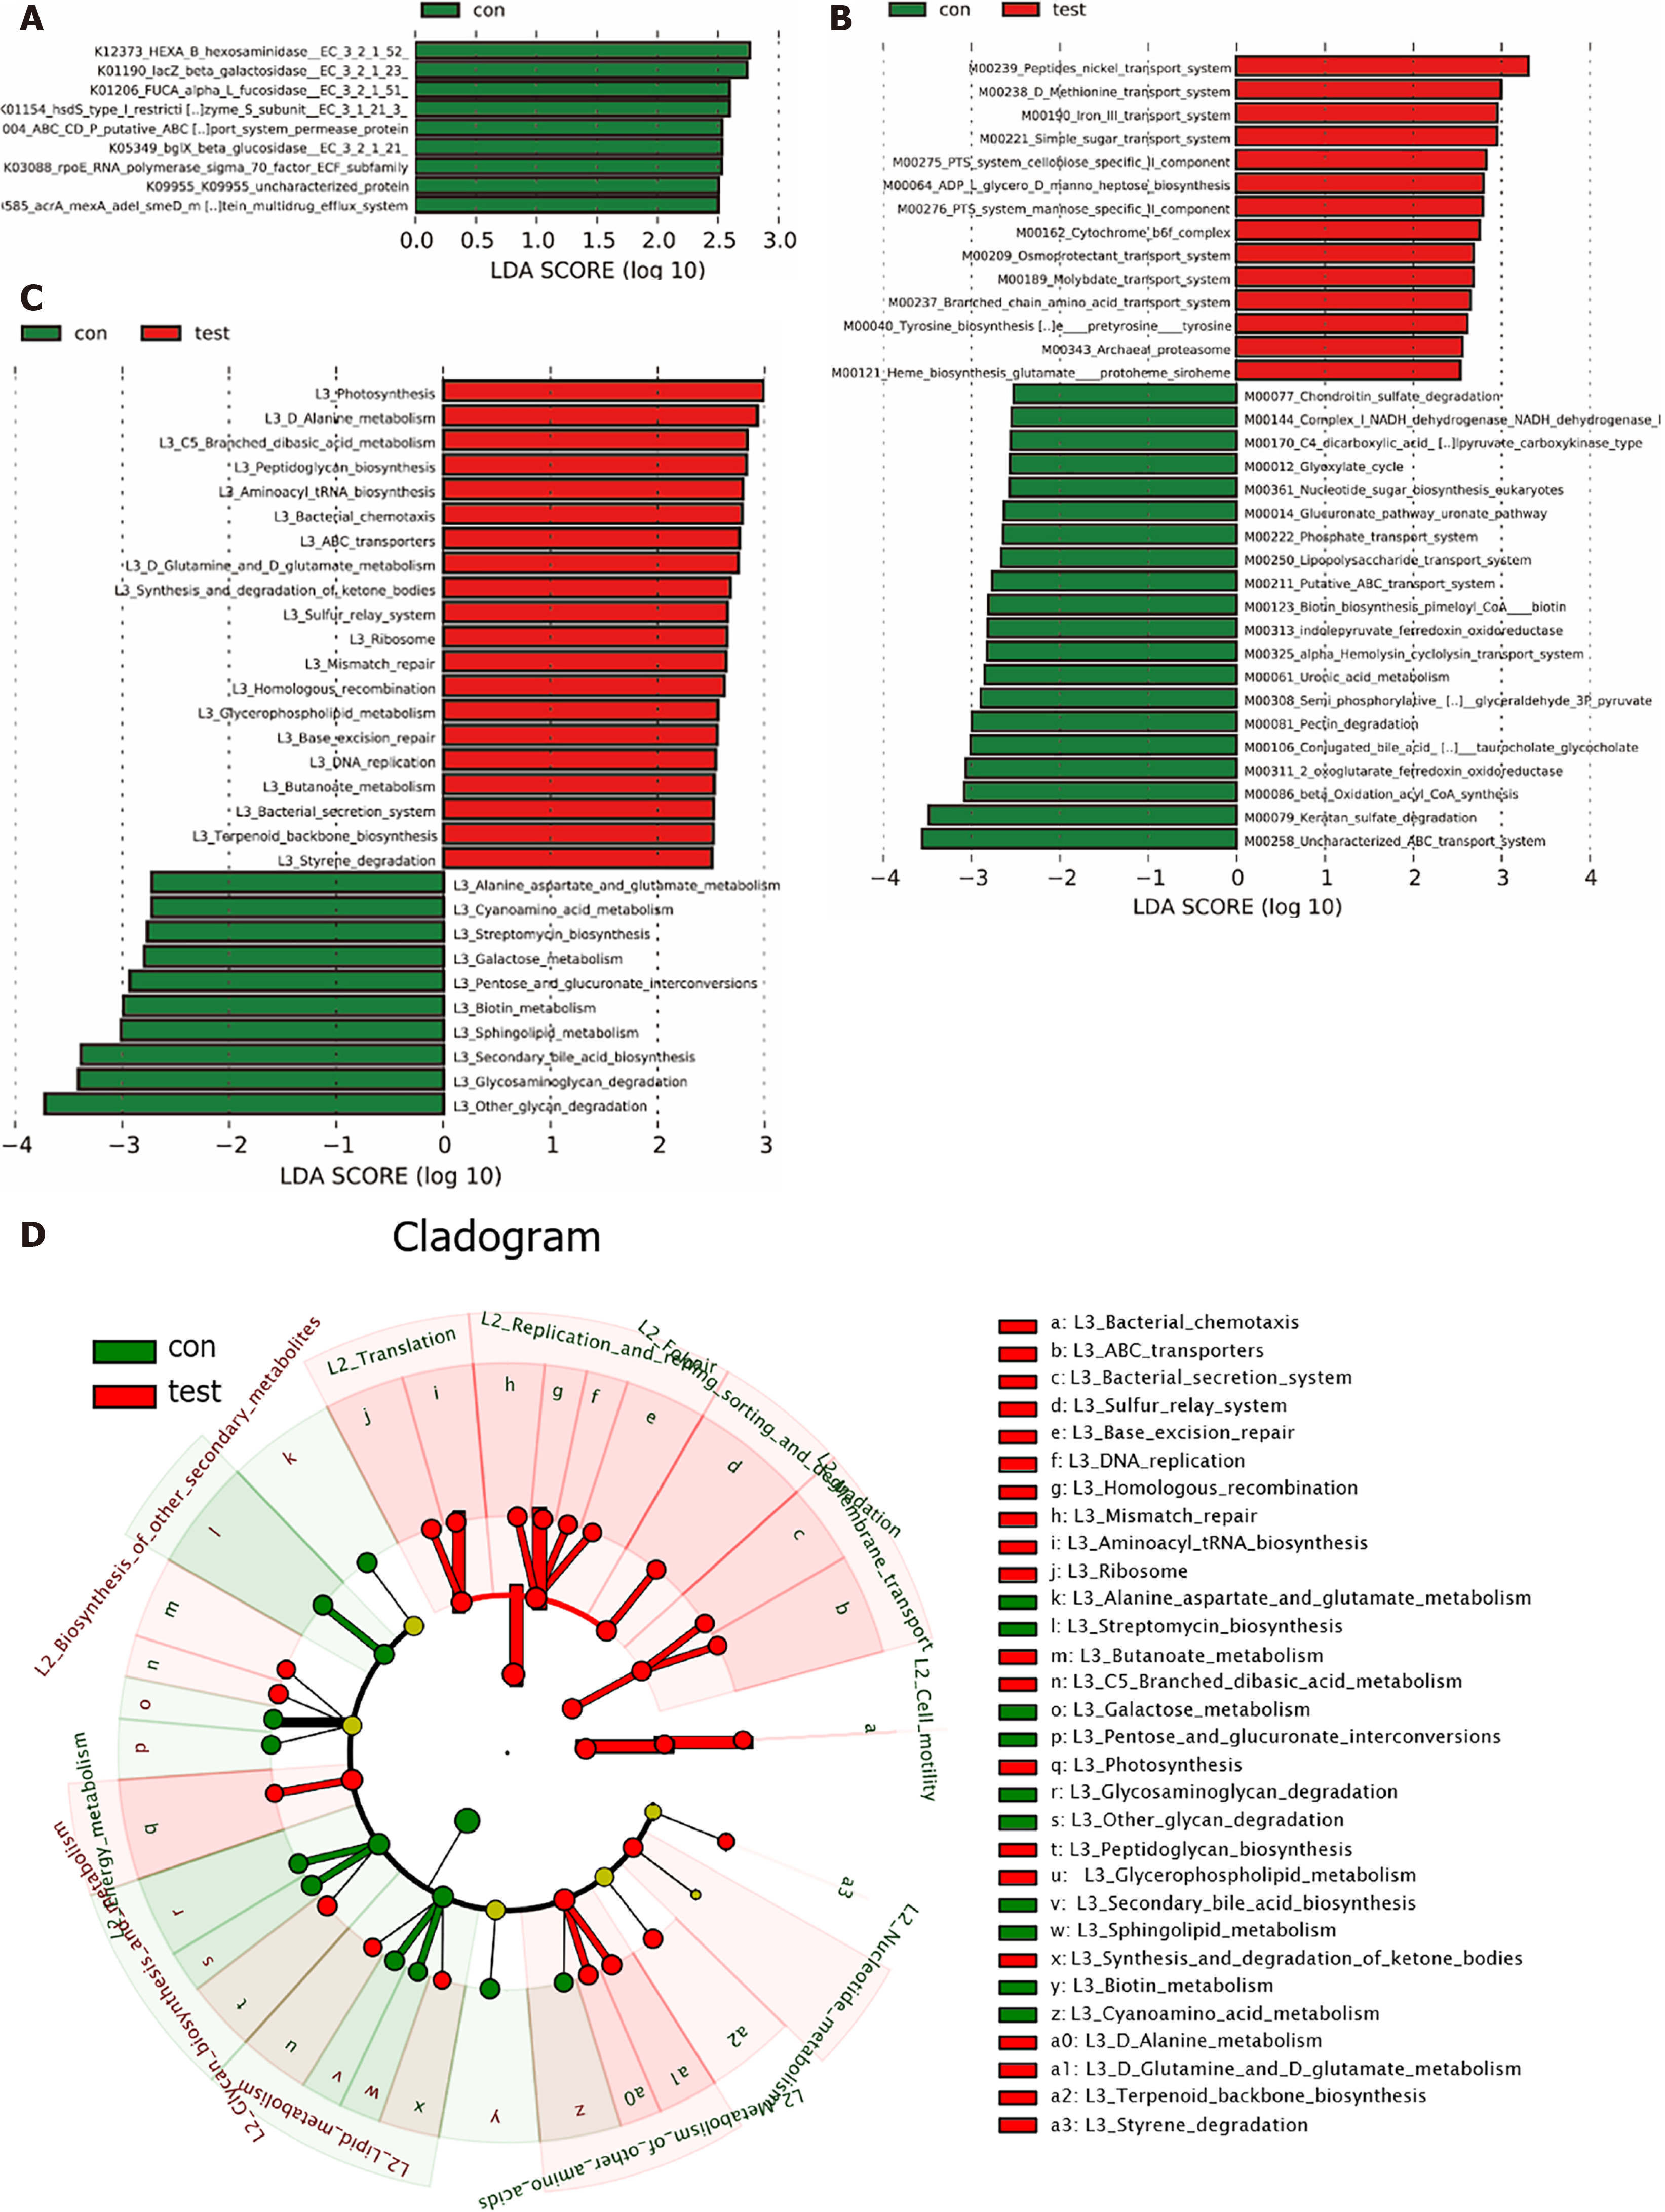
Figure 5 Predictions of the functional alteration to the gut microbiomes in patients with nodular lymphoid hyperplasia in the terminal ileum.
A: Decreased the yoto Encyclopedia of Genes and Genomes orthologous groups in patients with terminal ileal nodular lymphoid hyperplasia (NLH) as shown by the histogram of the linear discriminant analysis (LDA) scores; B: Altered modules in patients with terminal ileal NLH (red, terminal ileal NLH tissue; green, control); C: Altered metabolic pathways in patients with terminal ileal NLH as shown by the histogram of the LDA scores (red, terminal ileal NLH tissue; green, control); D: Altered metabolic pathways in patients with terminal ileal NLH (red, terminal ileal NLH tissue; yellow, insignificant; green, control) as shown by a cladogram.
- Citation: Jiang QL, Lu Y, Zhang MJ, Cui ZY, Pei ZM, Li WH, Lu LG, Wang JJ, Lu YY. Mucosal bacterial dysbiosis in patients with nodular lymphoid hyperplasia in the terminal ileum. World J Gastroenterol 2022; 28(8): 811-824
- URL: https://www.wjgnet.com/1007-9327/full/v28/i8/811.htm
- DOI: https://dx.doi.org/10.3748/wjg.v28.i8.811


