Copyright
©The Author(s) 2022.
World J Gastroenterol. Oct 7, 2022; 28(37): 5483-5493
Published online Oct 7, 2022. doi: 10.3748/wjg.v28.i37.5483
Published online Oct 7, 2022. doi: 10.3748/wjg.v28.i37.5483
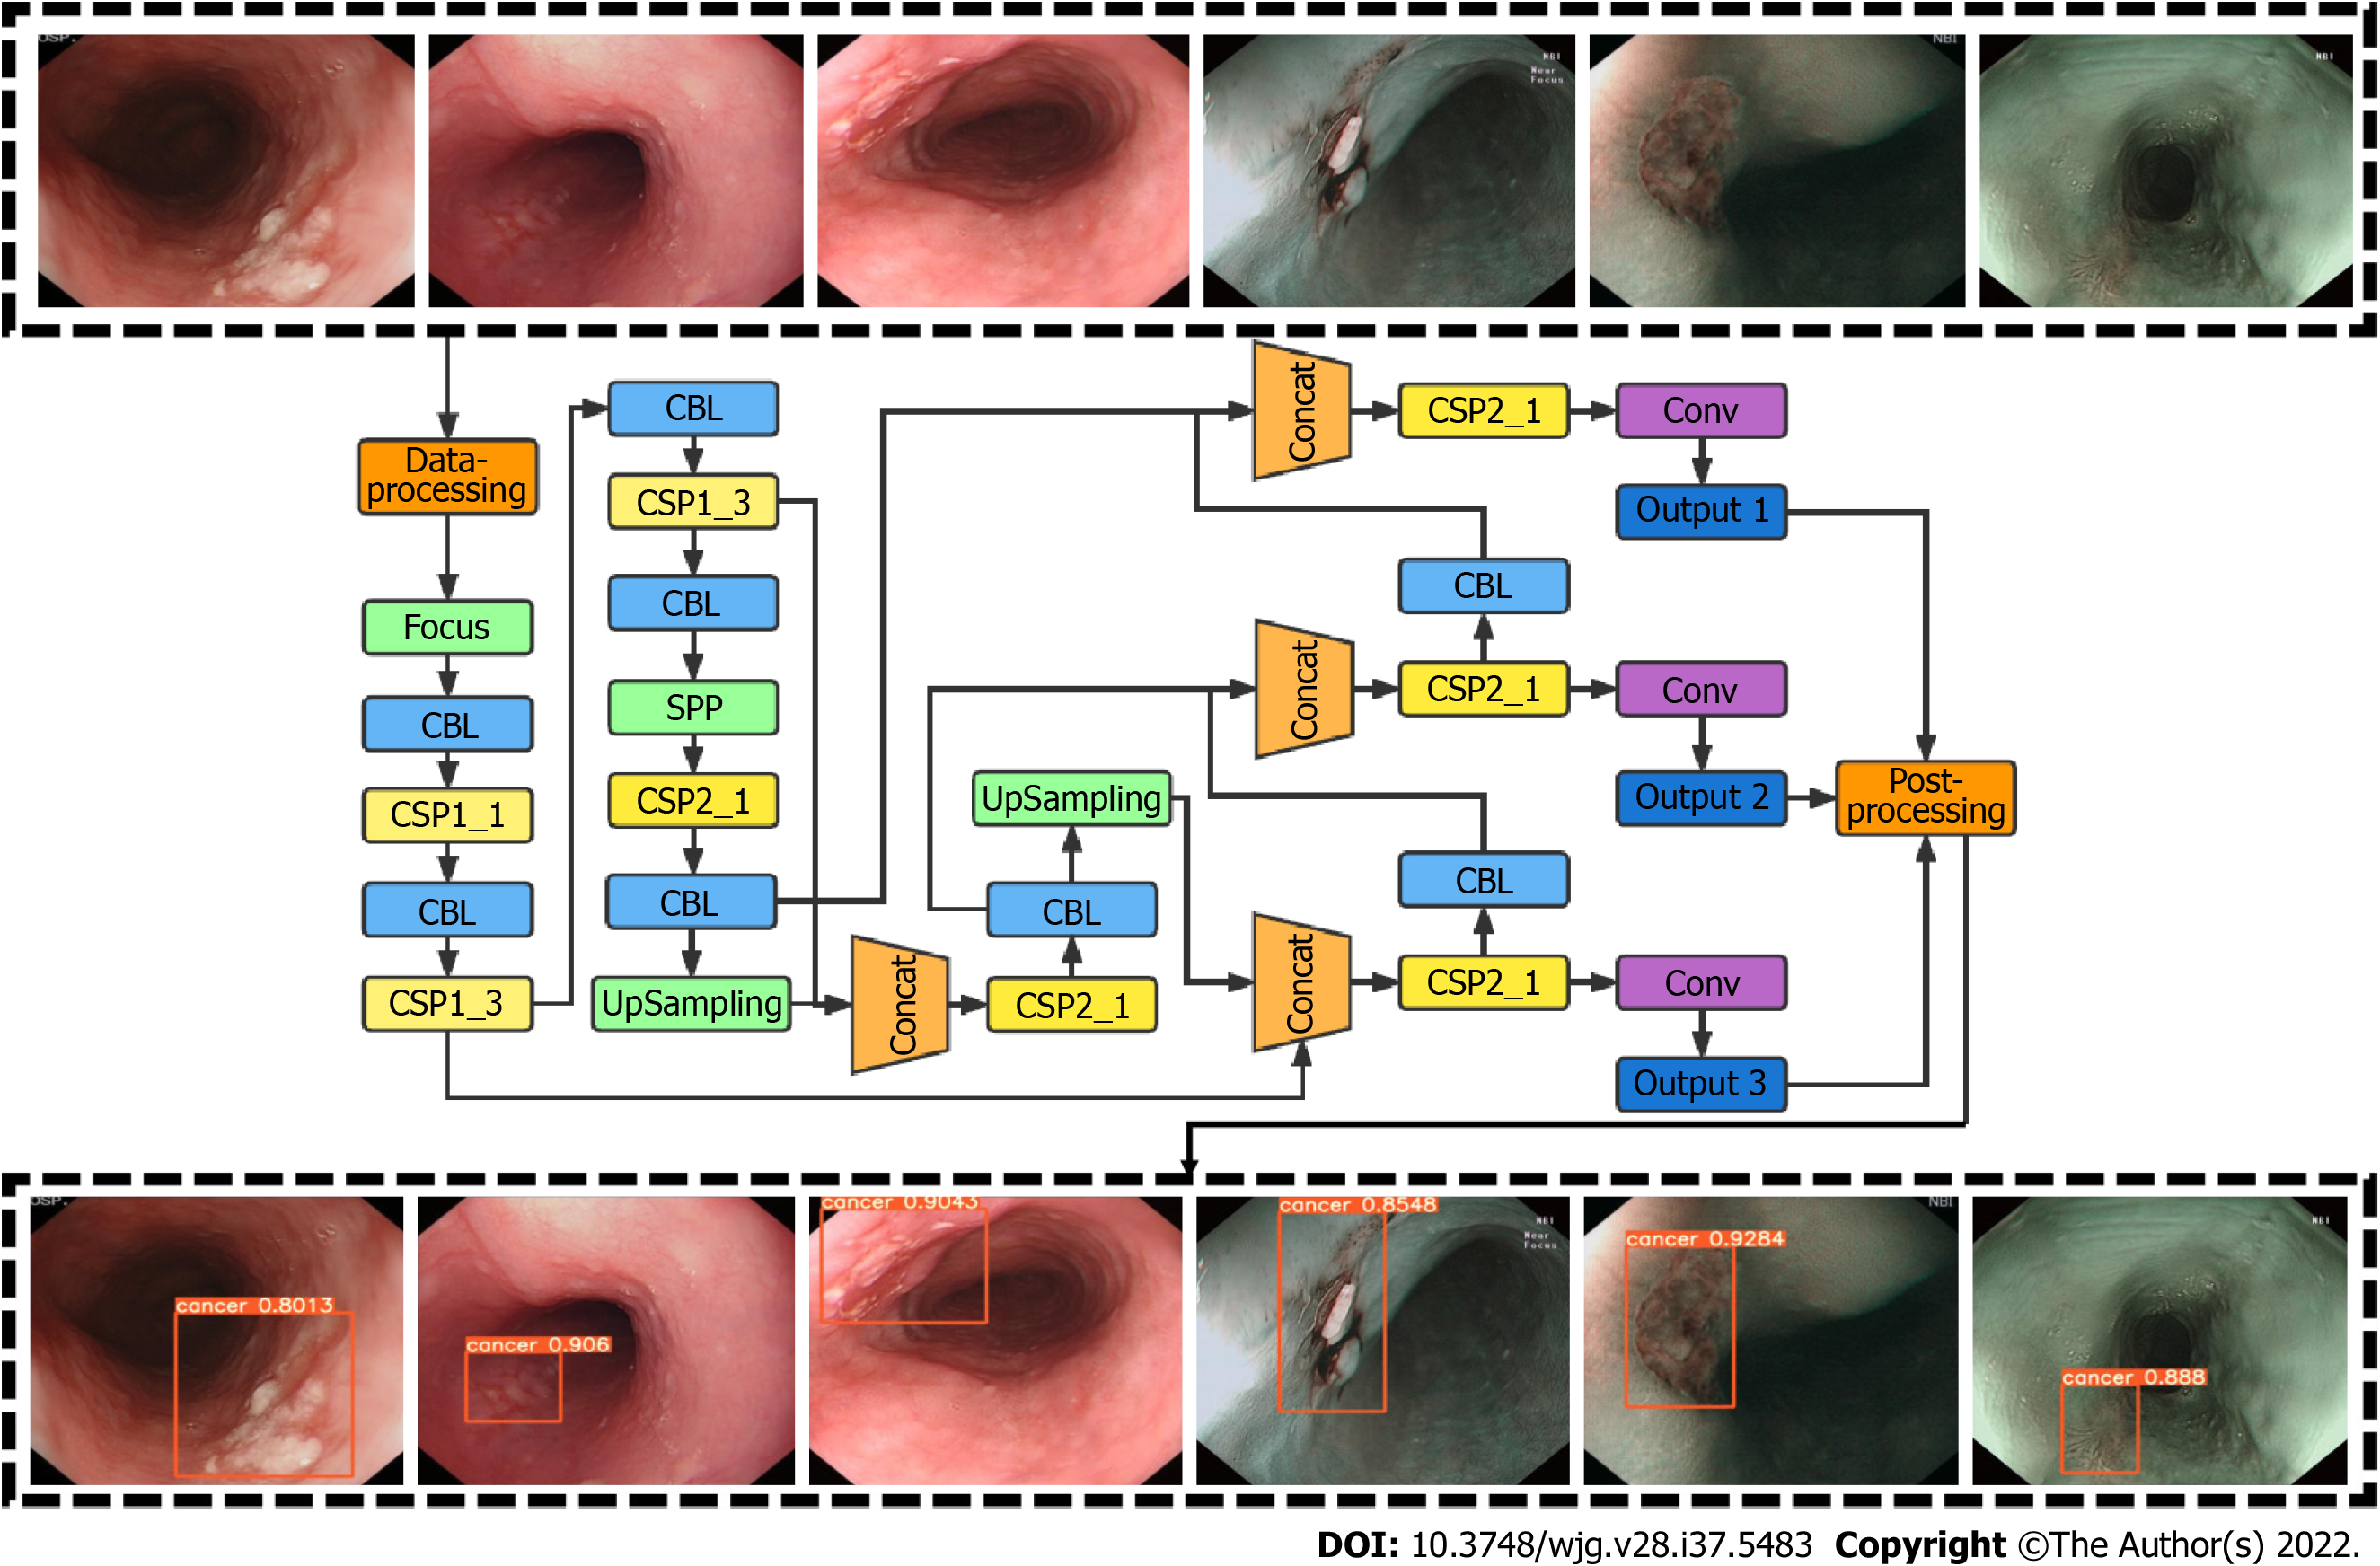
Figure 1 The architecture of the computer-assisted diagnosis system.
The input of this network was the esophageal images, and the output was an indicator frame that captured the interest region, together with the predicted quantitative level of confidence for esophageal squamous cell carcinoma.
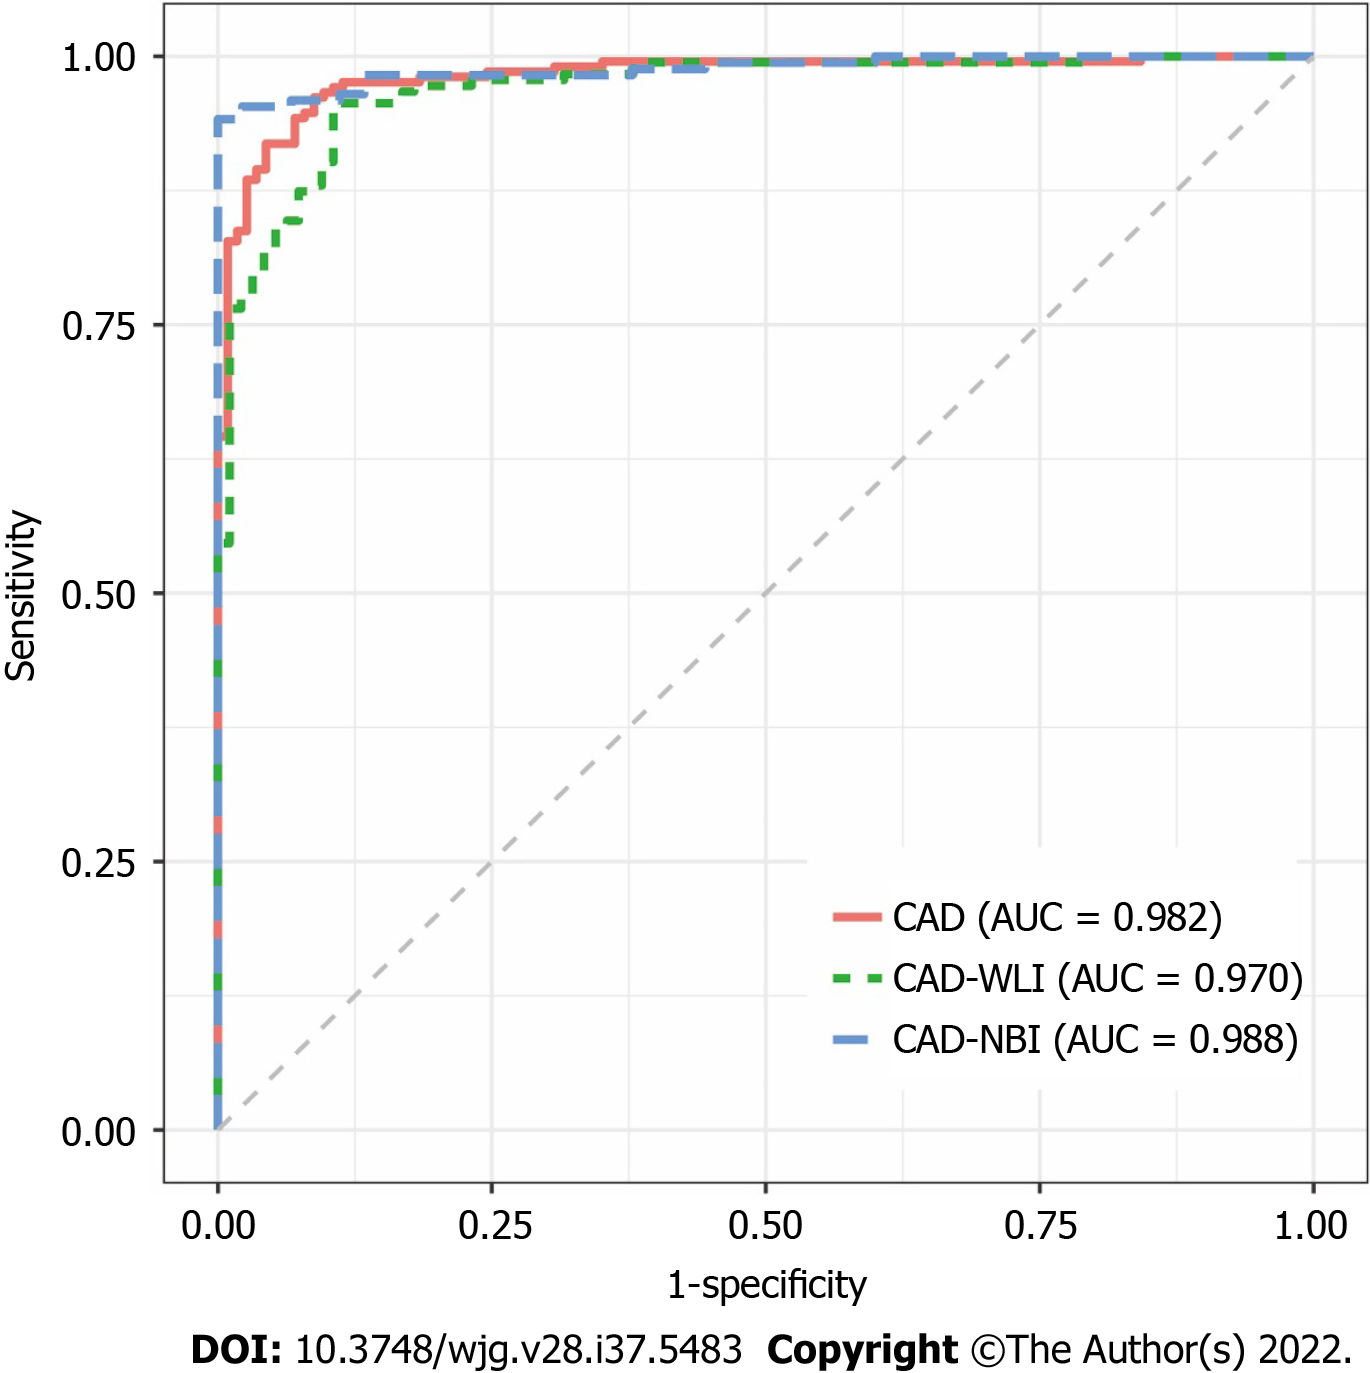
Figure 2 Receiver operating characteristic curve for the computer-assisted diagnosis system in the testing dataset.
CAD: Computer-assisted diagnosis; AUC: Area under the curve; WLI: White light imaging; NBI: Narrow-band imaging.
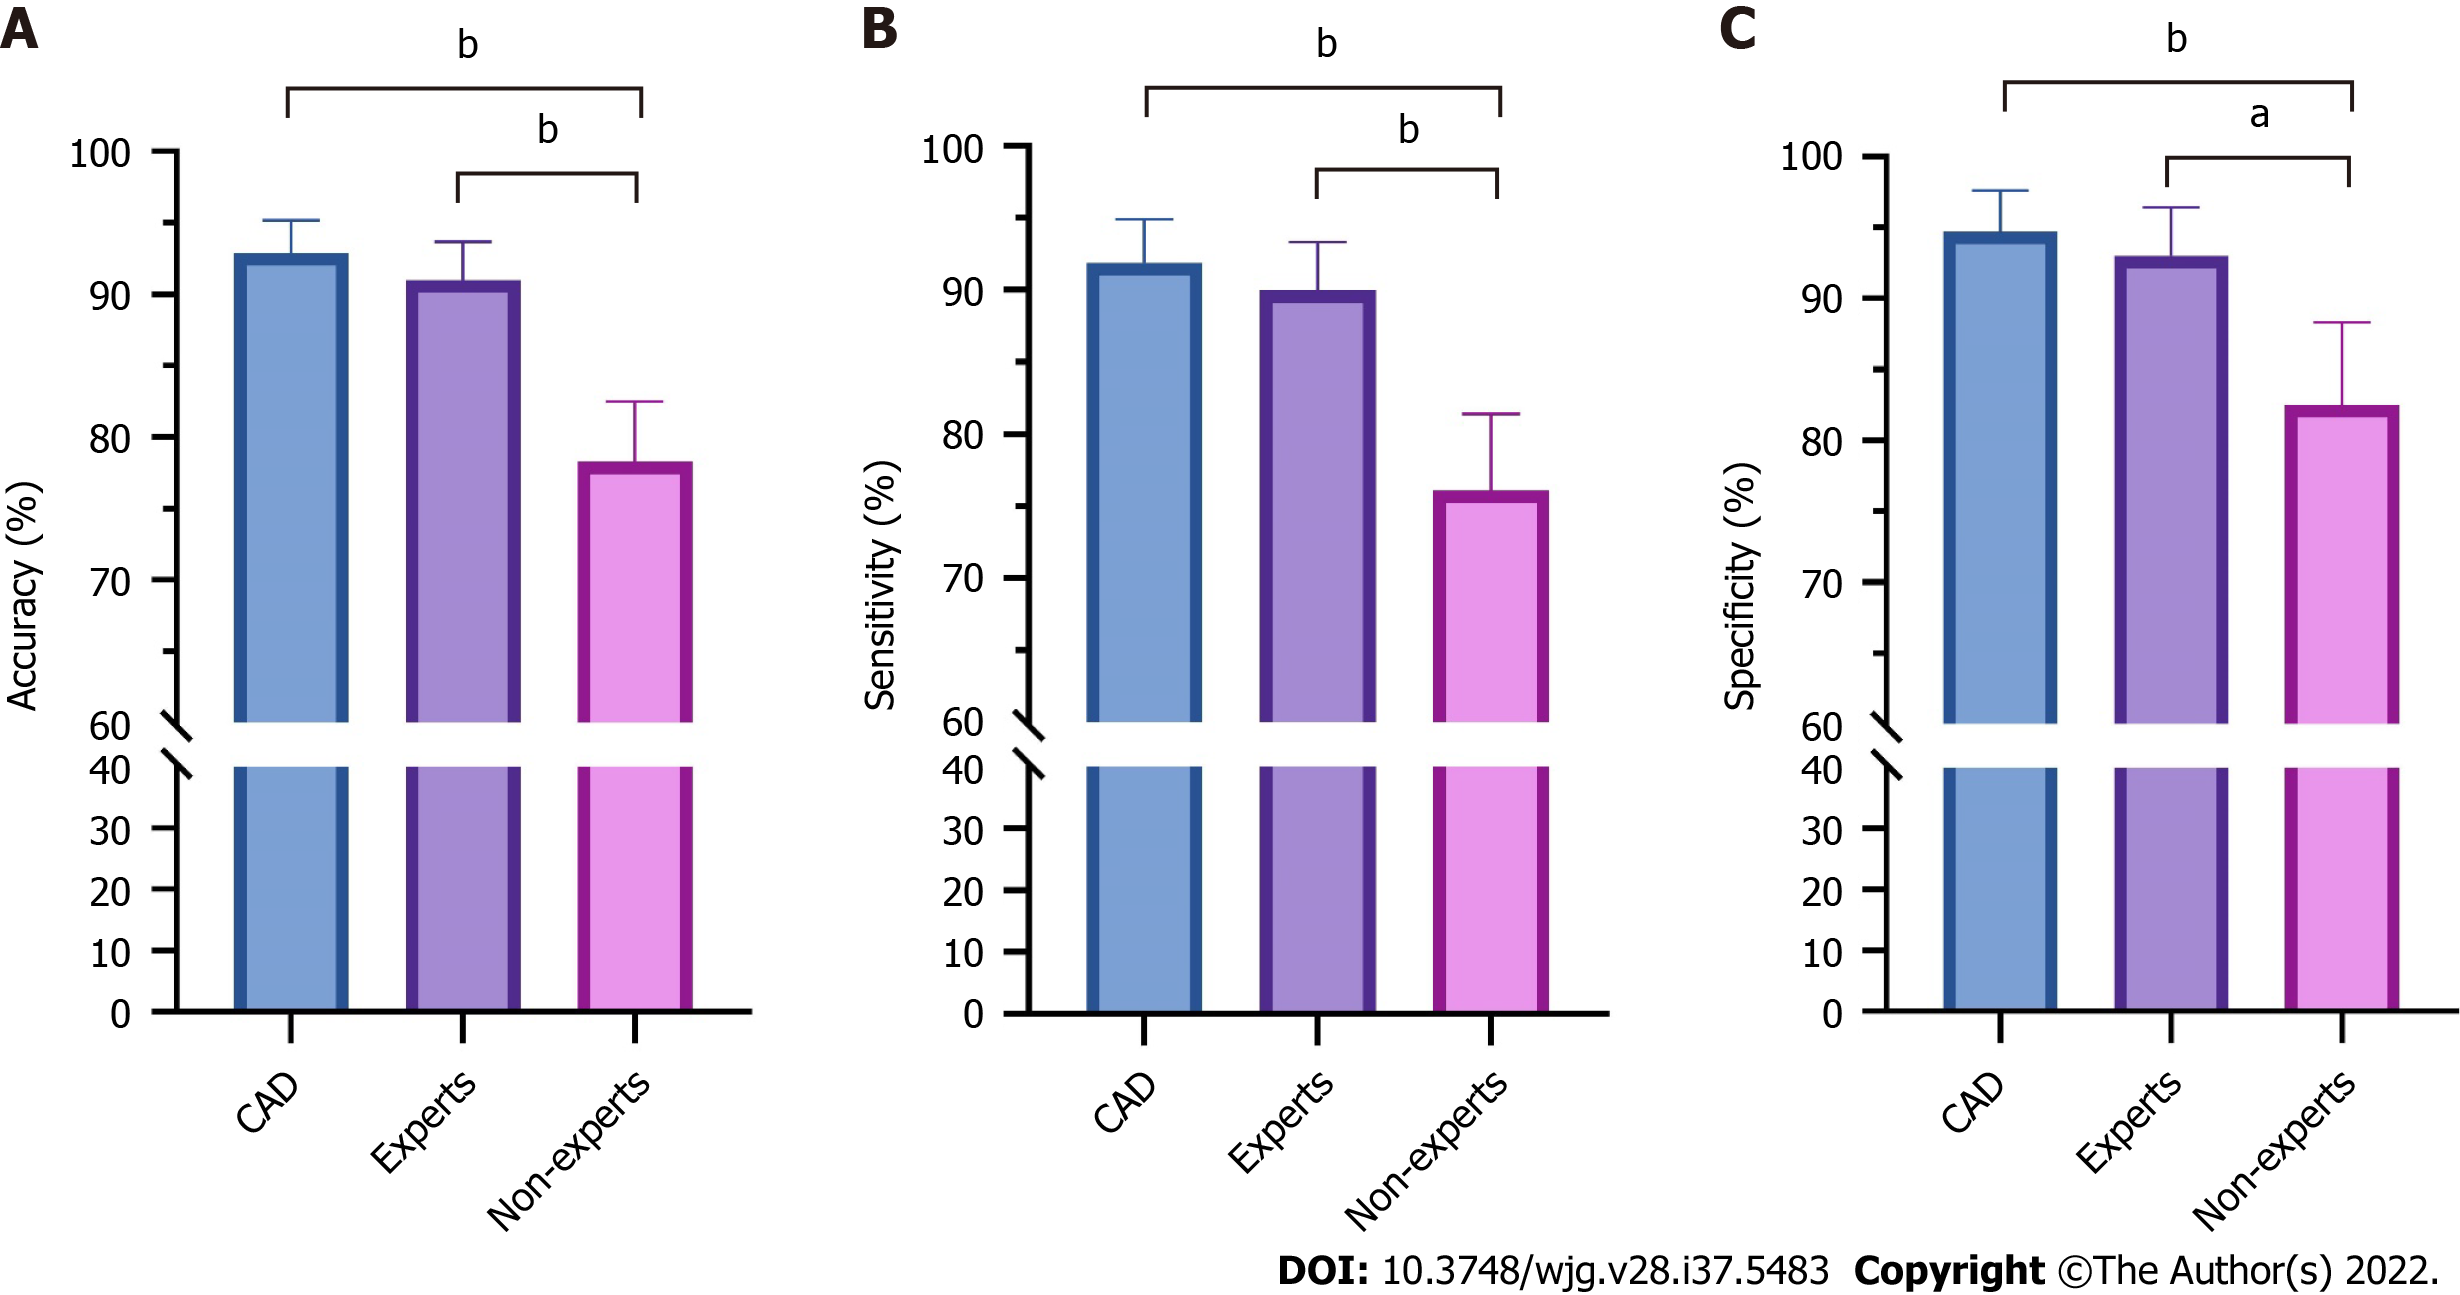
Figure 3 Comparison of diagnostic performances between the computer-assisted diagnosis system and endoscopists for superficial esophageal squamous cell carcinoma.
A: Accuracy; B: Sensitivity; C: Specificity. aP < 0.05; bP < 0.01. CAD: Computer-assisted diagnosis.
Figure 4 The improvements in the diagnostic performance of endoscopists after referring to the results of computer-assisted diagnosis system.
A: Accuracy; B: Sensitivity; C: Specificity. CAD: Computer-assisted diagnosis.
- Citation: Meng QQ, Gao Y, Lin H, Wang TJ, Zhang YR, Feng J, Li ZS, Xin L, Wang LW. Application of an artificial intelligence system for endoscopic diagnosis of superficial esophageal squamous cell carcinoma. World J Gastroenterol 2022; 28(37): 5483-5493
- URL: https://www.wjgnet.com/1007-9327/full/v28/i37/5483.htm
- DOI: https://dx.doi.org/10.3748/wjg.v28.i37.5483


