Copyright
©The Author(s) 2022.
World J Gastroenterol. Aug 7, 2022; 28(29): 3869-3885
Published online Aug 7, 2022. doi: 10.3748/wjg.v28.i29.3869
Published online Aug 7, 2022. doi: 10.3748/wjg.v28.i29.3869
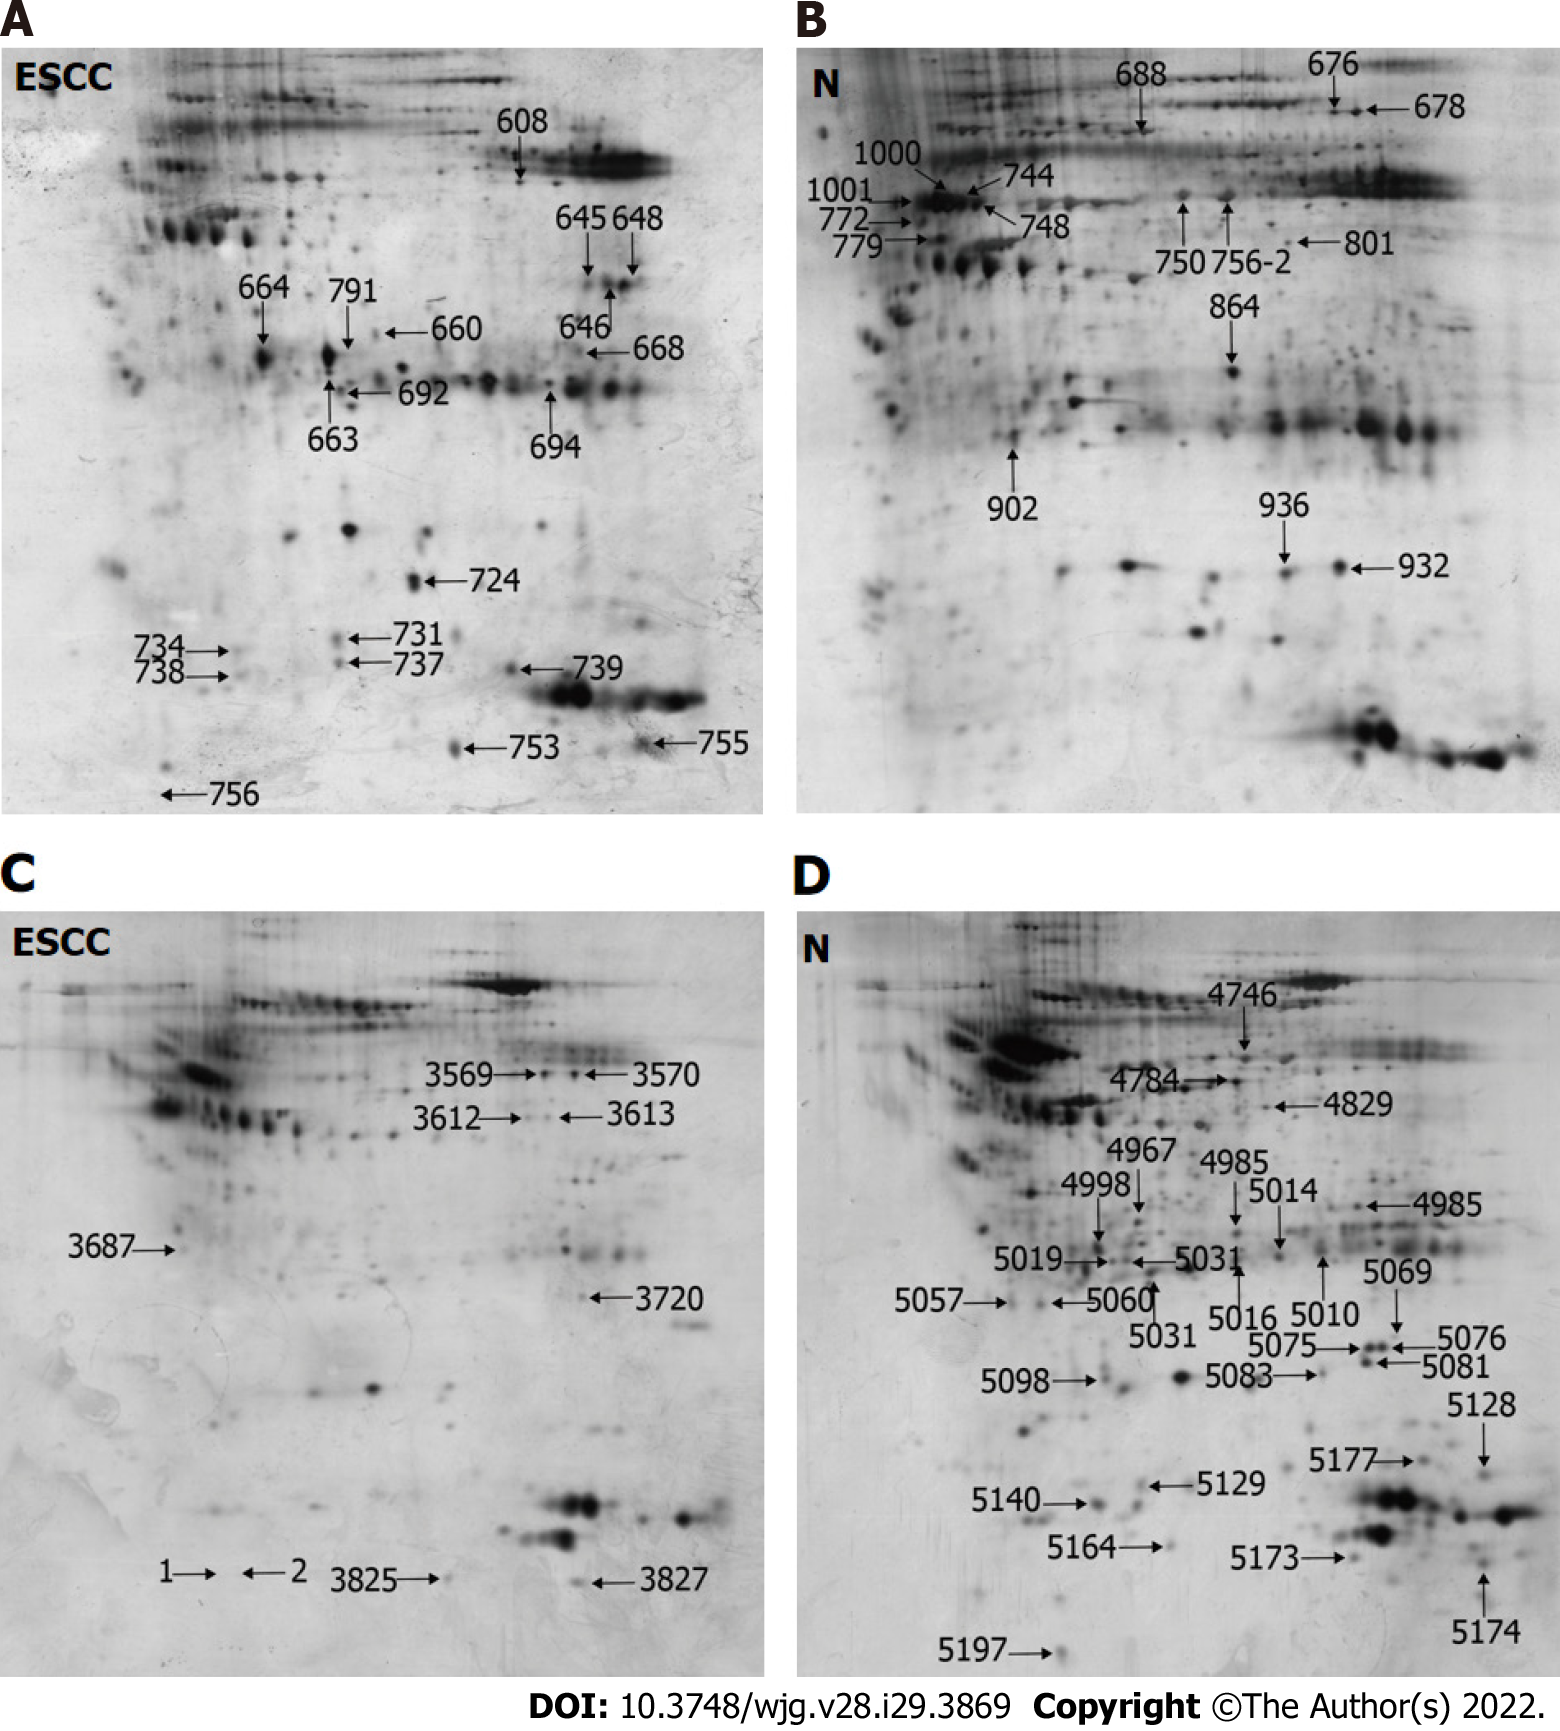
Figure 1 Representative two-dimensional gel electrophoresis images of N-linked glycoproteins from esophageal squamous cell carcinoma (ESCC) and adjacent non-cancerous tissues (N), in which the denoted numbers represent protein spots with differential expression.
A and B: Representative two-dimensional gel electrophoresis (2-DE) images of high-mannose glycoproteins from ESCC (A) and N (B); C and D: Representative 2-DE images of GlcNAc/sialic acid-containing glycoproteins from ESCC (C) and N (D). ESCC: Esophageal squamous cell carcinoma; N: Non-cancerous tissues.
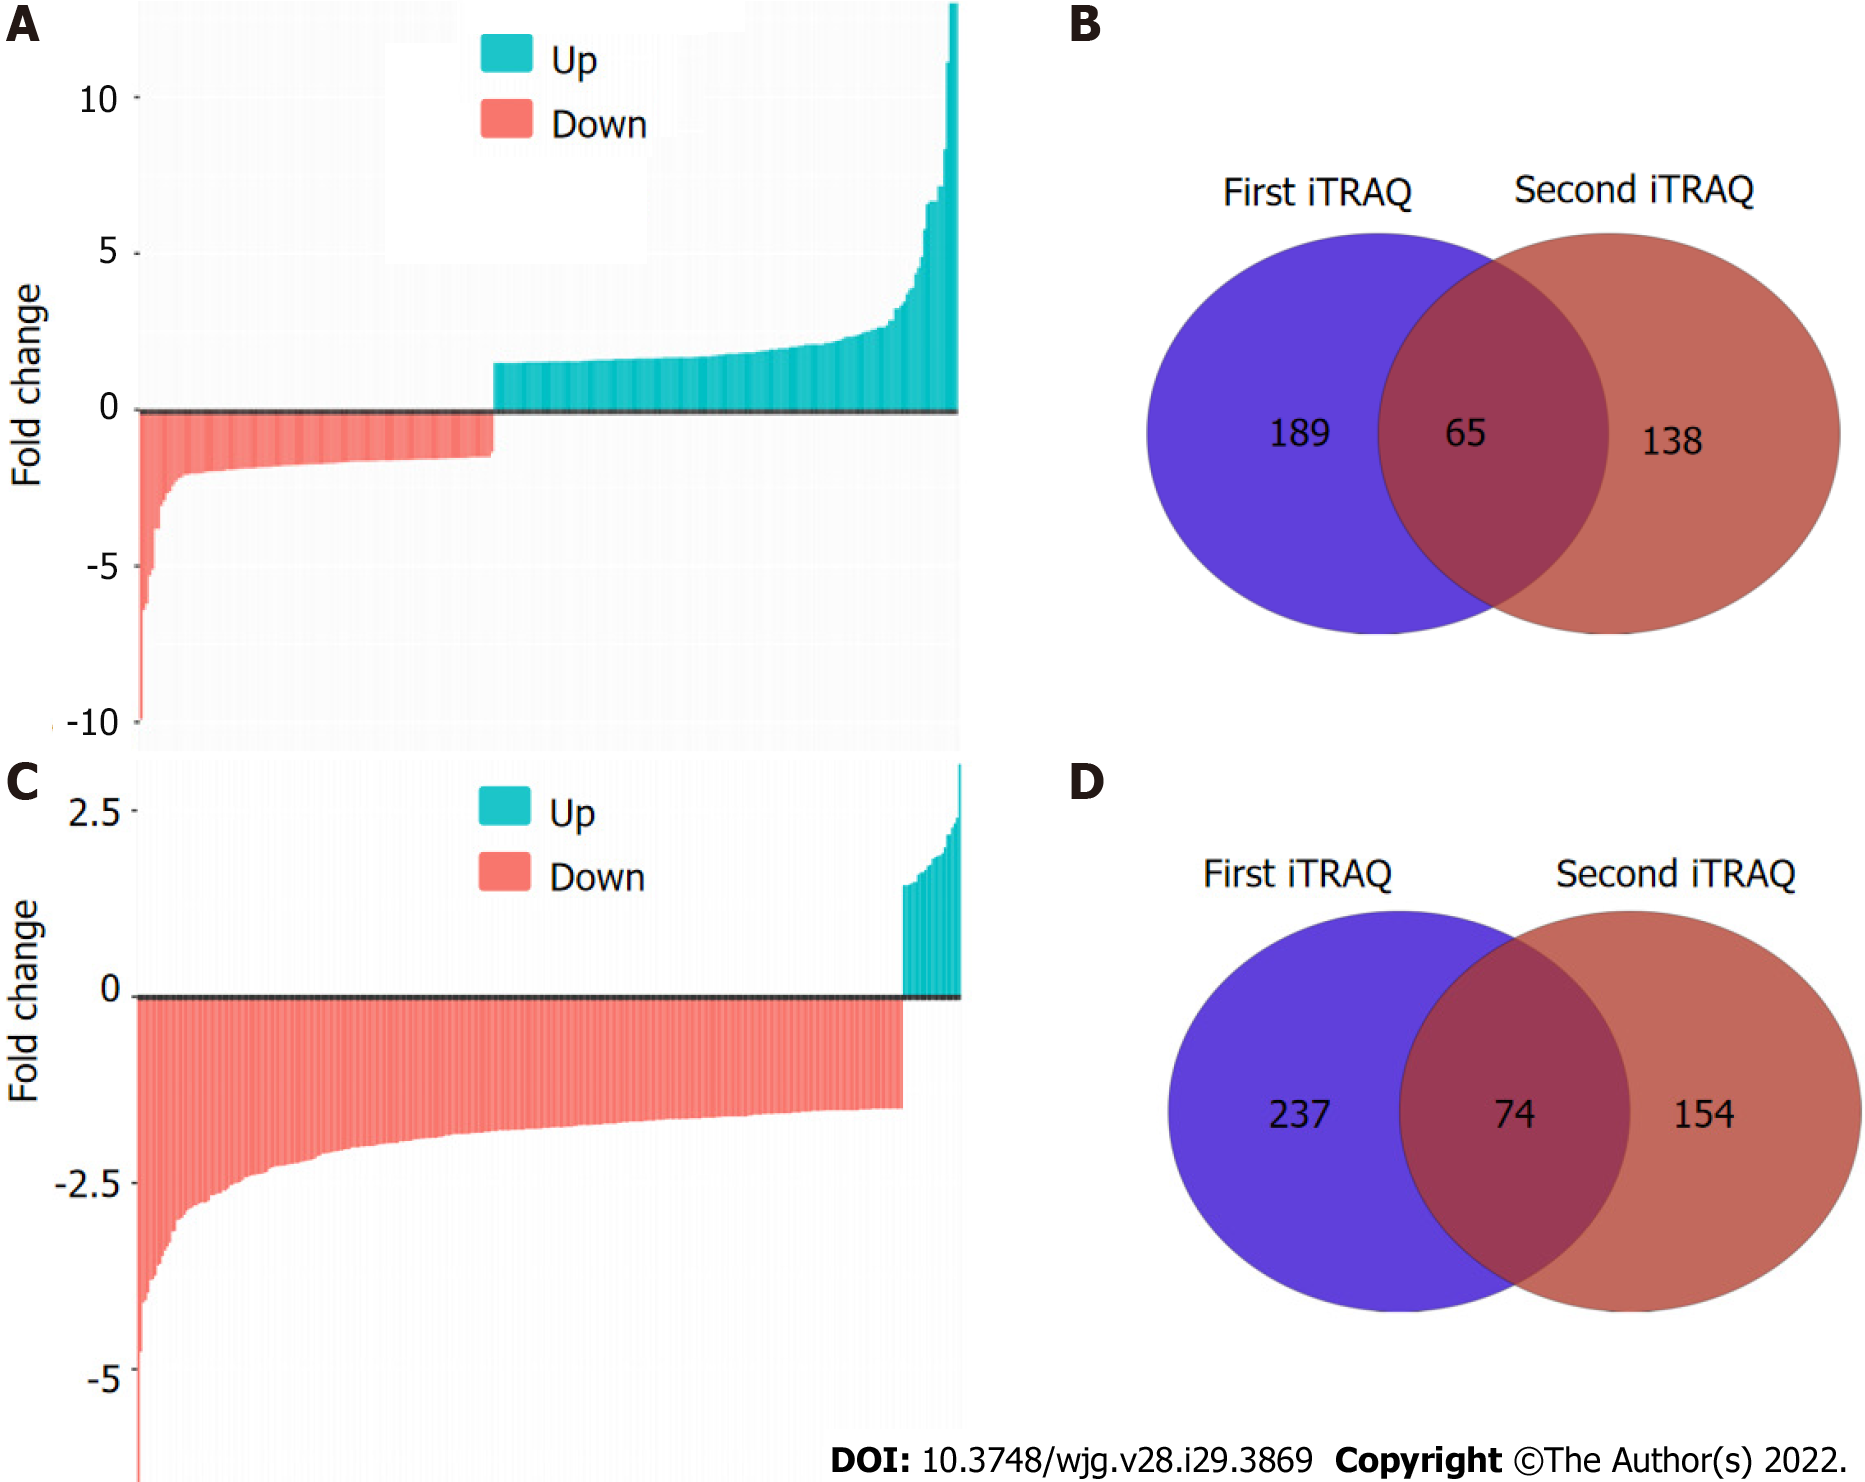
Figure 2 N-linked glycoprotein profiling by isobaric tags for relative and absolute quantification labeling and liquid chromatography electrospray ionisation tandem mass spectrometry/mass spectrometry identification.
A: Waterfall plot shows the differentially expressed high-mannose glycoproteins; B: Venn diagram depicts the unique and overlapped high-mannose glycoproteins identified from two independent replicates; C: Waterfall plot shows the differentially expressed GlcNAc/sialic acid-containing glycoproteins; D: Venn diagram depicts the unique and overlapped GlcNAc/sialic acid-containing glycoproteins identified from two independent replicates. iTRAQ: Isobaric tags for relative and absolute quantification.
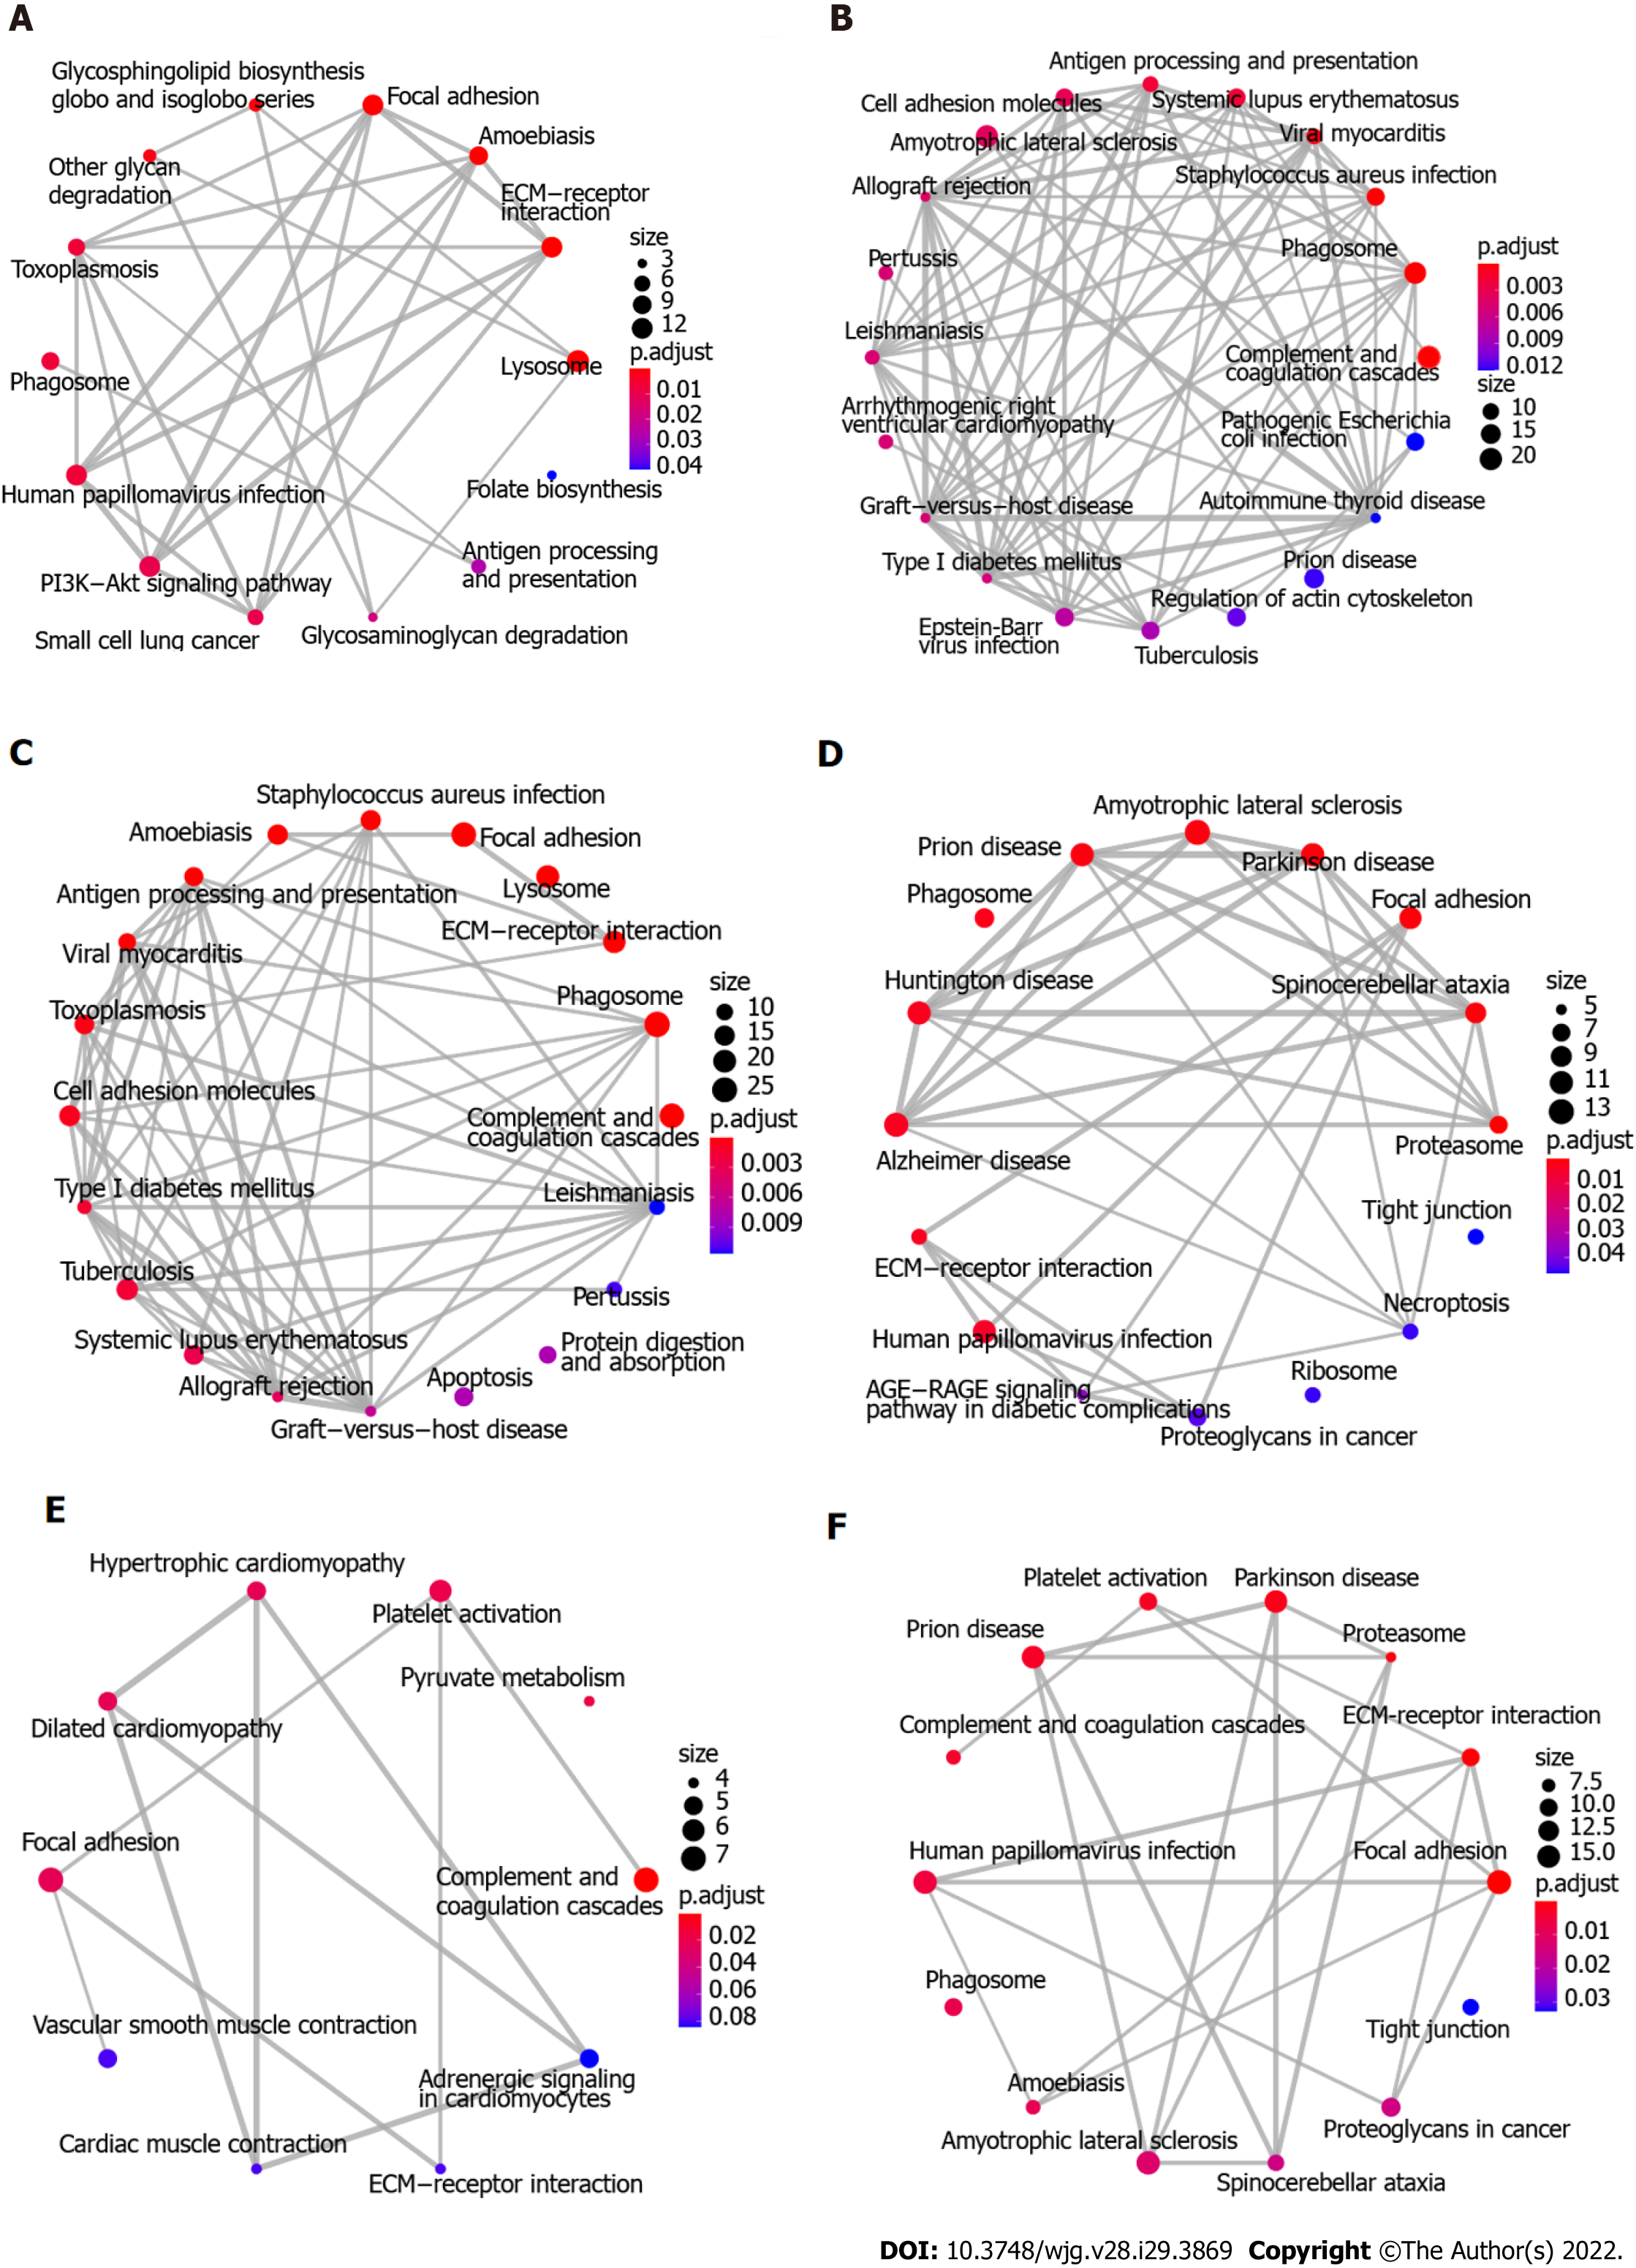
Figure 3 Functional analyses of proteins and glycoproteins with differential expression using enrichment map.
A-C: Kyoto encyclopedia of genes and genomes (KEGG) pathway enrichment analysis using enrichment map shows the significantly enriched biological pathways of up-regulated differentially expressed glycoproteins (DEGs), down-regulated DEGs, and total DEGs, respectively; D-F: KEGG pathway enrichment analysis using enrichment map shows the significantly enriched biological pathways of up-regulated DEPs, down-regulated DEPs, and total DEPs, respectively. KEGG: Kyoto encyclopedia of genes and genomes; DEGs: Differentially expressed glycoproteins; DEPs: Differentially expressed proteins.
Figure 4 Functional analyses of proteins and glycoproteins with differential expression using Proteomap.
A-C: Kyoto encyclopedia of genes and genomes (KEGG) pathway enrichment analysis using Proteomap shows the significantly enriched biological pathways of up-regulated differentially expressed glycoproteins (DEGs), down-regulated DEGs, and total DEGs, respectively; D-F: KEGG pathway enrichment analysis using Proteomap shows the significantly enriched biological pathways of up-regulated DEPs, down-regulated DEPs, and total DEPs, respectively. KEGG: Kyoto encyclopedia of genes and genomes; DEGs: Differentially expressed glycoproteins; DEPs: Differentially expressed proteins.
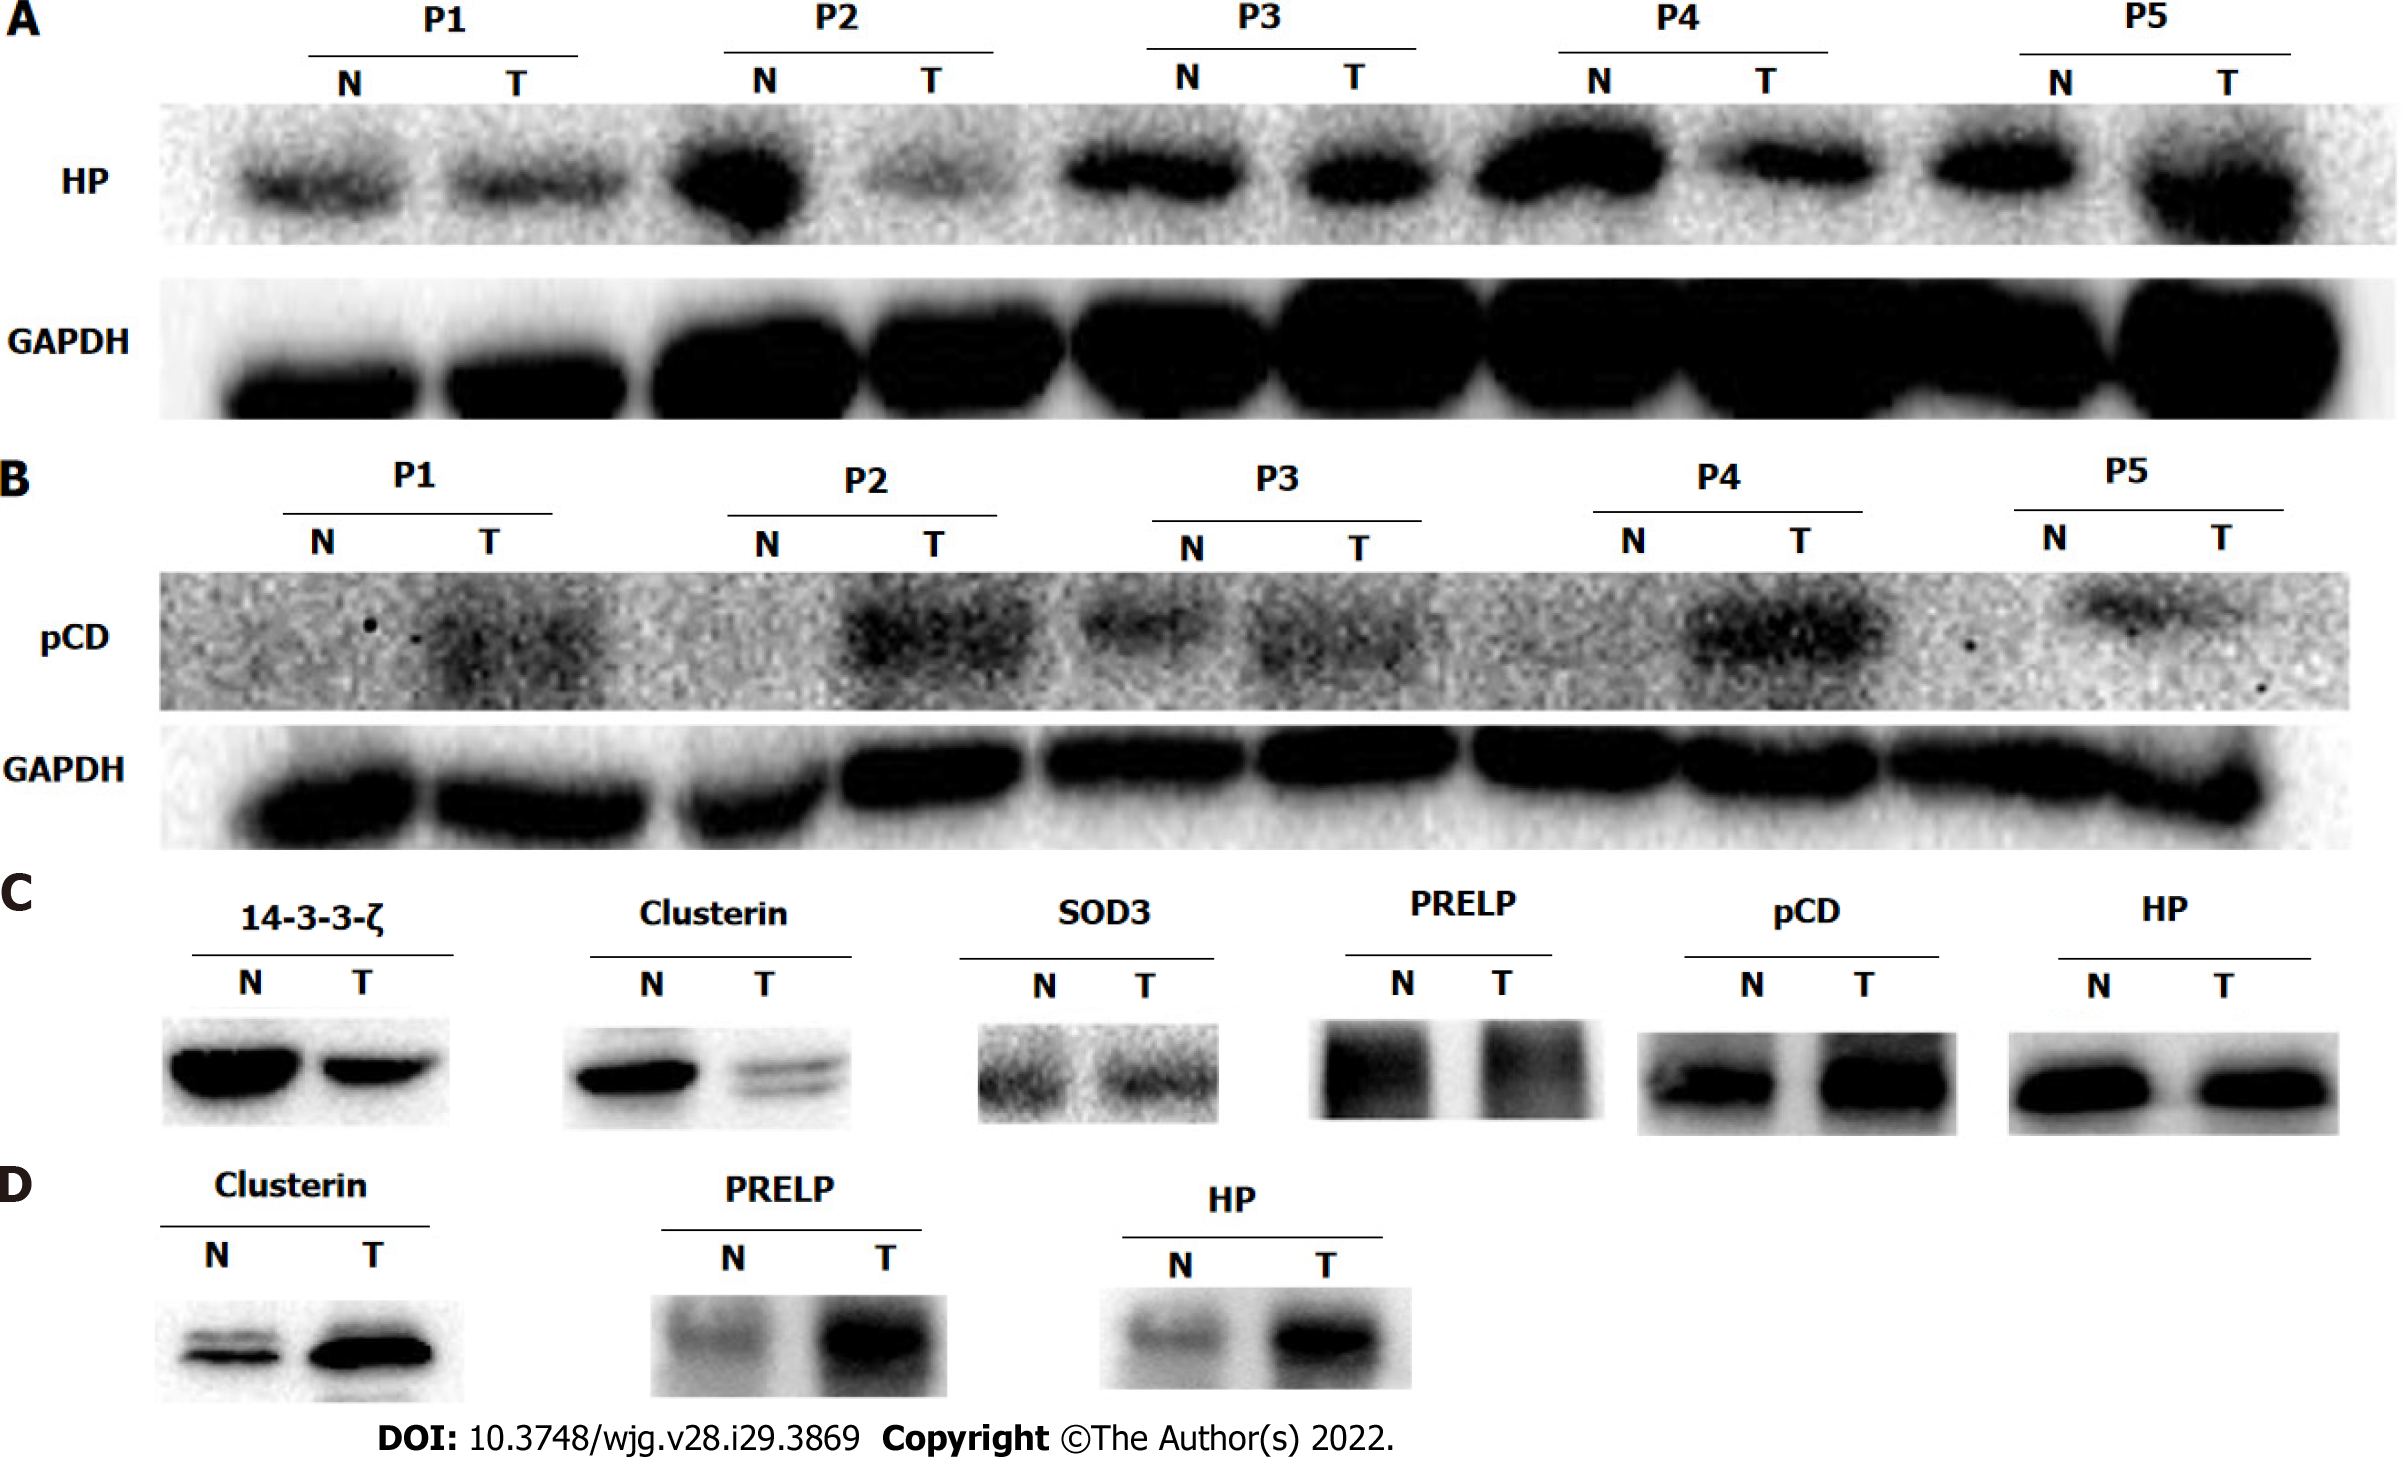
Figure 5 Western blot validations of potential glycoprotein biomarkers.
A and B: Representative Western blot results show haptoglobin (HP) (A) and procathepsin D (pCD) (B) with differential expression between esophageal squamous cell carcinoma (ESCC/T) and adjacent non-cancerous tissues (N); C: Representative Western blot results show the N-linked glycosylated fraction of HP, pCD, clusterin, superoxide dismutase 3 (SOD3), proline-arginine-rich end leucine-rich repeat protein (PRELP), and 14-3-3ζ in ESCC/T and N enriched by corresponding lectins; D: Representative Western blot results show the N-linked glycosylated fractions of clusterin, PRELP, and HP in serum of patients with ESCC/T and healthy controls. The results are representative of three independent experiments. ESCC/T: Esophageal squamous cell carcinoma; HP: Haptoglobin; pCD: Procathepsin D; SOD3: Superoxide dismutase 3; PRELP: Proline-arginine-rich end leucine-rich repeat protein.
- Citation: Liu QW, Ruan HJ, Chao WX, Li MX, Jiao YL, Ward DG, Gao SG, Qi YJ. N-linked glycoproteomic profiling in esophageal squamous cell carcinoma. World J Gastroenterol 2022; 28(29): 3869-3885
- URL: https://www.wjgnet.com/1007-9327/full/v28/i29/3869.htm
- DOI: https://dx.doi.org/10.3748/wjg.v28.i29.3869


