Copyright
©The Author(s) 2022.
World J Gastroenterol. Jul 14, 2022; 28(26): 3132-3149
Published online Jul 14, 2022. doi: 10.3748/wjg.v28.i26.3132
Published online Jul 14, 2022. doi: 10.3748/wjg.v28.i26.3132
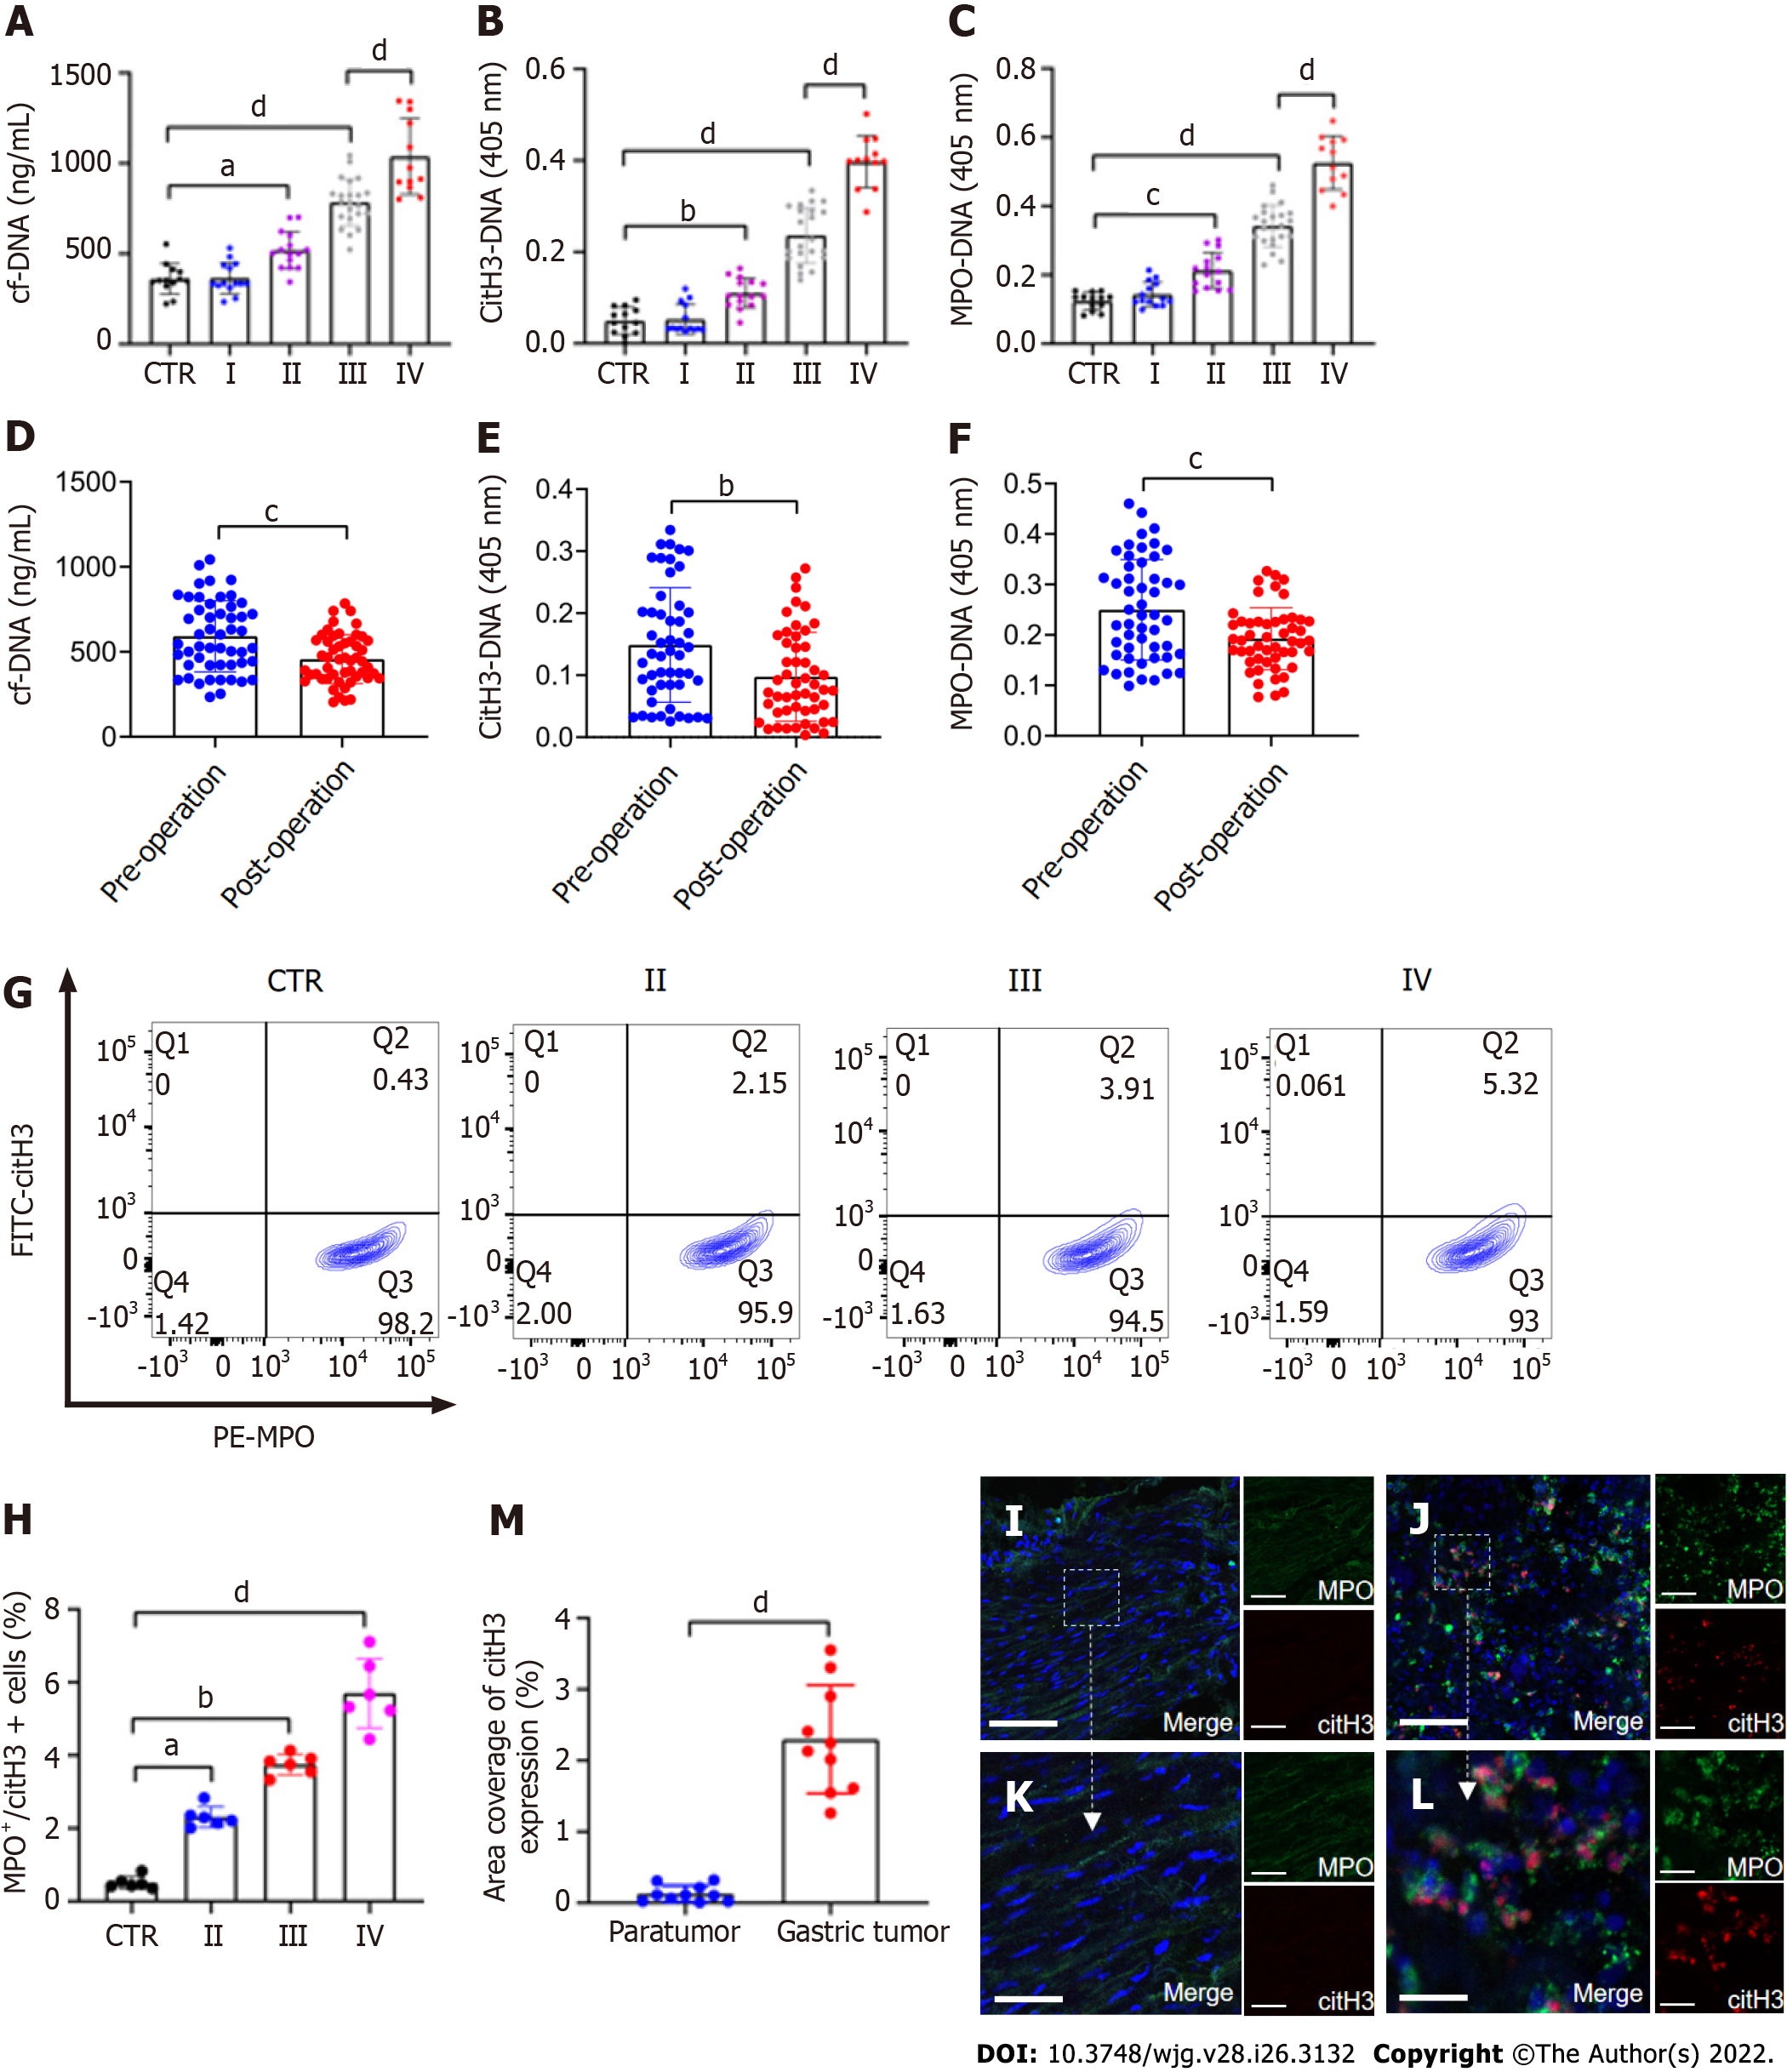
Figure 1 NETs are accumulated in samples of GC patients.
A–C: Plasma levels of NET markers cf-DNA, citH3-DNA, and MPO-DNA in GC patients and healthy individuals were measured by ELISA. Healthy individuals, n = 13; stage I, n = 14; II, n = 15; III, n = 22; IV, n = 12; D-F: Comparison of cf-DNA, citH3-DNA and MPO-DNA in the plasma of patients with GC preoperatively and postoperatively by ELISA. n = 51; G and H: The rate of activated neutrophils in the circulating environment of GC patients and healthy individuals was measured by flow cytometry with APC-MPO and FITC-citH3 staining. Each group: n = 6; I and J: NET accumulation was detected by confocal microscopy with MPO and citH3 staining in paratumor and tumor samples from the same GC patient. Magnification 20×; scale bars: 50 μm. Red-citH3, Green-MPO and Blue-DAPI; K and L: Magnified (40×) part of MPO and citH3 colocation in paratumor and tumor samples from the same patient. Scale bars: 10 μm. Red-citH3, Green-MPO and Blue-DAPI; M: The percentage of area coverage of citH3 expression was defined as the rate of red area in total area and analyzed with ImageJ software; all values are the mean ± SD. aP < 0.05; bP < 0.01; cP < 0.001; dP < 0.0001. NET: Neutrophil extracellular trap; GC: Gastric cancer; cf-DNA: Cell-free DNA; MPO: Myeloperoxidase; citH3: Citrullinated histone H3.
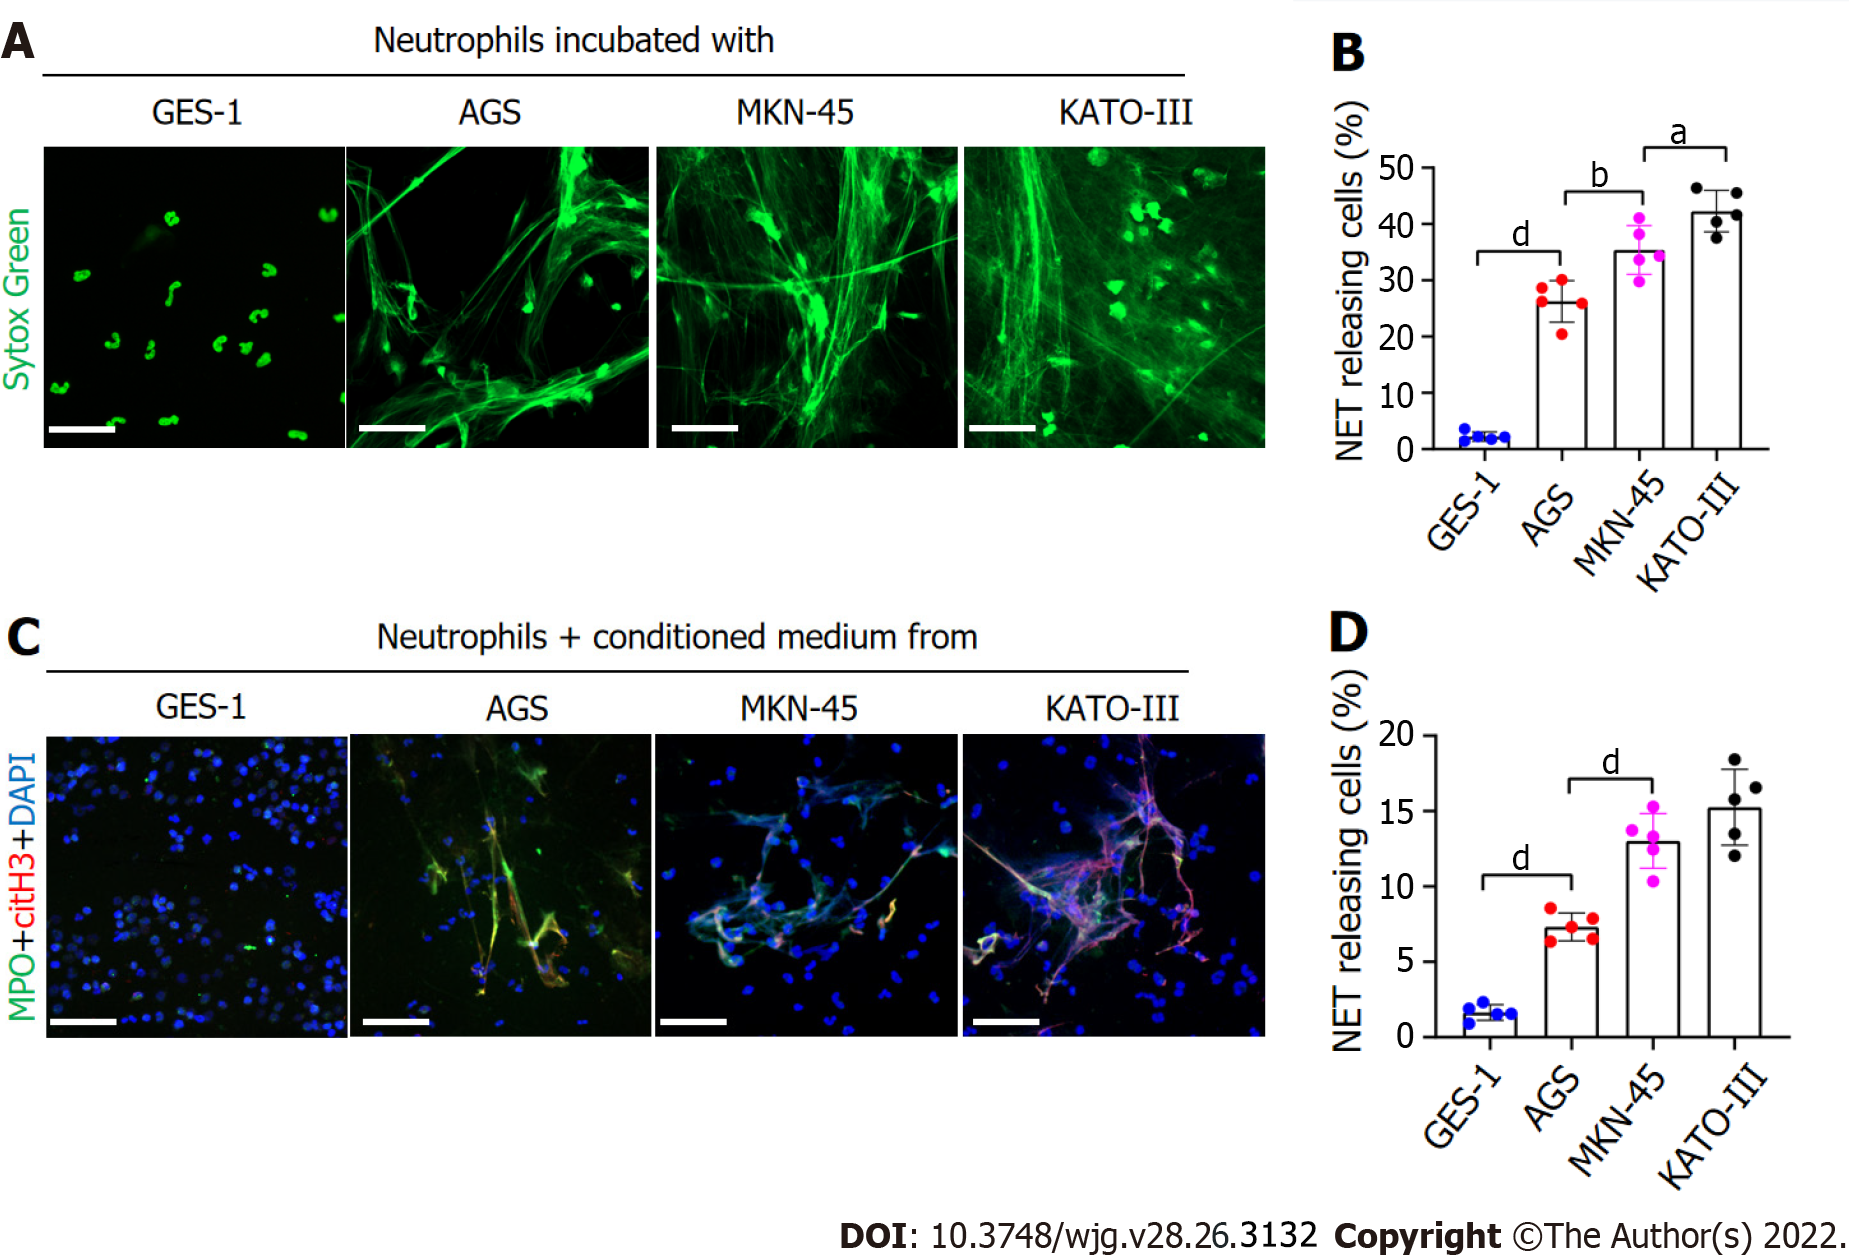
Figure 2 GC cells can stimulate neutrophils to form NETs.
A and B: Control neutrophils were cocultured with normal gastric mucosal epithelial cells (GES-1) or GC cells (AGS, MKN-45 and KATO-III) and NET formation was measured by confocal microscopy with cell-impermeable Sytox-Green staining. Magnification 20×; scale bars: 50 μm. Green: Neutrophils; C and D: Control neutrophils were cocultured with CM from GES-1 or GC cells, and stained with MPO and citH3. The percentage of NET-releasing cells was defined as the ratio of the calculated NET releasing neutrophils to the total number of neutrophils. Magnification 20×; scale bars: 50 μm. Red-citH3, Green-MPO, and Blue-DAPI. All values are the mean ± SD. aP < 0.05; bP < 0.01; cP < 0.001; dP < 0.0001. GC: Gastric cancer; GES-1: Gastric mucosal epithelial cells; NET: Neutrophil extracellular trap; CM: Conditioned medium; MPO: Myeloperoxidase; citH3: Citrullinated histone H3.
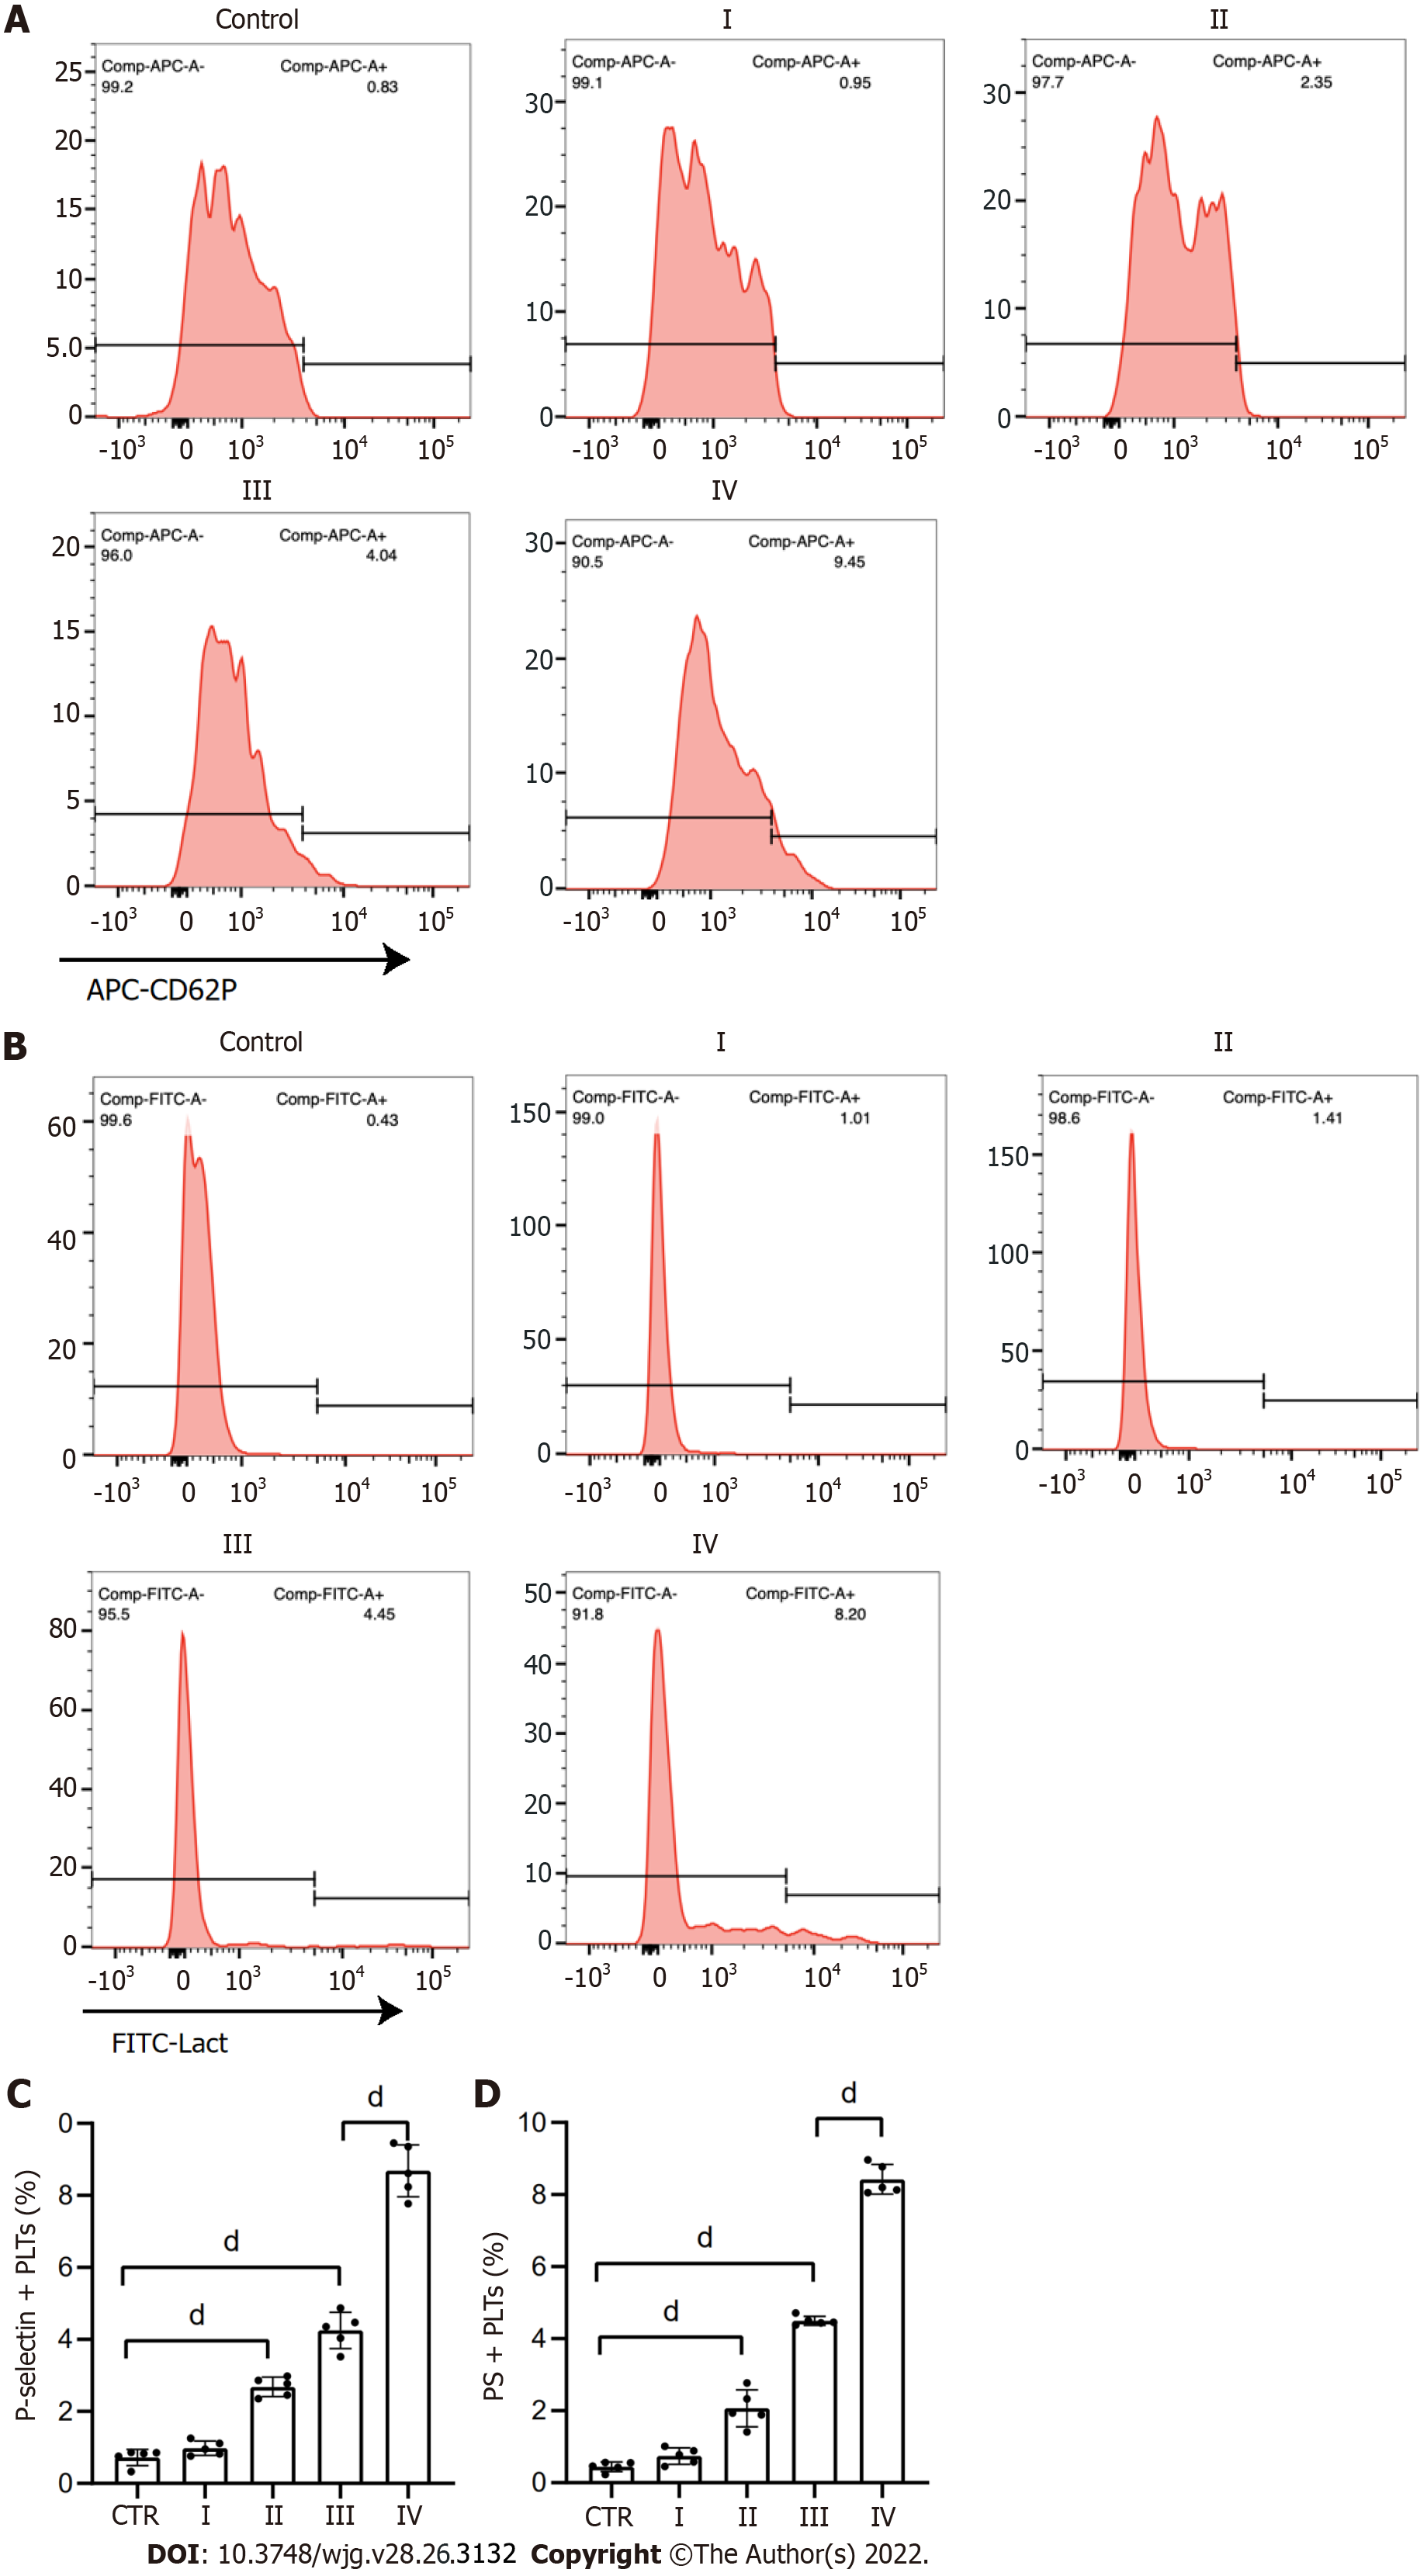
Figure 3 Platelets are activated in patients with GC.
A and C: Flow cytometry showed the rate of P-selectin-positive platelets from each stage GC patients and healthy individuals; B and D: Rate of phosphatidylserine-positive platelets from each stage GC patients and healthy individuals. All values are the mean ± SD. dP < 0.0001. PS: Phosphatidylserine; GC: Gastric cancer. CD62P: P-selectin; Lact: Lactadherin.
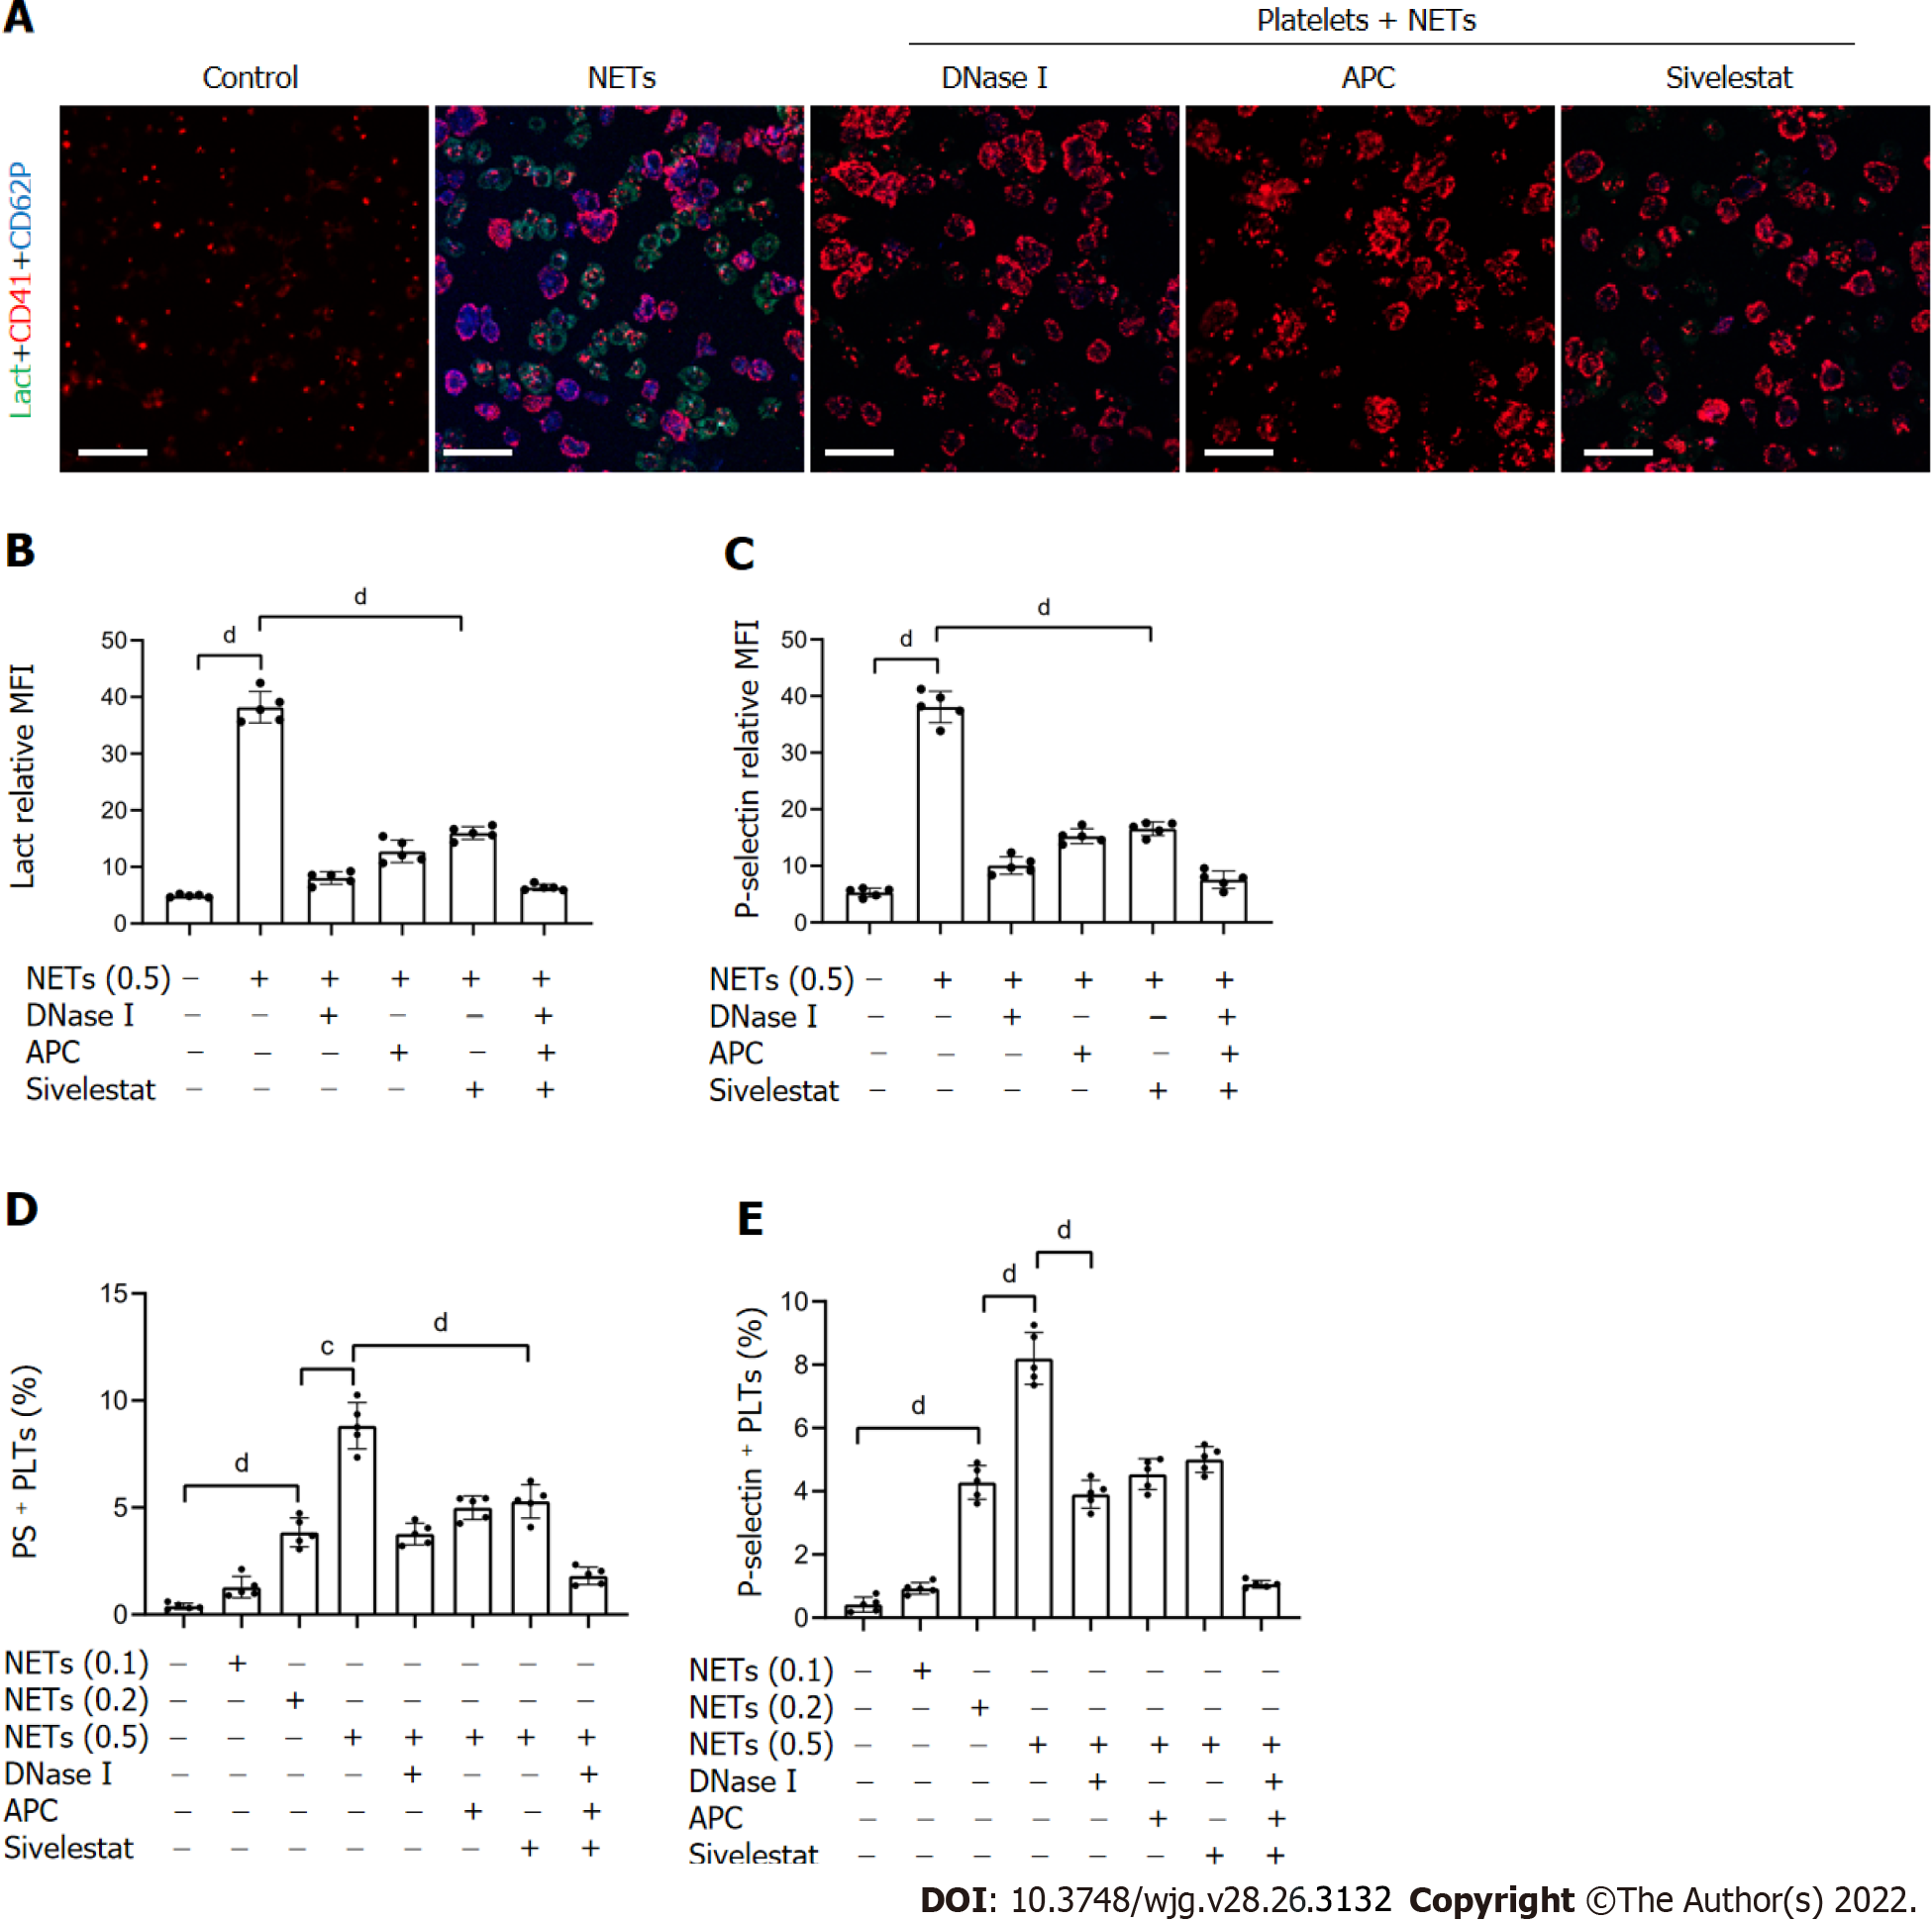
Figure 4 NETs contribute to hypercoagulation of platelets.
A: PS exposure and P-selectin expression were measured when isolated platelets were cocultured with BETs (μg, DNA/mL) or in the presence of DNase I, activated protein C, and sivelestat alone or together by confocal microscopy. Magnification 63×; scale bars: 10 μm. Red-platelets, Green-Lactadherin, and Blue-P-selectin; B and C: PS exposure and P-selectin expression are indicated as MFI. MFI was defined as the ratio of total fluorescence intensity to the area; D and E: The rates of PS-positive platelets and P-selectin-positive platelets were detected by flow cytometry. All values are the mean ± SD. cP < 0.001; dP < 0.0001. PS: Phosphatidylserine; GC: Gastric cancer; DNase I: Deoxyribonuclease I; APC: Activated protein C; MFI: Mean fluorescence intensity; Lact: Lactadherin; CD41: Platelet; NET: Neutrophil extracellular trap.
Figure 5 NETs promote platelet adhesion and prothrombotic state.
A: Isolated platelets were incubated on glass slides which were coated with 1% dBSA, NETs (μg DNA/mL), or NETs pretreated with DNase I, APC, and sivelestat alone or together, followed by the F-actin components of platelets with 594-phalloidin staining. Magnification 63×; scale bars: 10 μm. Red-platelets; B: The percentage of area coverage of platelet adhesion was defined as the rate of red area in the total area and analyzed with ImageJ software; C: Isolated platelets were cocultured with different concentrations of NETs for 30 min with or without DNase I, APC and sivelestat treatment alone or together, and plasma fibrin formation was tested using turbidity measurements and monitored OD at 405 nm; D: TAT complex level of activated platelets was analyzed by ELISA. All values are the mean ± SD. aP < 0.05; bP < 0.01; cP < 0.001; dP < 0.0001. dBSA: Denatured bovine serum albumin; NETs: Neutrophil extracellular traps; DNase I: Deoxyribonuclease I; APC: Activated protein C; TAT: Thrombin–antithrombin.
Figure 6 NETs drive hypercoagulation of ECs.
A: ECs were cocultured with NETs (μg DNA/mL) or PBS in the presence of DNase I, APC, or sivelestat alone or together for 4 h and analyzed by confocal microscopy. The intercellular junctions of ECs were stained with VE–cadherin and phalloidin. Magnification 63×; scale bars: 10 μm. Red-phalloidin, Green-VE, and Blue-DAPI; B: EC activation was stained with CD31 and TF. Magnification 63×; scale bars: 10 μm. Red-TF, Green-CD31, and Blue-DAPI; C and D: VE–cadherin expression and TF expression on ECs were detected by confocal microscopy and analyzed with ImageJ software (expression indicated as MFI). MFI was defined as the ratio of total fluorescence intensity to the area; E and F: EC monolayers were stimulated with various concentrations of NETs for 4 h, followed by determination of fibrin formation by turbidity measurement at 405 nm, and the TAT complex level was detected by ELISA. All values are the mean ± SD. aP < 0.05; bP < 0.01; cP < 0.001; dP < 0.0001. NETs: Neutrophil extracellular traps; ECs: Endothelial cells; DNase I: Deoxyribonuclease I; APC: Activated protein C; TF: Tissue factor; TAT: Thrombin–antithrombin; MFI: Mean fluorescence intensity.
Figure 7 Tumor-bearing mice show a greater ability to form thrombi by inferior vena cava flow restriction.
A and B: The values for weight and length of thrombi present in control, tumor-bearing mice, DNase I infused tumor-bearing mice at 6 h after surgery. Each group, n = 9; C and D: Values for weight and length of thrombi present in mice at 48 h after surgery. Each group, n = 5; E and F: Confocal imaging of thrombi derived from control mice and tumor-bearing mice with Ly6G and citH3 staining. Magnification 10×; scale bars: 200 μm. Red-Ly6G, Green-citH3, and Blue-DAPI; G and H: Magnified (40×) part of thrombi derived from control mice and tumor-bearing mice. Scale bars: 50 μm. Red-Ly6G, Green-citH3, and Blue-DAPI; I and J: Fibrin formation levels in the plasma of control, tumor-bearing mice, or DNase-I-infused tumor-bearing mice were detected by turbidity measurement at 405 nm, and TAT complex levels were detected by ELISA. Each group, n = 8. All values are the mean ± SD. aP < 0.05; bP < 0.01; cP < 0.001; dP < 0.0001. DNase I: Deoxyribonuclease I; TAT: Thrombin–antithrombin.
- Citation: Li JC, Zou XM, Yang SF, Jin JQ, Zhu L, Li CJ, Yang H, Zhang AG, Zhao TQ, Chen CY. Neutrophil extracellular traps participate in the development of cancer-associated thrombosis in patients with gastric cancer. World J Gastroenterol 2022; 28(26): 3132-3149
- URL: https://www.wjgnet.com/1007-9327/full/v28/i26/3132.htm
- DOI: https://dx.doi.org/10.3748/wjg.v28.i26.3132


