Copyright
©The Author(s) 2021.
World J Gastroenterol. Sep 21, 2021; 27(35): 5967-5977
Published online Sep 21, 2021. doi: 10.3748/wjg.v27.i35.5967
Published online Sep 21, 2021. doi: 10.3748/wjg.v27.i35.5967
Figure 1 Computed tomography scans of the right hepatic lobe of a 72-year-old male patient with PEComa (patient 10).
A: Plain computed tomography scan showing an irregular soft tissue density shadow; B: Enhanced scan showing obvious enhancement of the mass margin and of central heterogeneity in the arterial phase; C: Portal vein scan showing a low mass density.
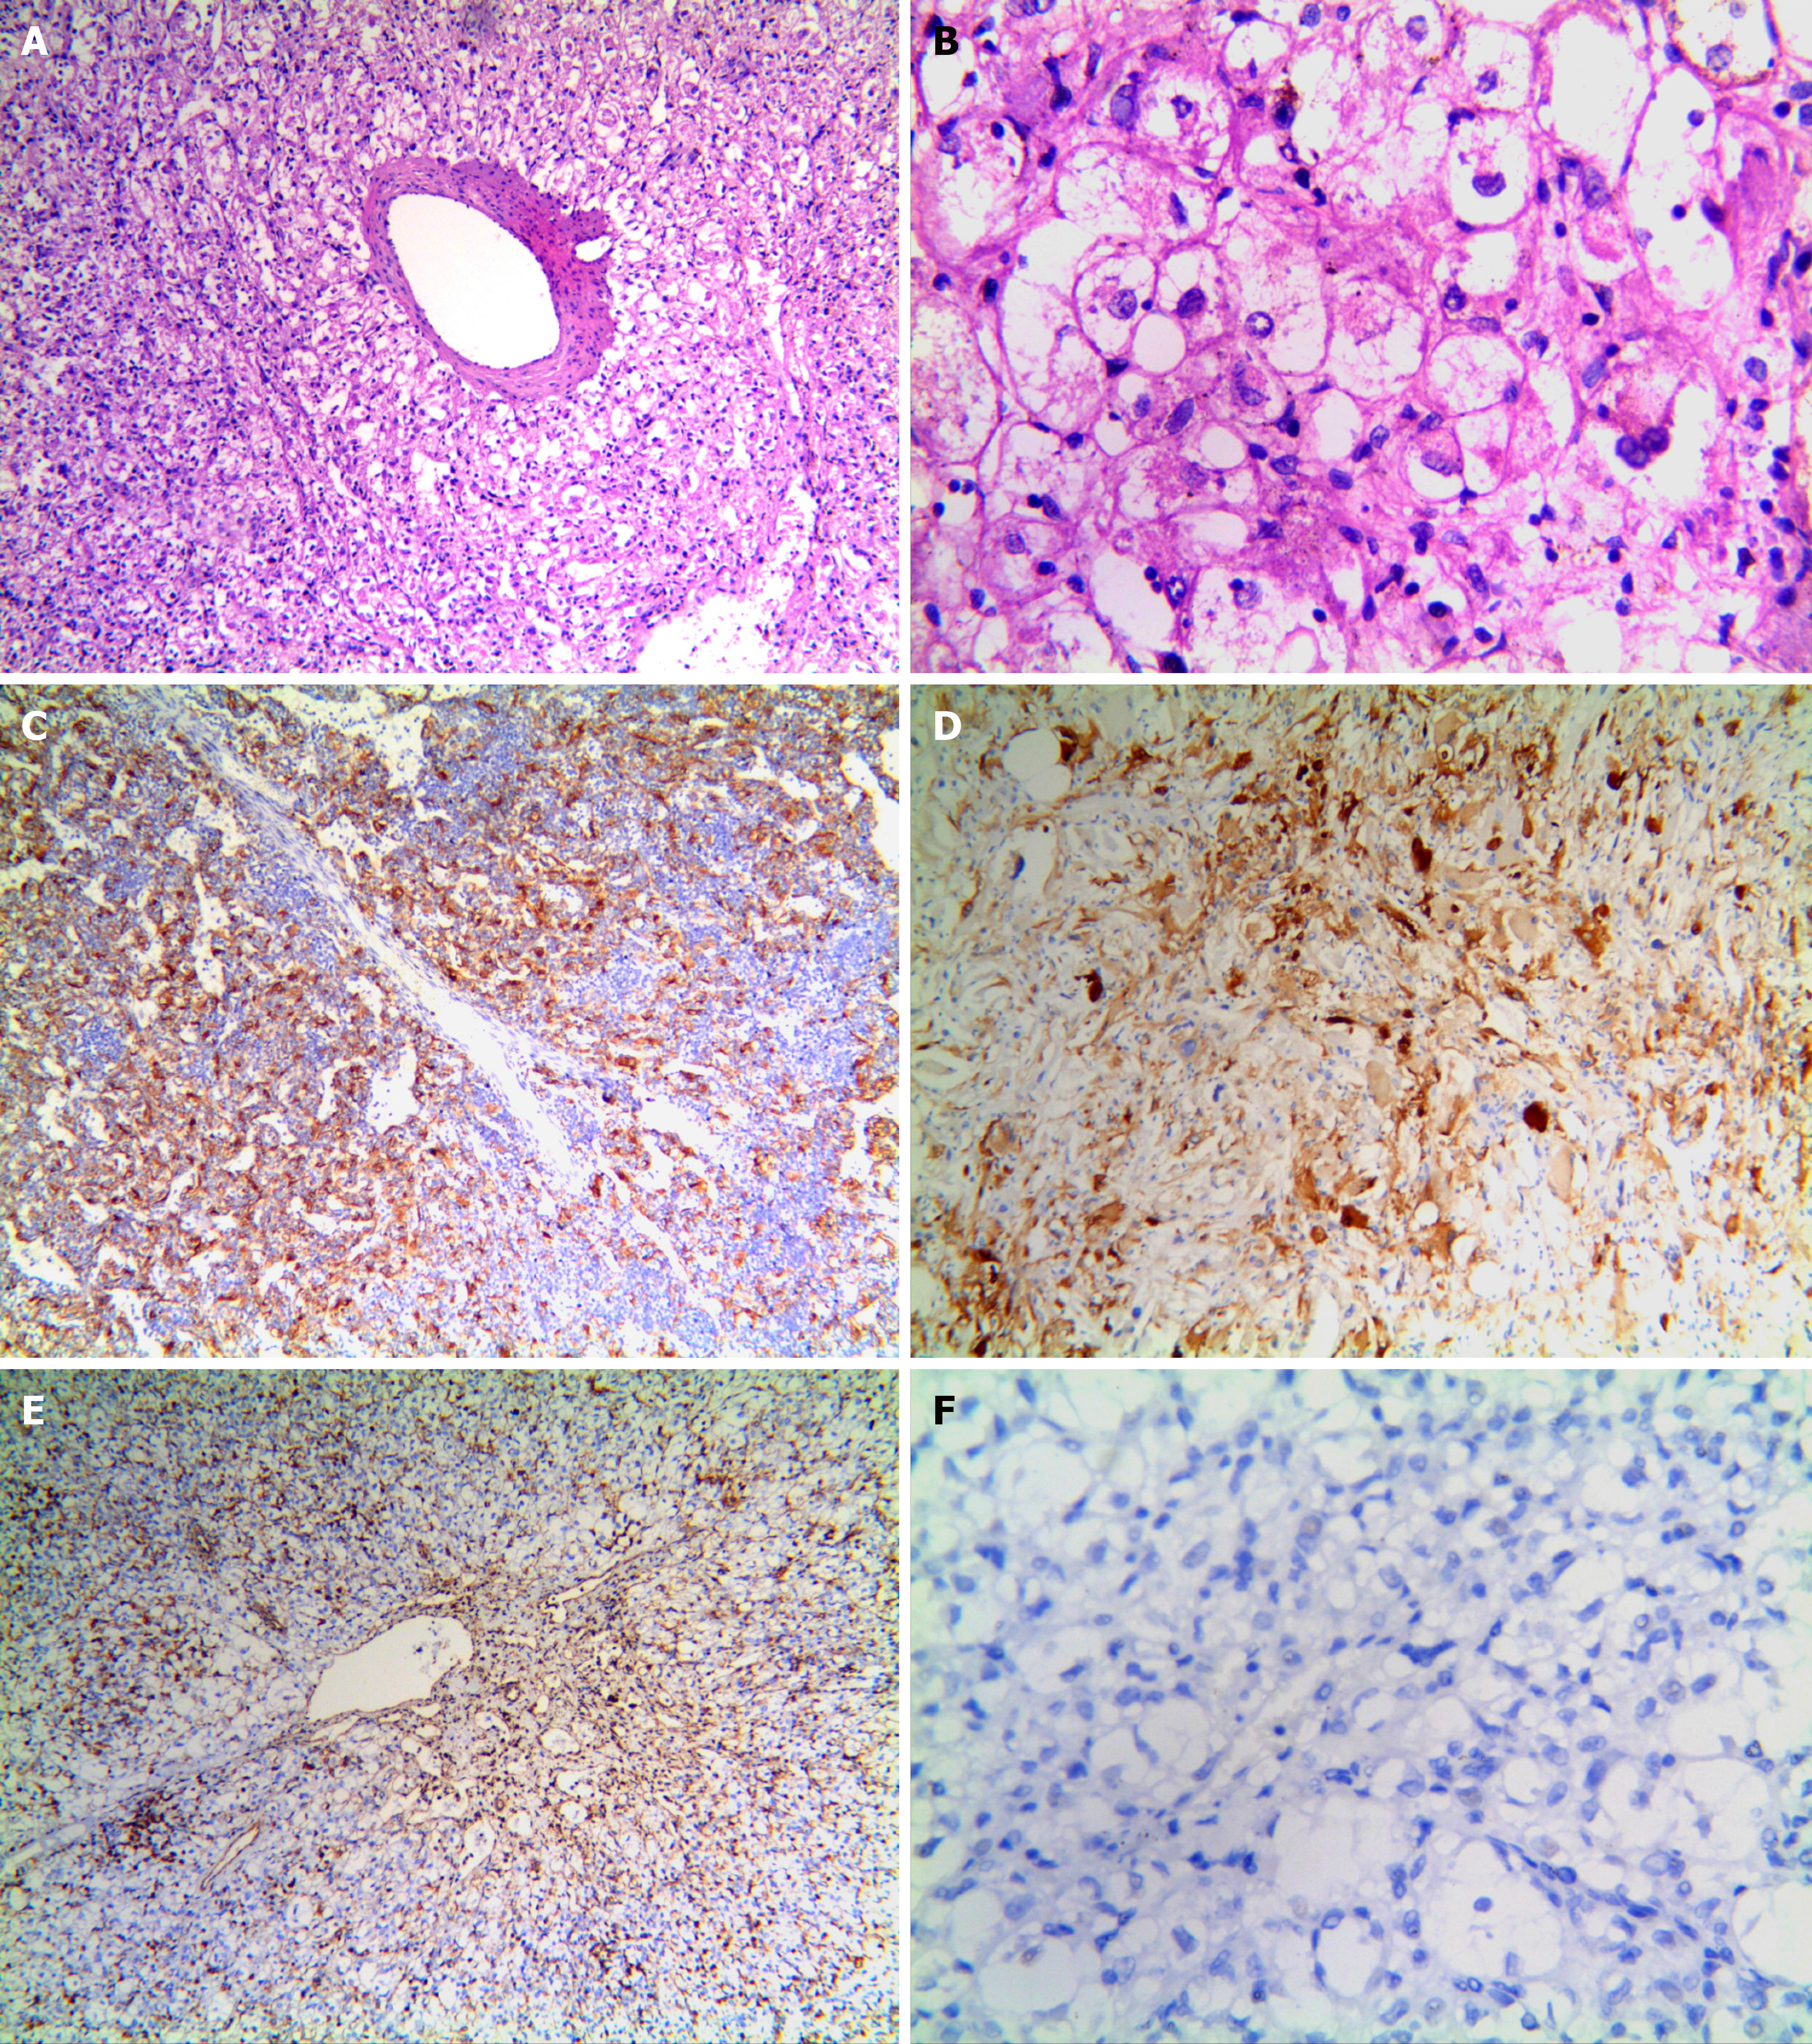
Figure 2 Morphologic appearance of hepatic PEComa.
A: Tumor cells consists of proliferating epithelioid cells nested in trabeculae or lamellae and radially arranged around thick-walled vessels (HE, magnification: 100 ×); B: Tumor cells are polygonal, have translucent cytoplasm, and contain uneven eosinophilic granules. Nuclei are round or oval, with a clear nucleolus and sparse chromatin. Interstitial collagen fibers are feathery (HE, magnification, 400 ×); C: Immunoreactivity for HMB45 was detected in the cytoplasm of tumor cells in contrast to normal liver cells, which were negative for this marker (magnification, 100 ×); D: Increased expression of Melan-A was observed in both the cytoplasm and nuclei of carcinoma cells, whereas normal cells displayed lower expression of this marker (magnification, 100 ×); E: Vimentin was detected in the cytoplasm of tumor cells (magnification, 100 ×), whereas normal tissues were negative for this marker (magnification, 100 ×); F: Desmin immunoreactivity was not detected in tumor cells and normal tissues (magnification, 400 ×). ElivisionTM Plus/HRP was used.
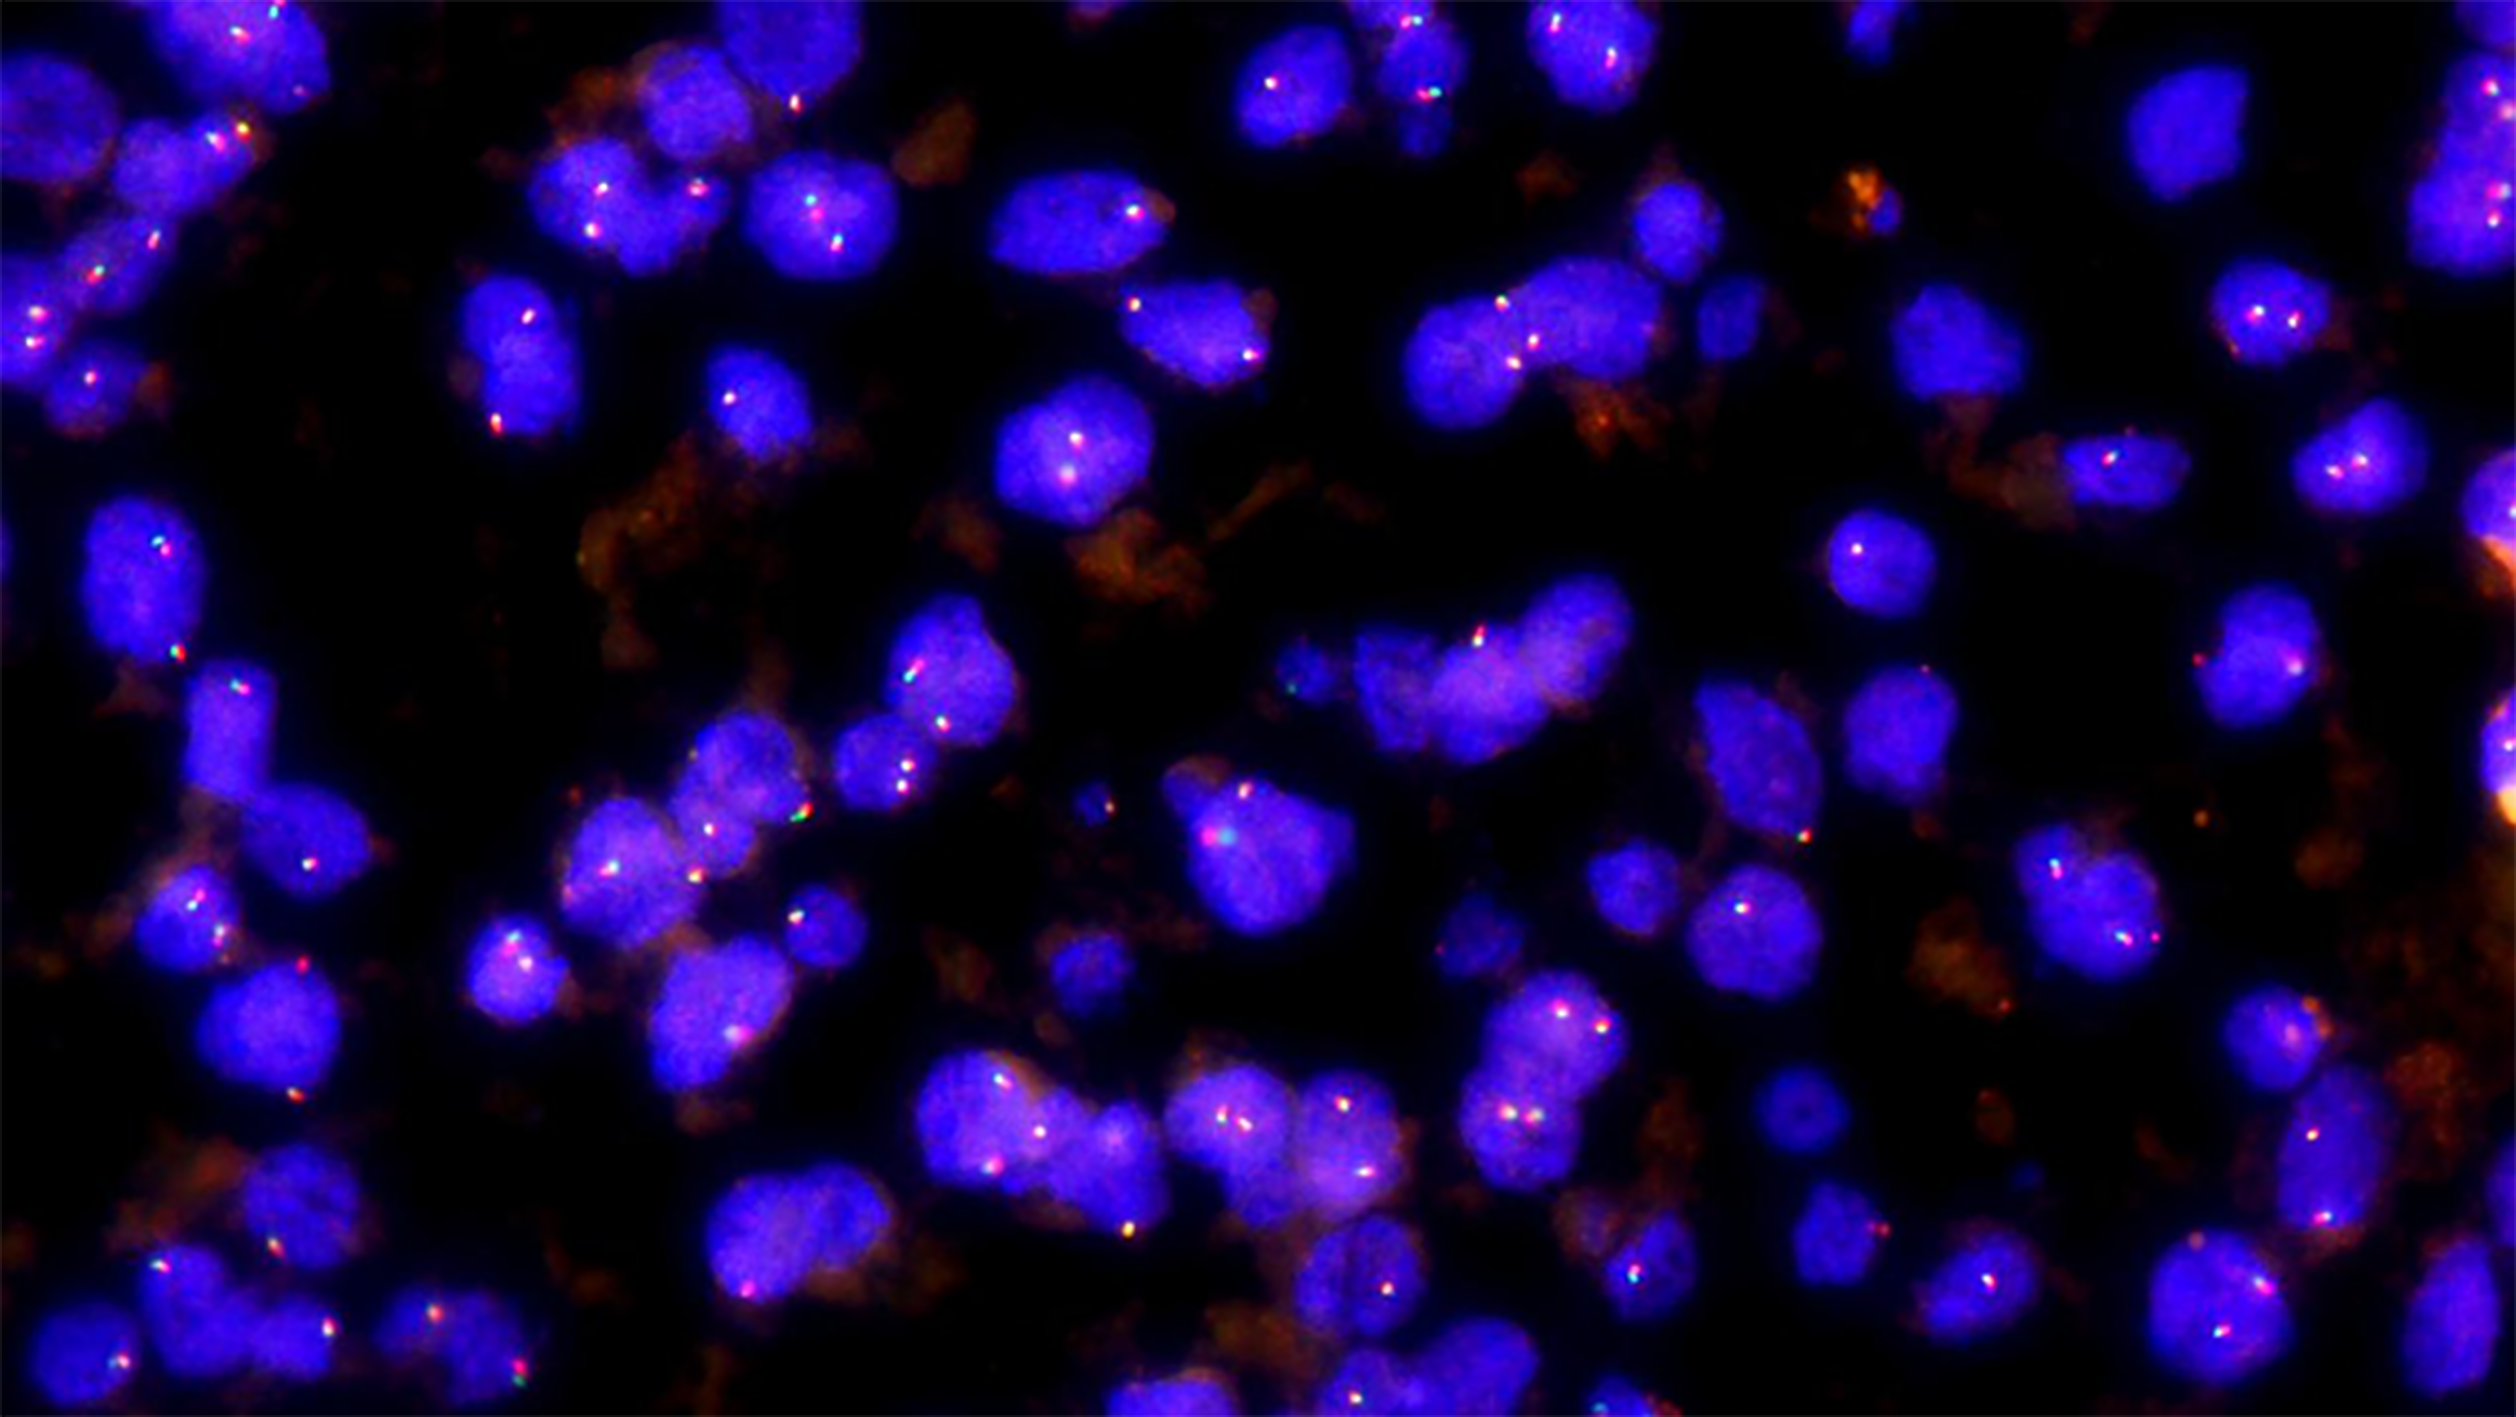
Figure 3 FISH detection of TFE3 gene break-apart in hepatic PEComa.
Most of the tumor cells show fused (yellow) signals, and the distance between the red and green signals is less than 1 fusion signal. For each sample, 100 cells were counted. Only less than 10% of tumor cells showed break-apart signals (magnification, 1000 ×).
- Citation: Zhang S, Yang PP, Huang YC, Chen HC, Chen DL, Yan WT, Yang NN, Li Y, Li N, Feng ZZ. Hepatic perivascular epithelioid cell tumor: Clinicopathological analysis of 26 cases with emphasis on disease management and prognosis. World J Gastroenterol 2021; 27(35): 5967-5977
- URL: https://www.wjgnet.com/1007-9327/full/v27/i35/5967.htm
- DOI: https://dx.doi.org/10.3748/wjg.v27.i35.5967


