Copyright
©The Author(s) 2021.
World J Gastroenterol. Sep 21, 2021; 27(35): 5946-5957
Published online Sep 21, 2021. doi: 10.3748/wjg.v27.i35.5946
Published online Sep 21, 2021. doi: 10.3748/wjg.v27.i35.5946
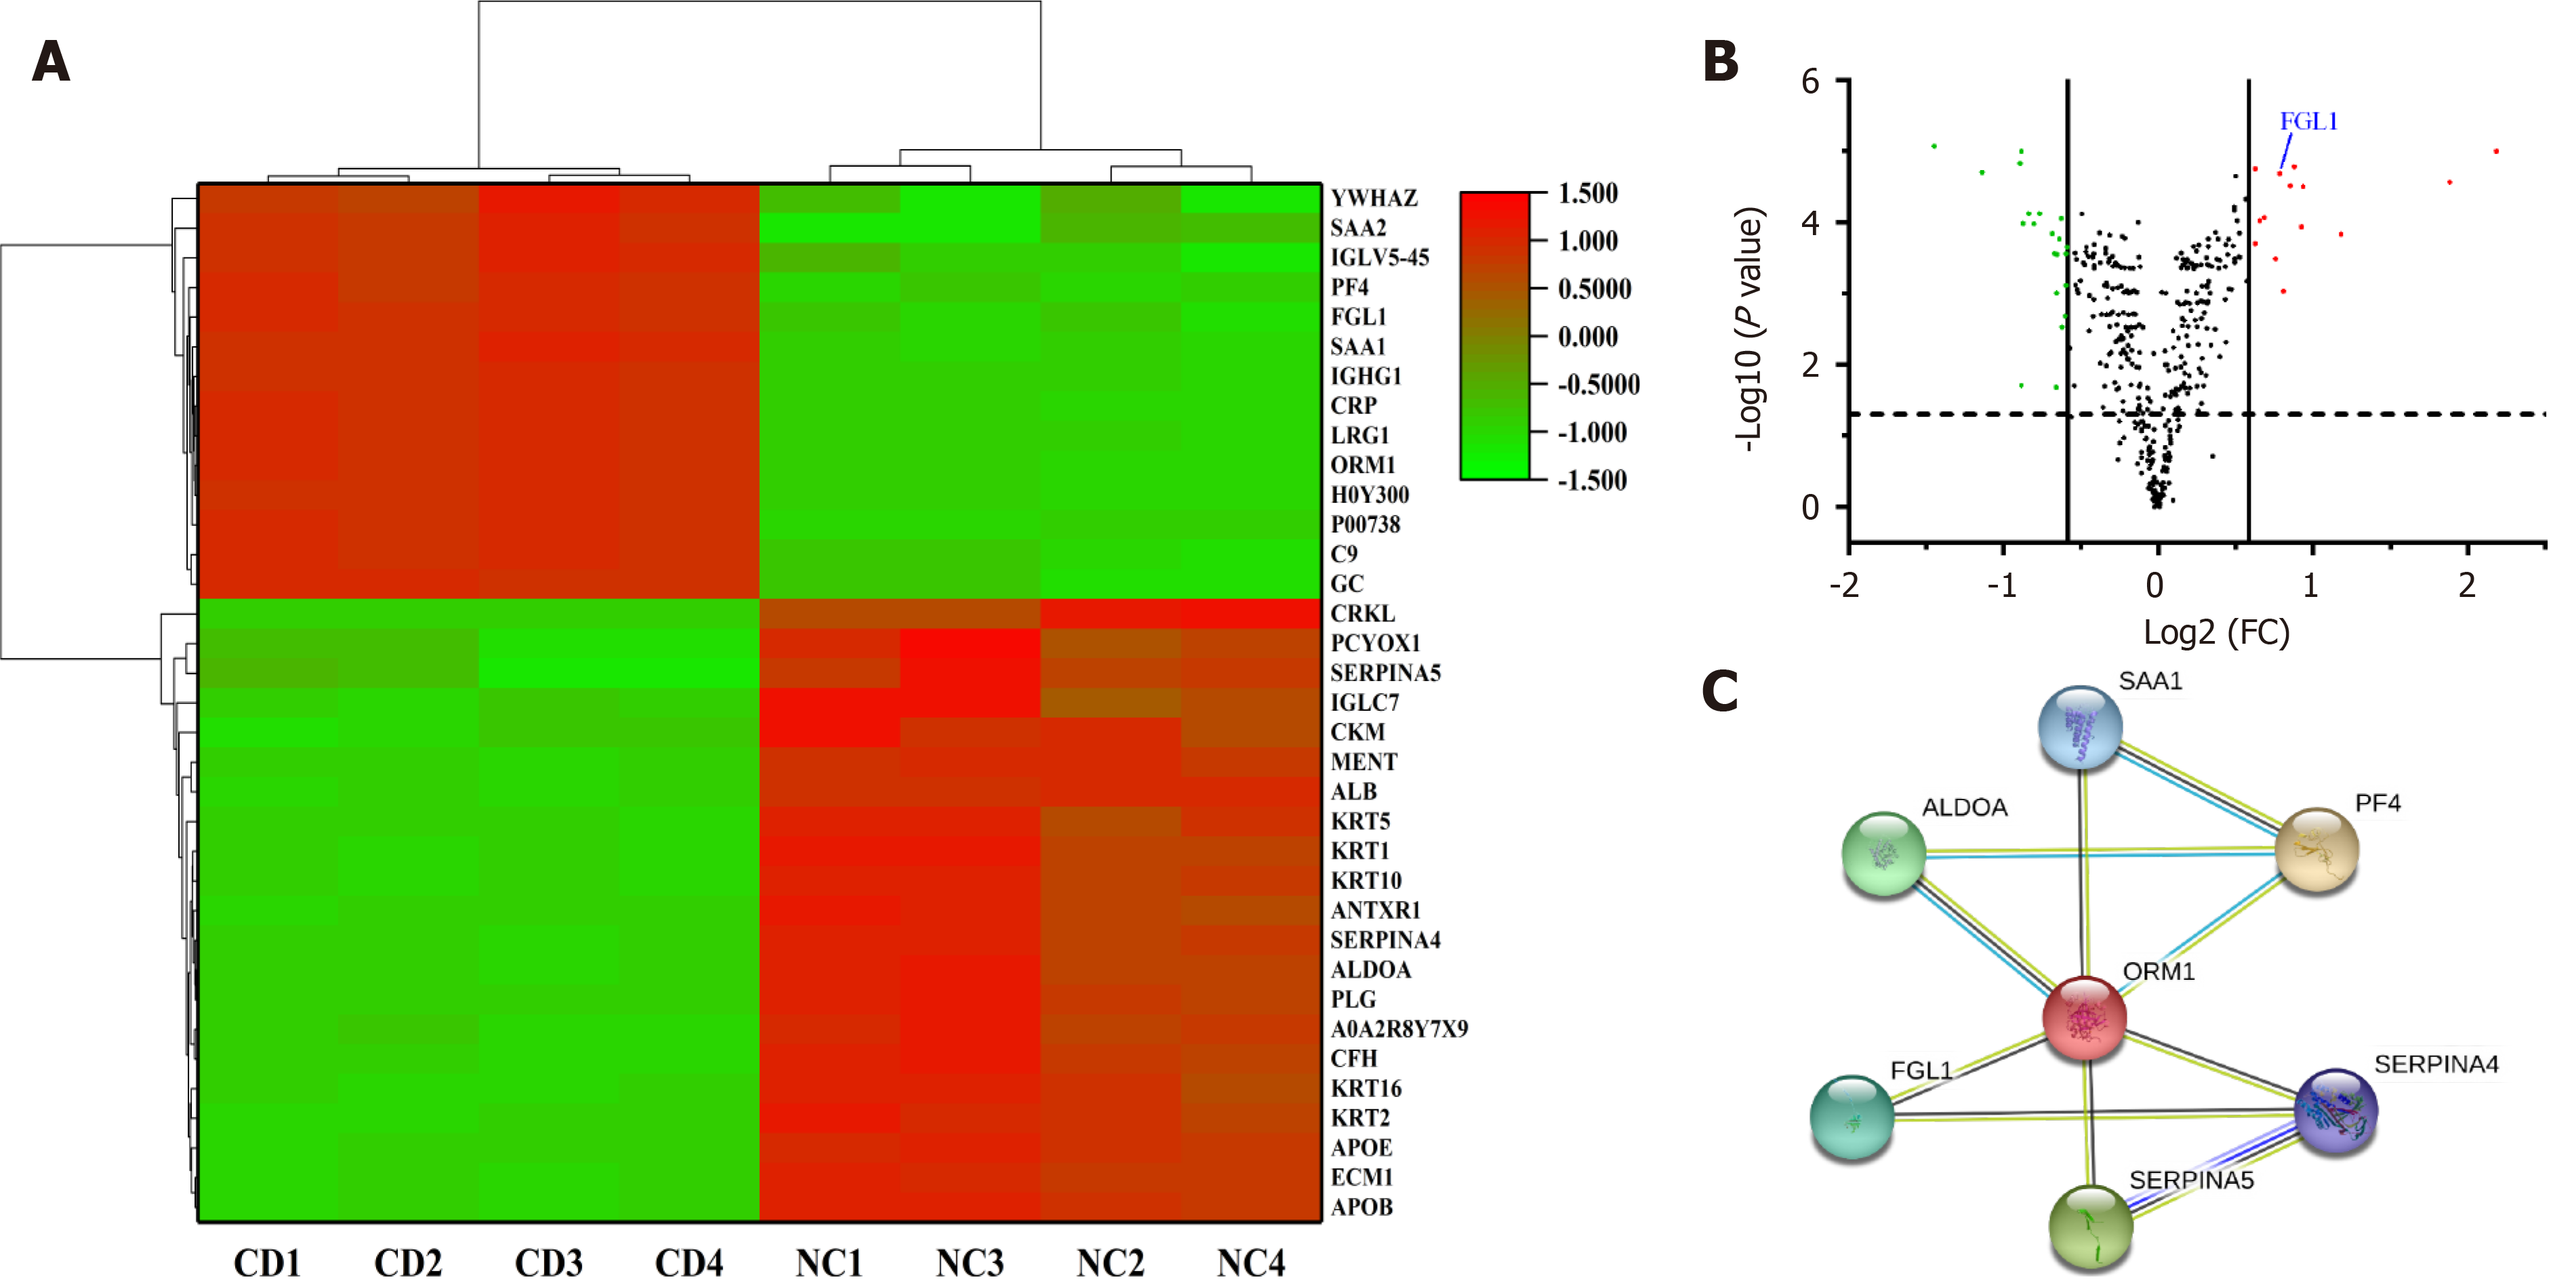
Figure 1 Fibrinogen-like protein 1 expression in the plasma of Crohn’s disease patients.
A: Heat map showing 35 differentially expressed proteins between Crohn’s disease (CD) patients and healthy individuals, among which fibrinogen-like protein 1 (FGL1) expression was upregulated in the CD group; B: The FGL1 expression level in the plasma of CD patients was 1.722-fold greater than that in healthy people; C: Protein-protein interaction network of an MCODE module containing FGL1 as a hub gene. CD: Crohn’s disease; NC: Normal control; FGL1: Fibrinogen-like protein 1.
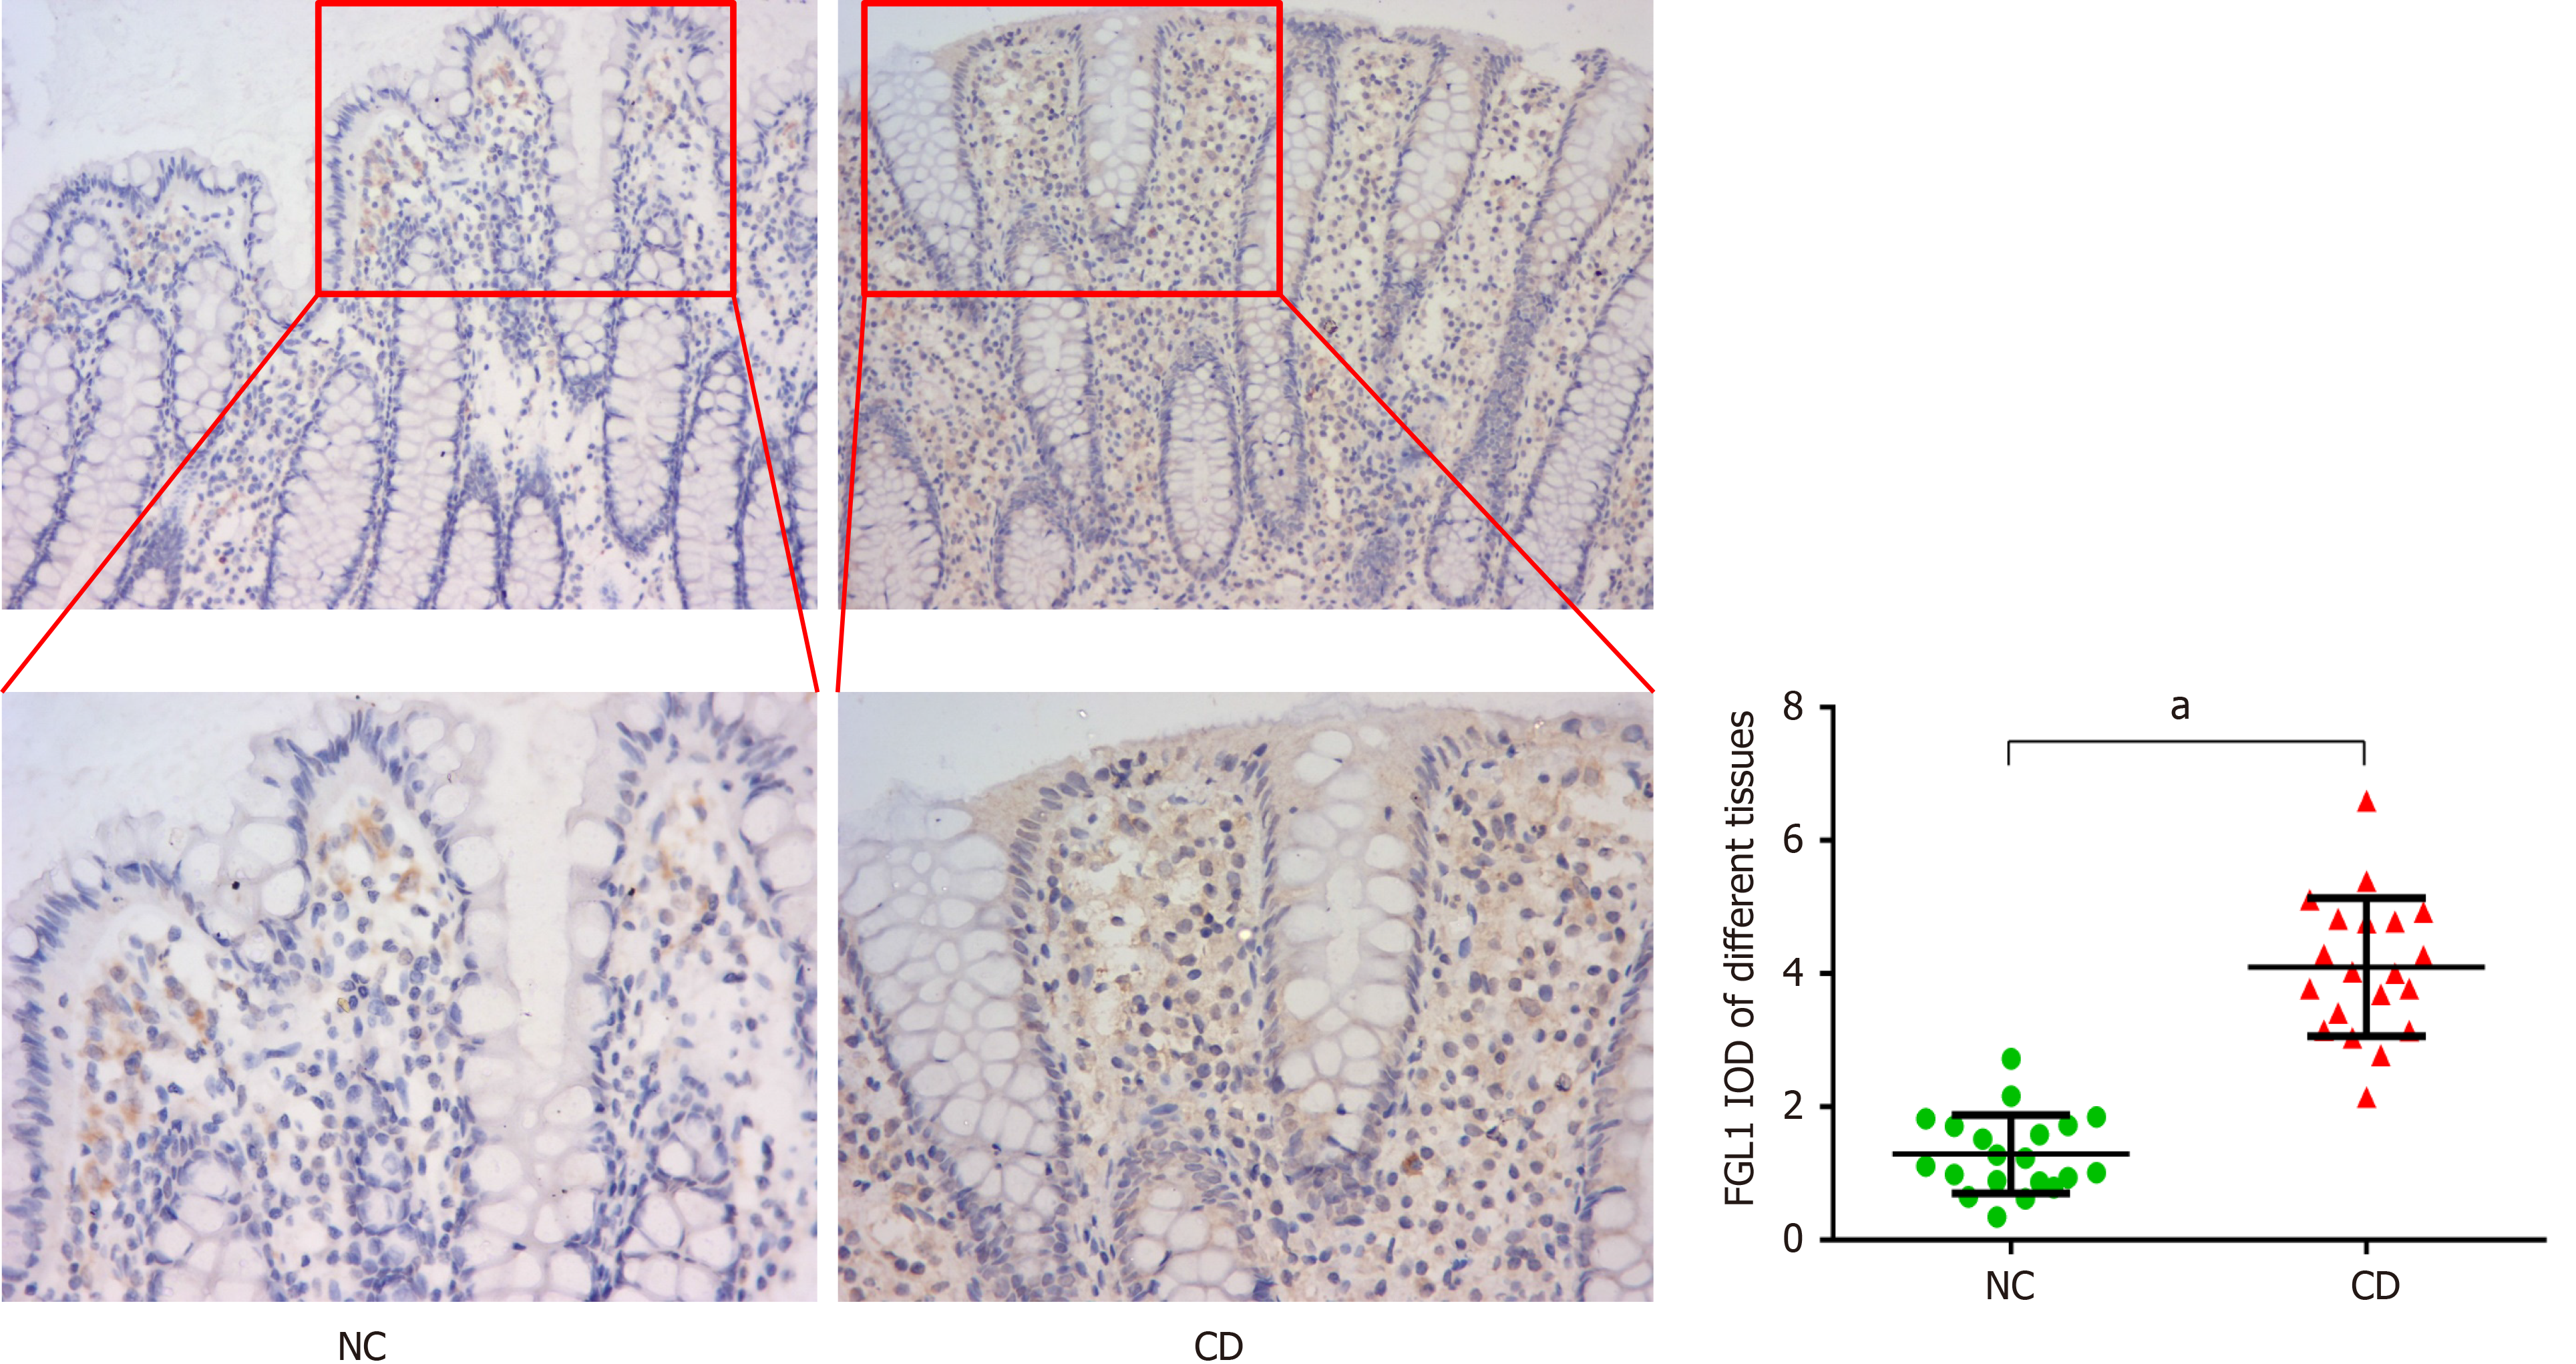
Figure 2 Fibrinogen-like protein 1 expression, as determined by immunohistochemical analysis (× 200, × 400), was increased in the intestinal mucosal and epithelial tissues of Crohn’s disease patients.
aP < 0.01 vs normal control group. NC: Normal control group; CD: Crohn’s disease group; FGL1: Fibrinogen-like protein 1.
Figure 3 Expression of proinflammatory cytokines in different groups, as determined by enzyme linked immunosorbent assay.
aP < 0.01 vs normal control group; bP < 0.01, cP < 0.05 vs lipopolysaccharide. NC: Normal control group; LPS: Crohn’s disease (CD) model induced by lipopolysaccharide (LPS); LPS+Vector: Transfected with an empty vector based on the CD model; LPS+si-FGL1: Transfected with FGL1 siRNA based on the CD model; LPS+oe-FGL1: Transfected with the FGL1 plasmid based on the CD model; FGL1: Fibrinogen-like protein 1.
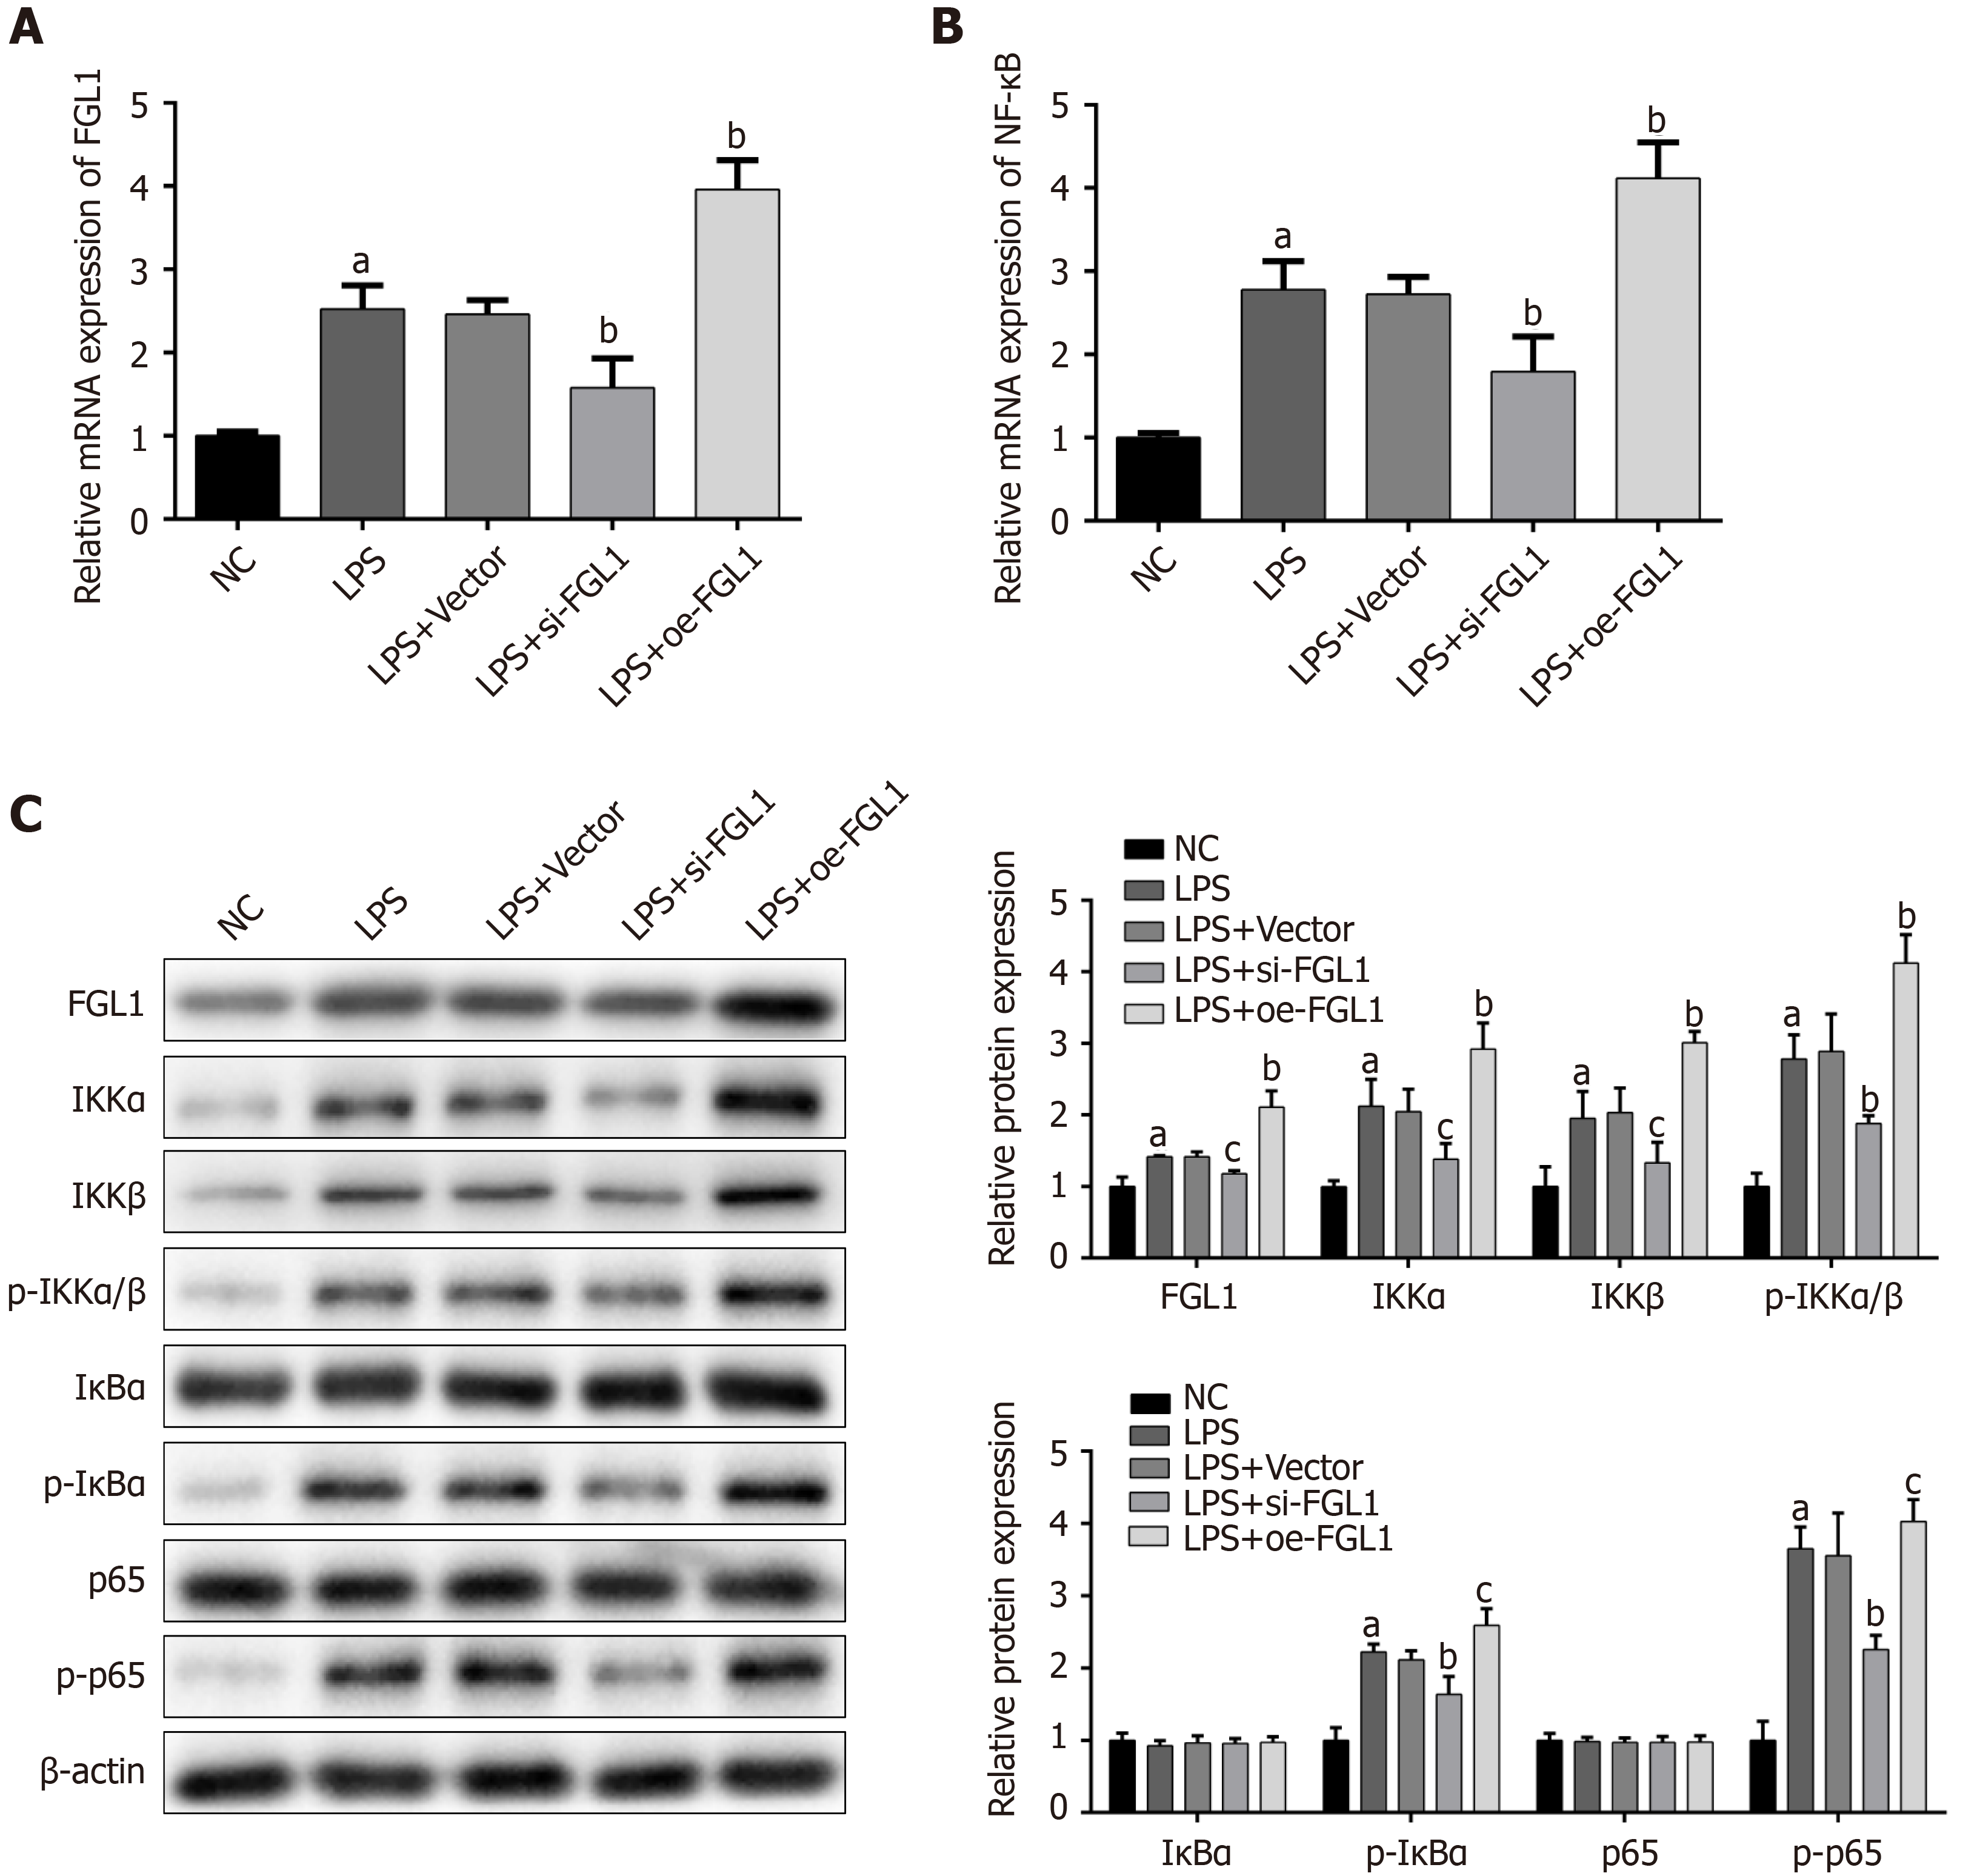
Figure 4 Impact of fibrinogen-like protein 1 on the NF-κB signalling pathway.
A and B: Effect of knockdown or overexpression of fibrinogen-like protein 1 (FGL1) on the mRNA expression of FGL1 and NF-κB, as determined by quantitative real-time PCR assay; C: Effect of FGL1 on the protein expression of related proteins in the canonical NF-κB signalling pathway, as determined by Western blot assay. aP < 0.01 vs NC; bP < 0.01, cP < 0.05 vs LPS. NC: Normal control group; LPS: Crohn’s disease (CD) model induced by LPS; LPS+Vector: Transfected with an empty vector based on the CD model; LPS+si-FGL1: Transfected with FGL1 siRNA based on the CD model; LPS+oe-FGL1: Transfected with the FGL1 plasmid based on the CD model; LPS: Lipopolysaccharide; FGL1: Fibrinogen-like protein 1.
- Citation: Sun XL, Qiao LC, Gong J, Wen K, Xu ZZ, Yang BL. Proteomics identifies a novel role of fibrinogen-like protein 1 in Crohn’s disease. World J Gastroenterol 2021; 27(35): 5946-5957
- URL: https://www.wjgnet.com/1007-9327/full/v27/i35/5946.htm
- DOI: https://dx.doi.org/10.3748/wjg.v27.i35.5946


