Copyright
©The Author(s) 2021.
World J Gastroenterol. Jul 7, 2021; 27(25): 3851-3862
Published online Jul 7, 2021. doi: 10.3748/wjg.v27.i25.3851
Published online Jul 7, 2021. doi: 10.3748/wjg.v27.i25.3851
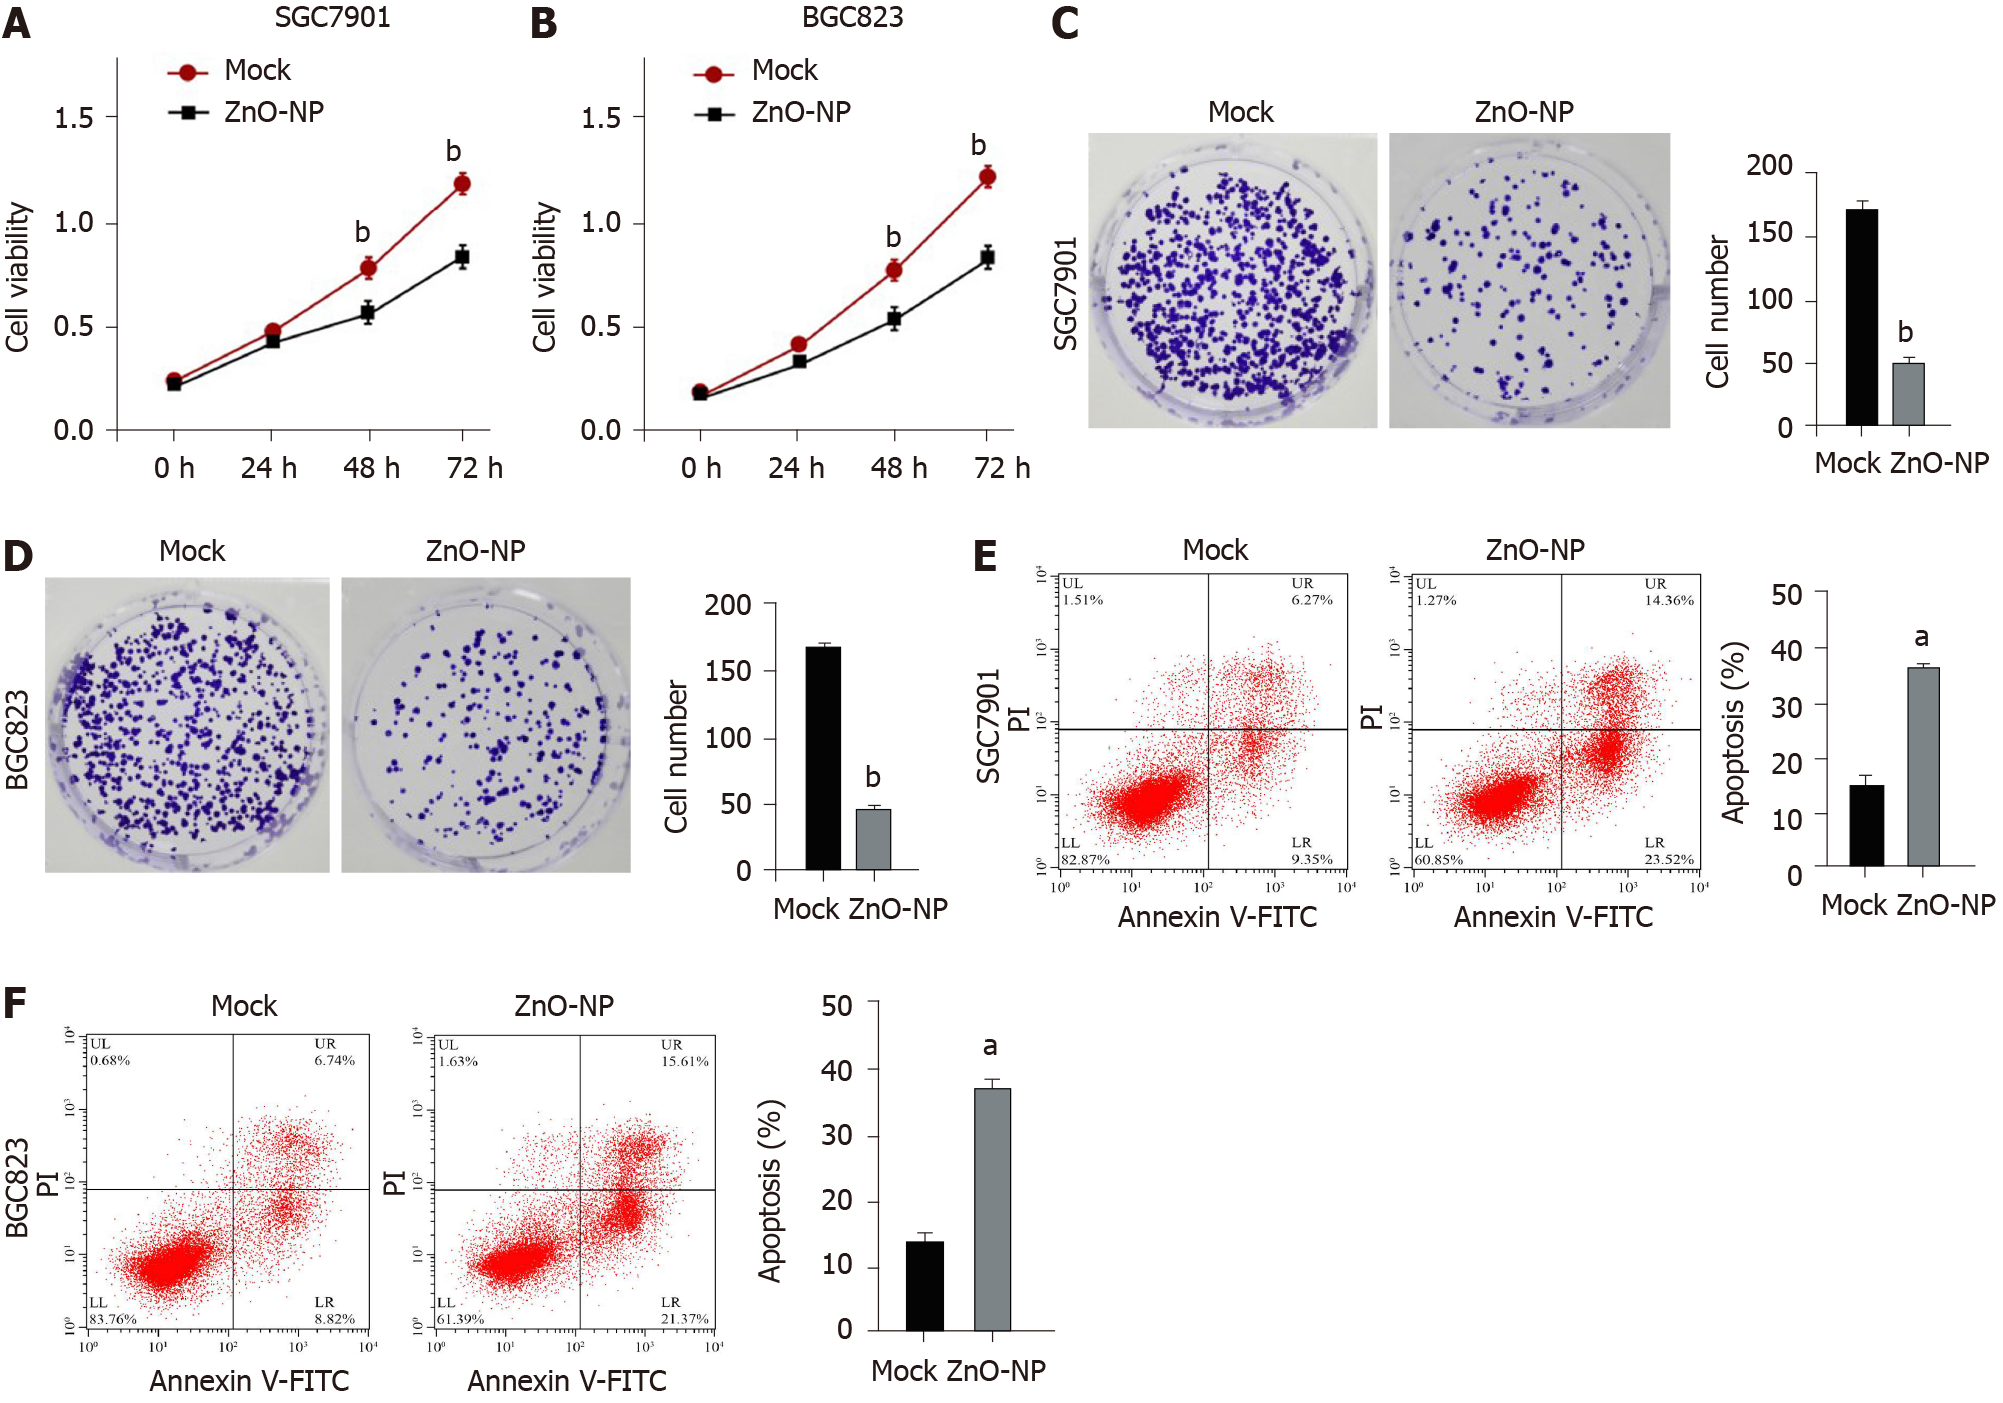
Figure 1 Zinc oxide nanoparticle inhibits proliferation and induces apoptosis of gastric cancer cells.
SGC7901 and BGC823 cells were treated with the zinc oxide nanoparticle (ZnO-NP, 5 μg/mL) or an equal volume of saline. A and B: Cell viability was analyzed by the MTT assay; C and D: Cell proliferation was assessed by the colony formation assay; E and F: Cell apoptosis was measured by flow cytometry. Data are presented as the mean ± SD. Statistically significant differences are indicated: aP < 0.05; bP < 0.01. FITC: Fluorescein isothiocyanate.
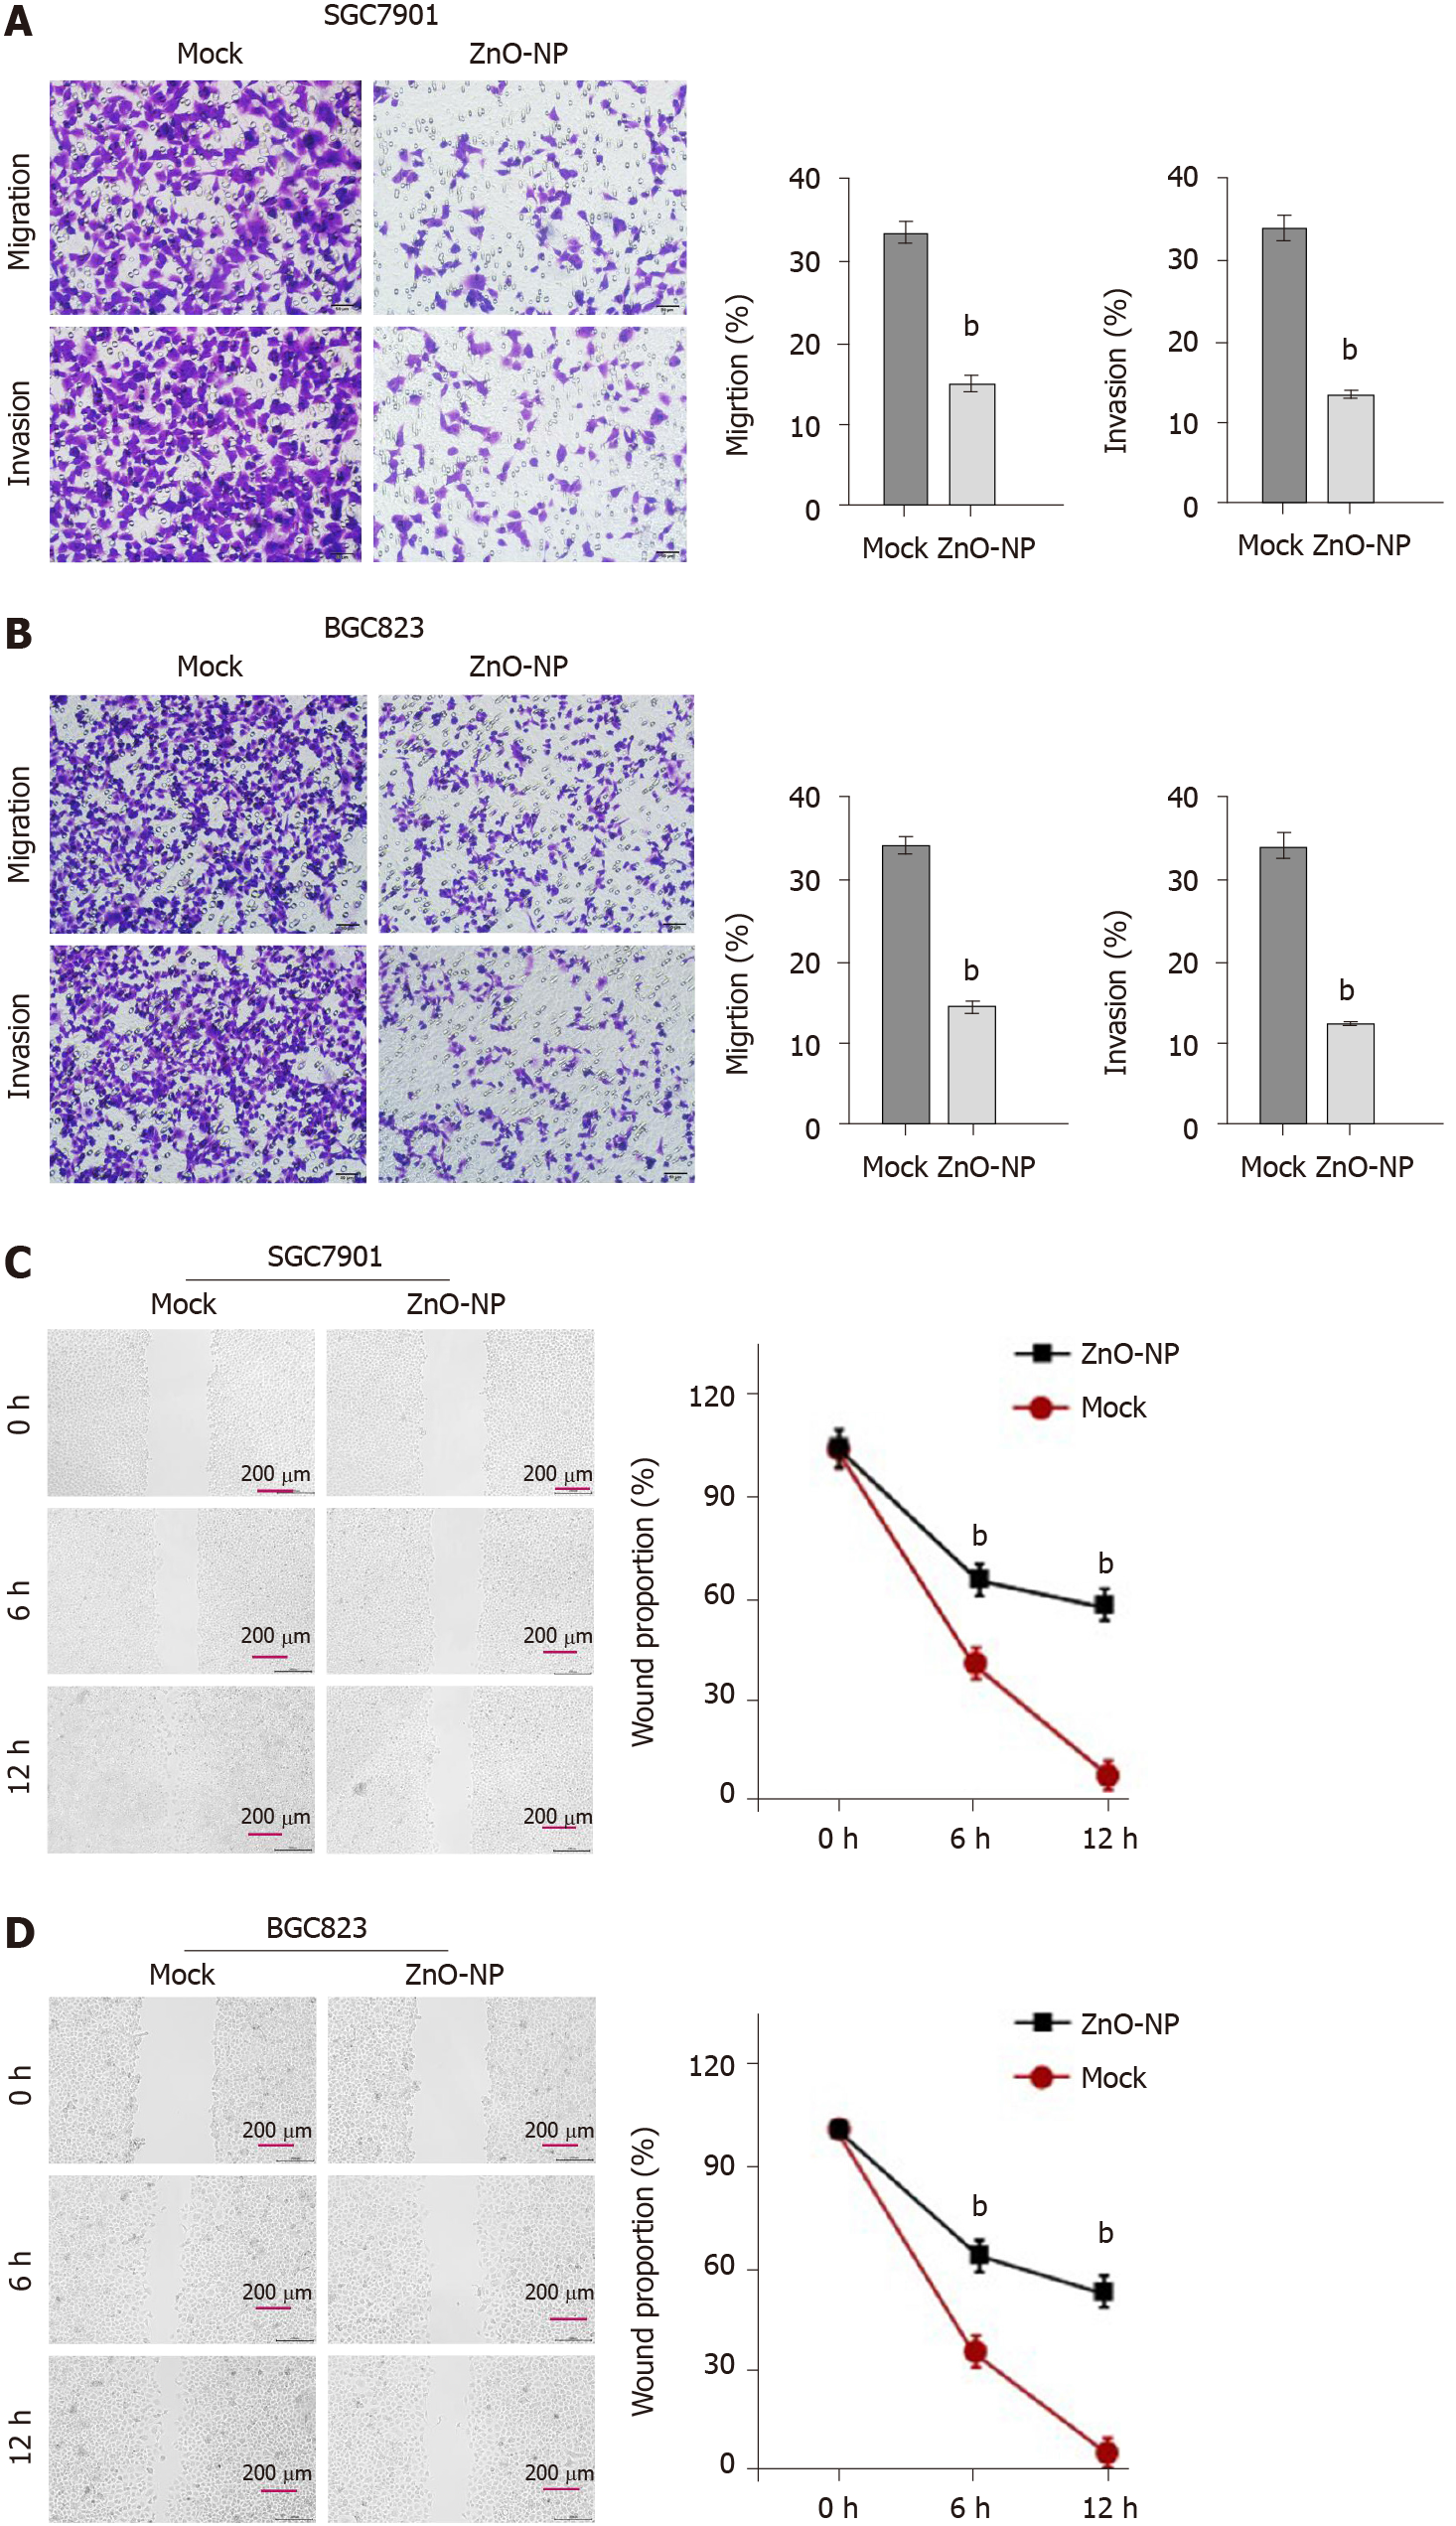
Figure 2 Zinc oxide nanoparticle reduces the invasion and migration of gastric cancer cells.
SGC7901 and BGC823 cells were treated with zinc oxide nanoparticle (5 μg/mL, ZnO-NP) or an equal volume of saline. A and B: Cell migration and invasion were determined by transwell assays; C and D: Migration and invasion were examined by wound healing assays. The wound healing proportion is shown. Data are presented as the mean ± SD. Statistically significant differences are indicated: bP < 0.01.
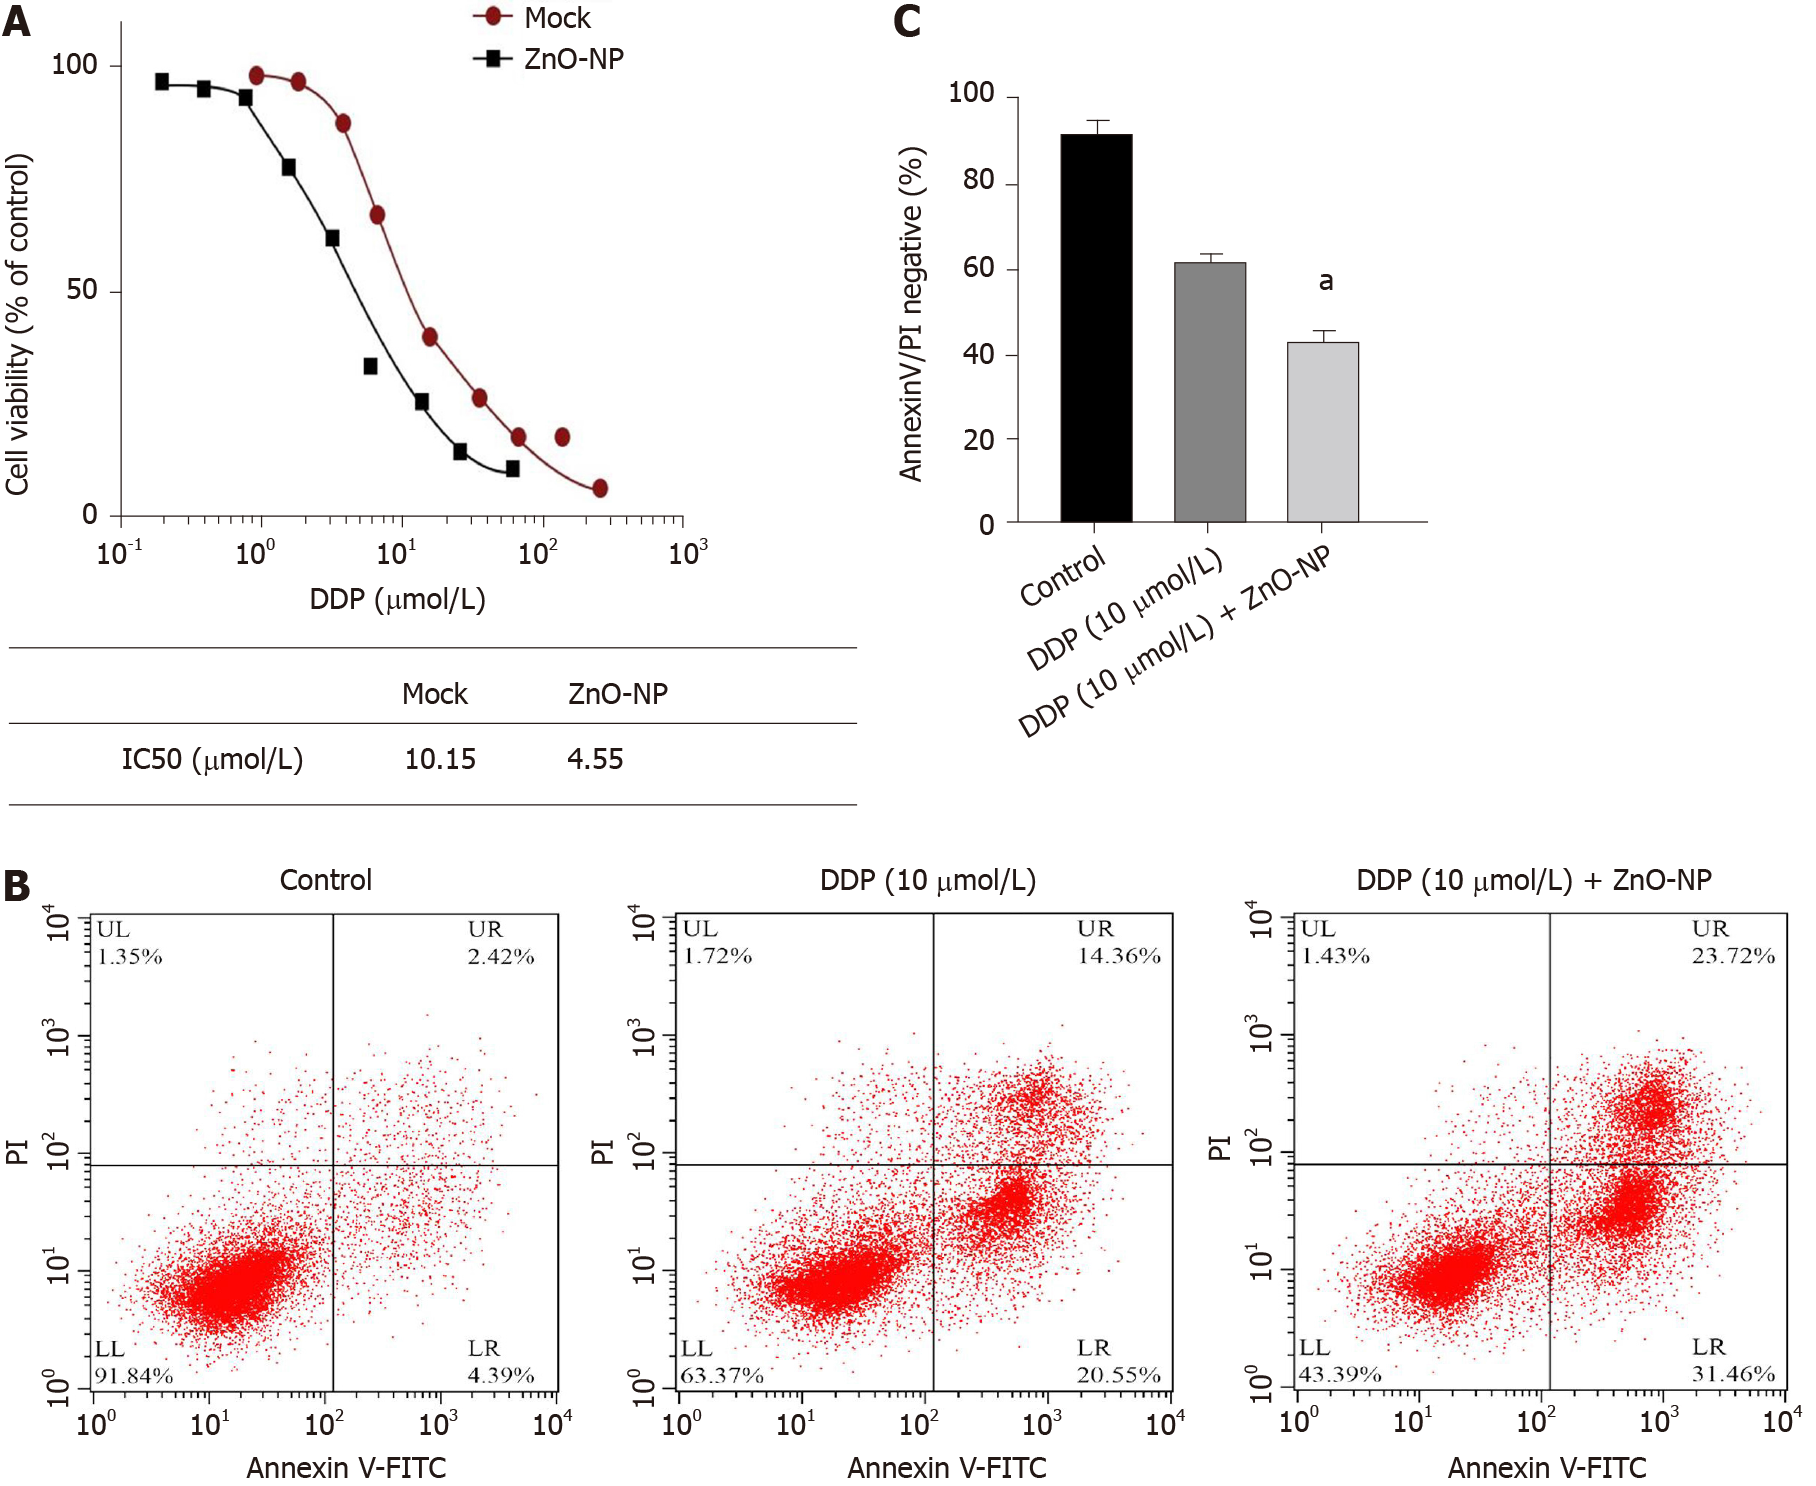
Figure 3 Zinc oxide nanoparticle attenuates the chemotherapy drug resistance of gastric cancer cells.
A: SGC7901/cisplatin (DDP) cells were treated with DDP at the indicated doses and treated with zinc oxide nanoparticle (ZnO-NP, 5 μg/mL) or an equal volume of saline. Cell viability was measured by the MTT assay; B and C: SGC7901/DDP cells were treated with DDP or co-treated with DDP and ZnO-NP (5 μg/mL). Cell apoptosis was assessed by flow cytometry. Data are presented as the mean ± SD. Statistically significant differences are indicated: ns, no significance, aP < 0.05. FITC: Fluorescein isothiocyanate.
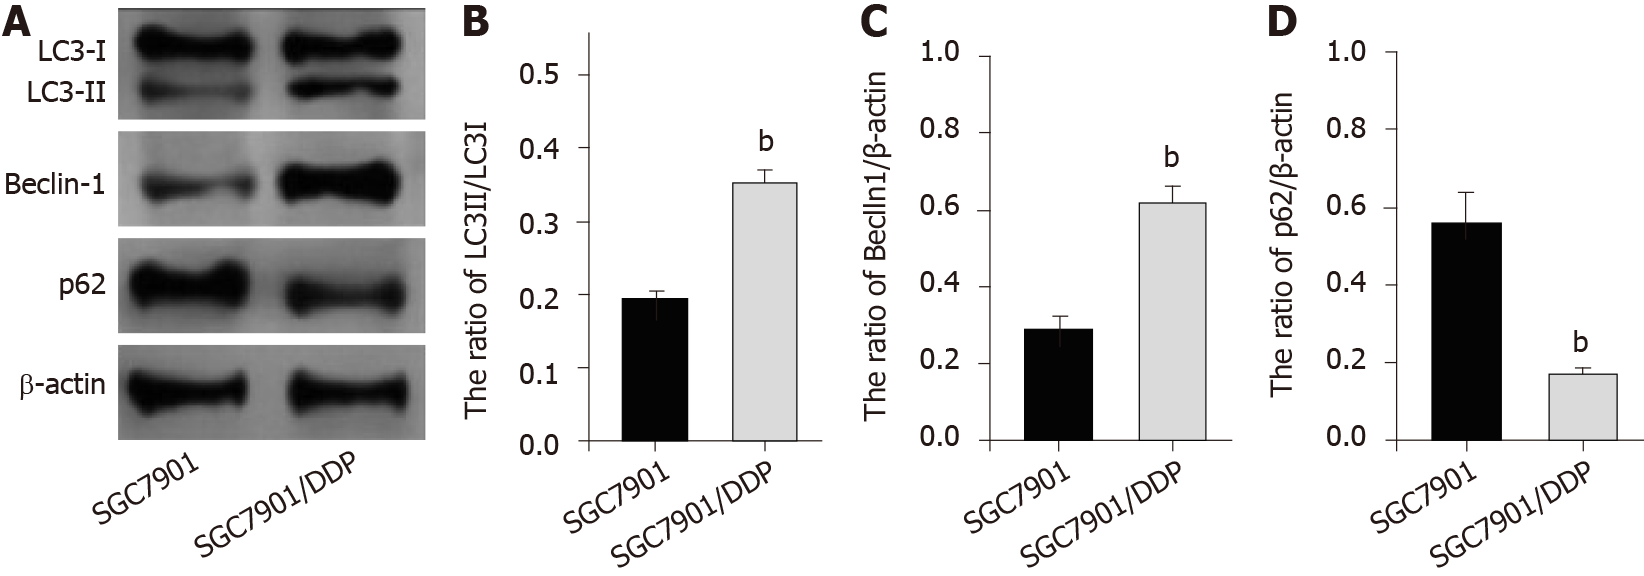
Figure 4 Autophagy is increased in chemotherapy-resistant gastric cancer cells.
A: Expression of light chain 3B-II (LC3B-II), LC3B-I, Beclin-1, p62, and β-actin was measured by Western blot analysis in SGC7901 and SGC7901/cisplatin (DDP) cells; B: Ratio of LC3II/LC3I; C: Ratio of Beclin-1/β-actin; D: Ratio of p62/β-actin. The results of Western blot analysis were quantified by ImageJ software. Data are presented as the mean ± SD. Statistically significant differences are indicated: bP < 0.01.
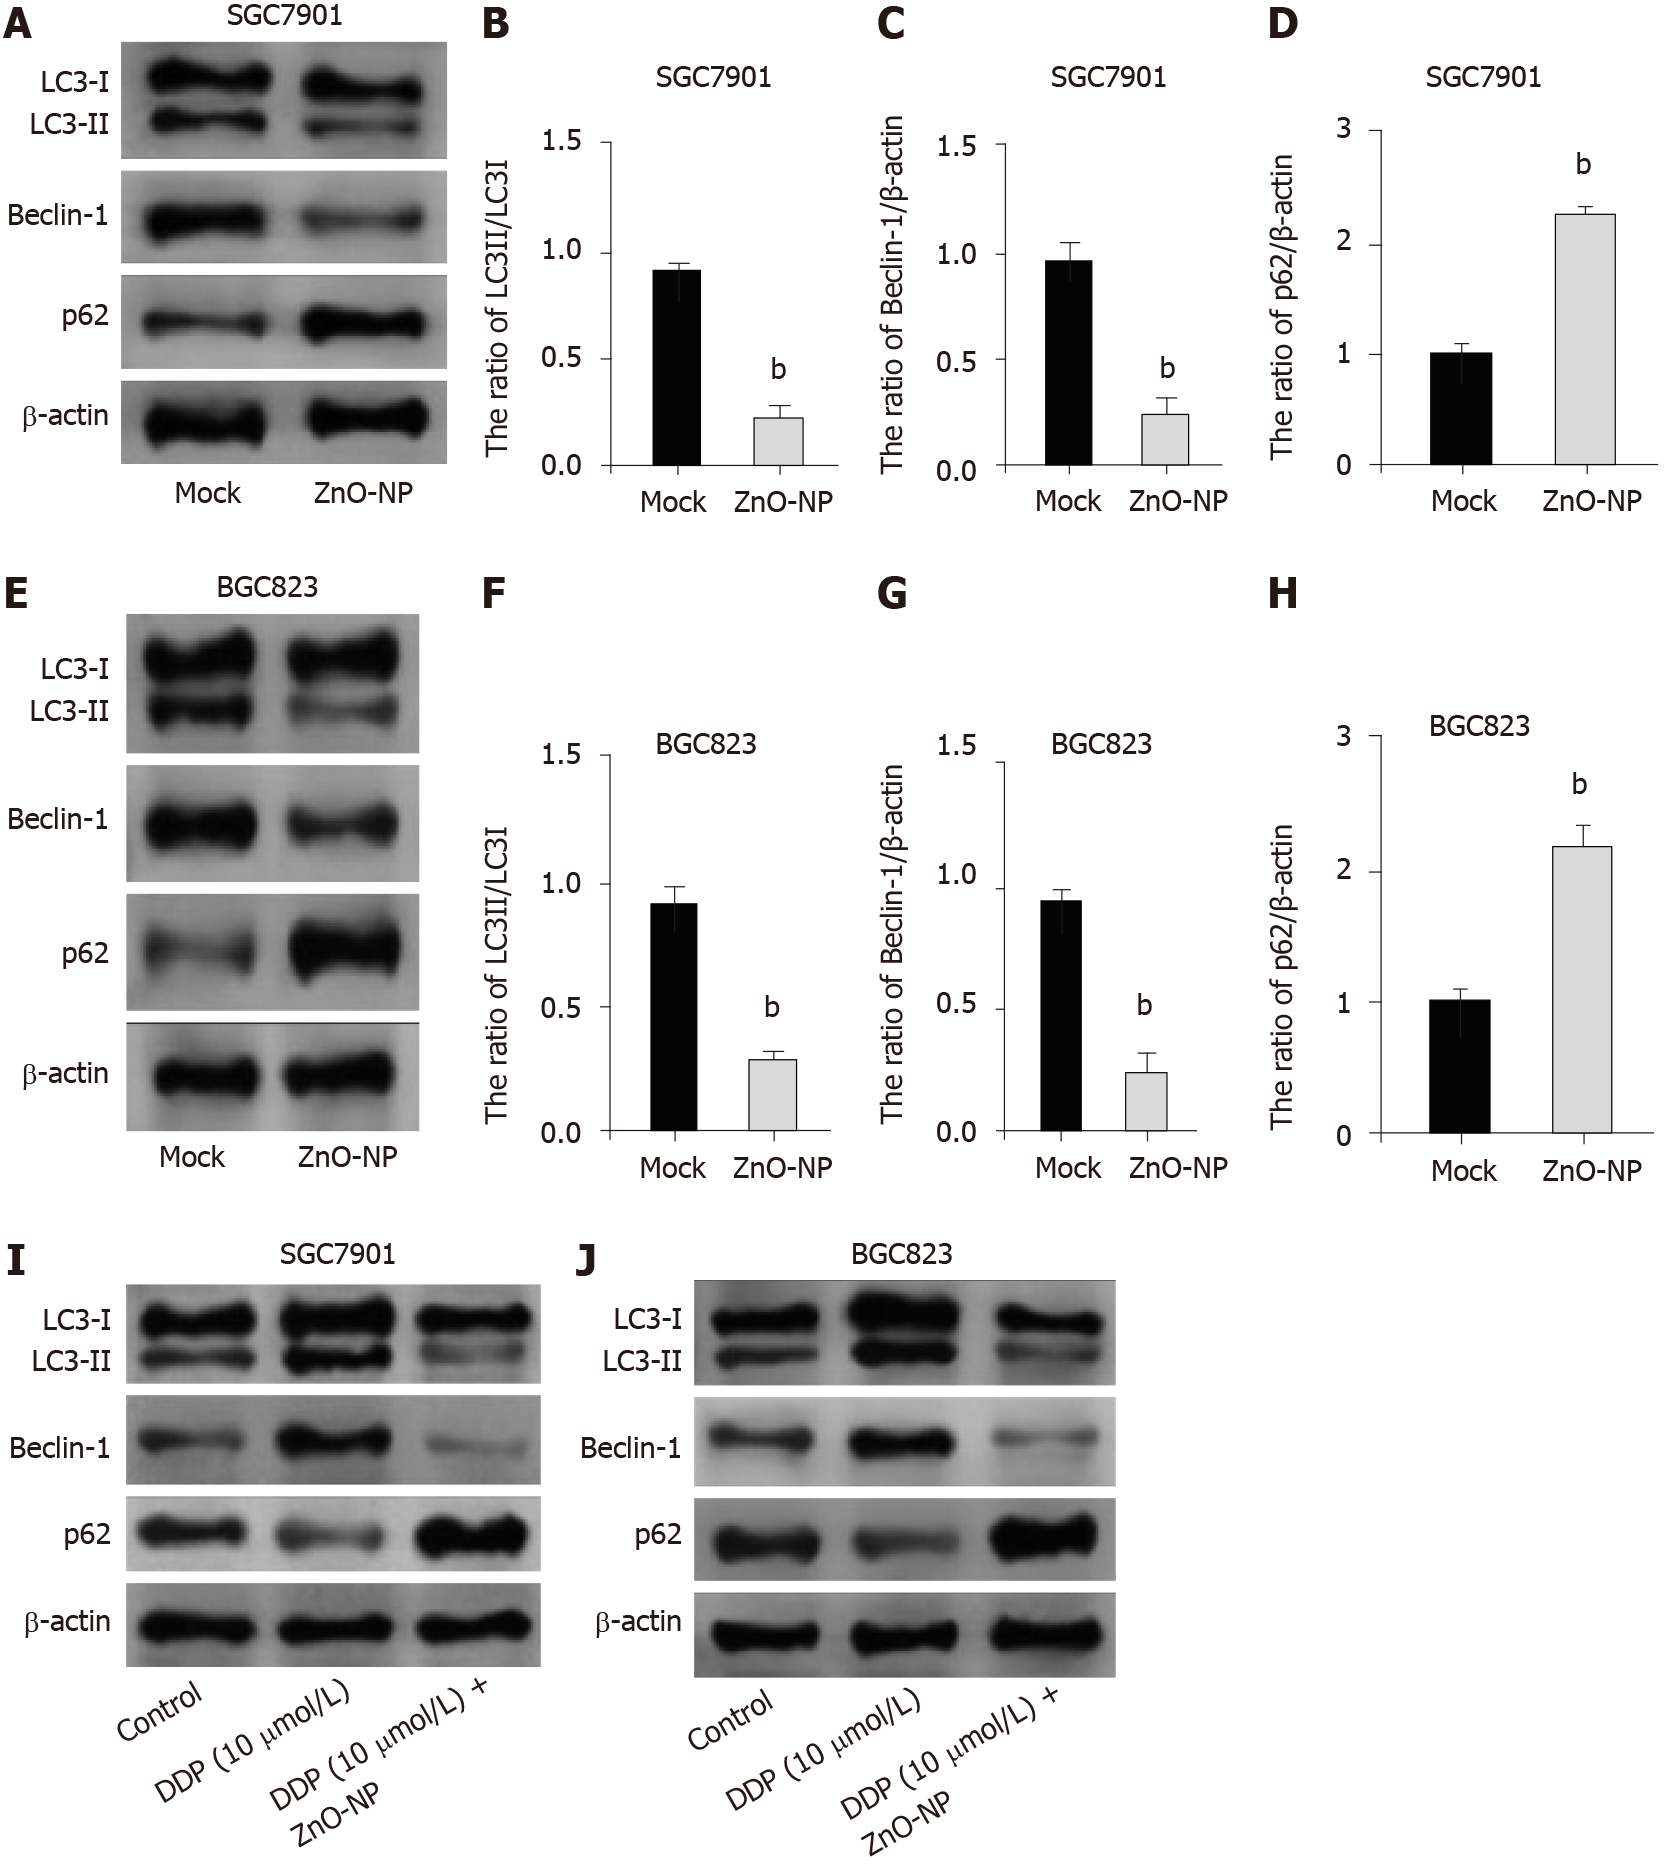
Figure 5 Zinc oxide nanoparticle inhibits autophagy in gastric cancer cells.
A-H: SGC7901 and BGC823 cells were treated with zinc oxide nanoparticle (ZnO-NP, 5 μg/mL) or an equal volume of saline. The expression of light chain 3B-II (LC3B-II), LC3B-I, Beclin-1, p62, and β-actin was measured by Western blot analysis. The results of Western blot analysis were quantified by ImageJ software; I and J: SGC7901 and BGC823 cells were treated with cisplatin (DDP, 10 μmol/L) or co-treated with DDP (10 μmol/L) and ZnO-NP (5 μg/mL). The expression of LC3B-II, LC3B-I, Beclin-1, p62, and β-actin was analyzed by Western blot analysis. Data are presented as the mean ± SD. Statistically significant differences are indicated: bP < 0.01.
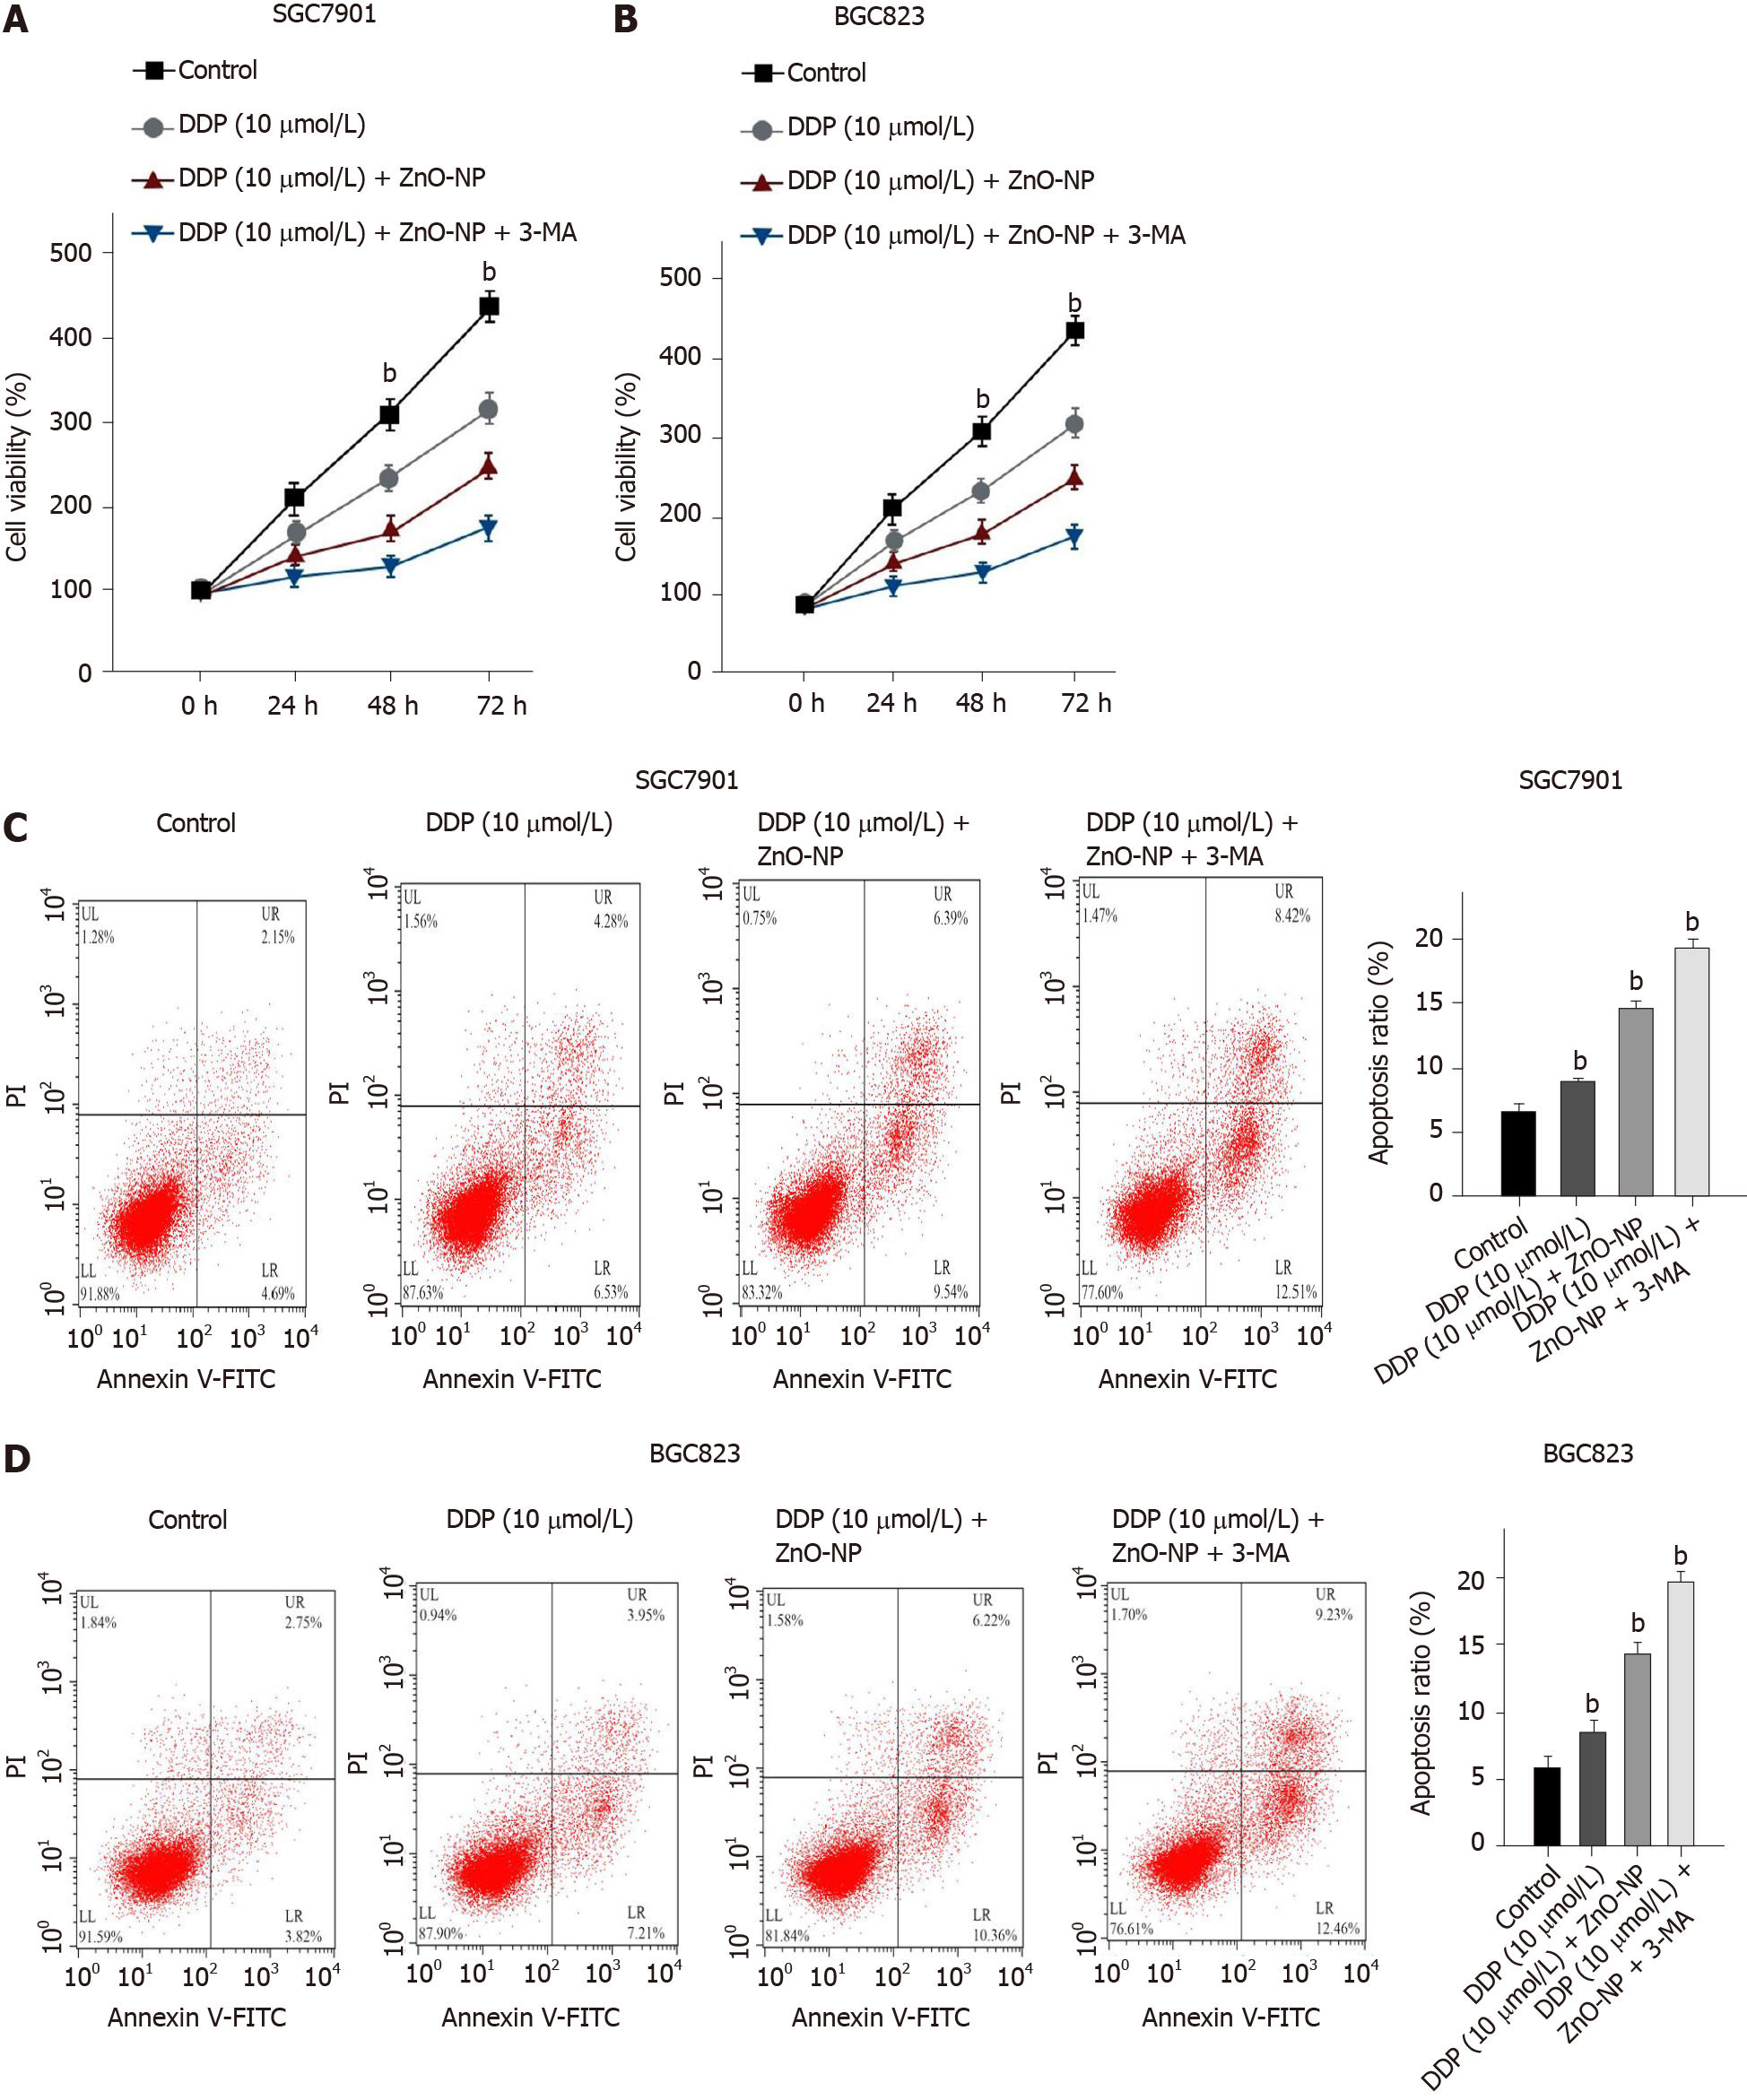
Figure 6 Zinc oxide nanoparticle attenuates chemotherapy drug resistance by inhibiting the autophagy of gastric cancer cells.
SGC7901 and BGC823 cells were treated with cisplatin (DDP), DDP and zinc oxide nanoparticle (ZnO-NP, 5 μg/mL), co-treated with DDP, ZnO-NP (5 μg/mL) and 3-methyladenine (3-MA, 5 mmol/L). A and B: Cell viability was determined by the MTT assay; C and D: Cell apoptosis was analyzed by flow cytometry. Data are presented as the mean ± SD. Statistically significant differences are indicated: bP < 0.01. FITC: Fluorescein isothiocyanate.
Figure 7 Zinc oxide nanoparticle reduces the tumor growth of chemoresistant gastric cancer cells in vivo.
The impact of zinc oxide nanoparticle (ZnO-NP) on tumor growth of cisplatin (DDP)-resistant gastric cells in vivo was analyzed by the nude mice tumorigenicity assay (n = 5). SGC7901/DDP cells were treated with ZnO-NP (5 μg/mL) or an equal volume of saline. A: Representative images of dissected tumors from nude mice are shown; B: The average tumor volume was calculated; C: The average tumor weight was calculated. Data are presented as the mean ± SD. Statistic significant differences are indicated: bP < 0.01.
- Citation: Miao YH, Mao LP, Cai XJ, Mo XY, Zhu QQ, Yang FT, Wang MH. Zinc oxide nanoparticles reduce the chemoresistance of gastric cancer by inhibiting autophagy. World J Gastroenterol 2021; 27(25): 3851-3862
- URL: https://www.wjgnet.com/1007-9327/full/v27/i25/3851.htm
- DOI: https://dx.doi.org/10.3748/wjg.v27.i25.3851


