Copyright
©The Author(s) 2021.
World J Gastroenterol. Jun 21, 2021; 27(23): 3357-3371
Published online Jun 21, 2021. doi: 10.3748/wjg.v27.i23.3357
Published online Jun 21, 2021. doi: 10.3748/wjg.v27.i23.3357
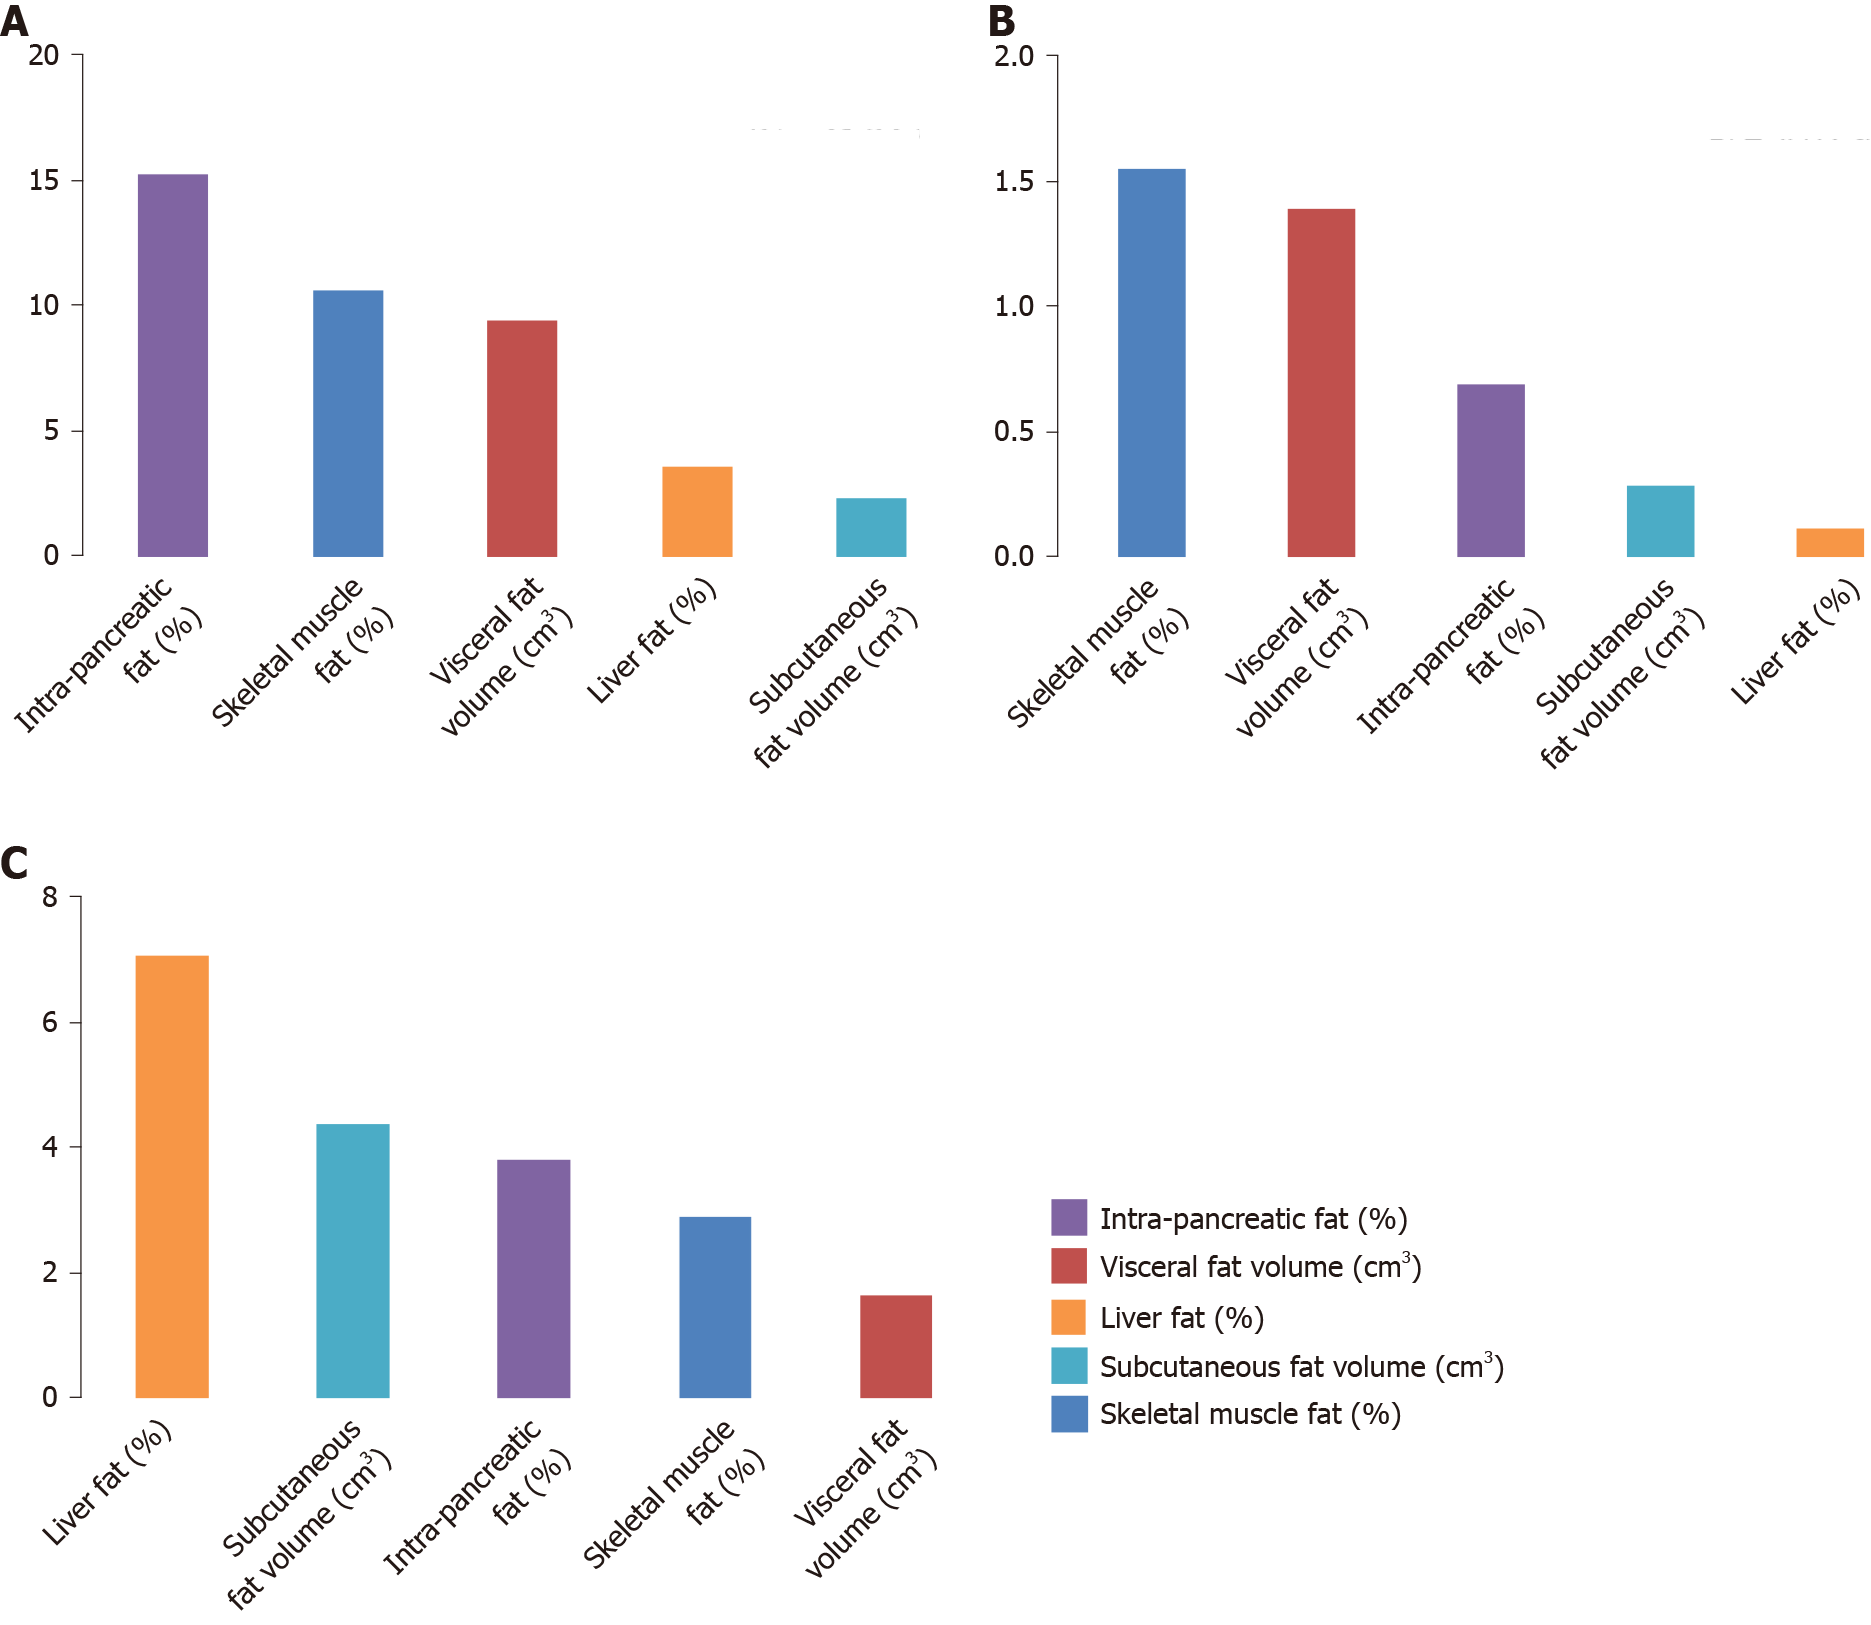
Figure 1 Contributions of the studied fat phenotypes to the variance in circulating levels of pancreatic amylase in the healthy controls, type 2 prediabetes/diabetes mellitus, and new-onset prediabetes/diabetes after acute pancreatitis groups.
Footnote: Data are presented as a percentage of the corresponding abdominal fat phenotype that explains the variance in circulating levels of pancreatic amylase. A: New-onset prediabetes/diabetes after acute pancreatitis; B: Type 2 prediabetes/diabetes mellitus; C: Healthy controls.
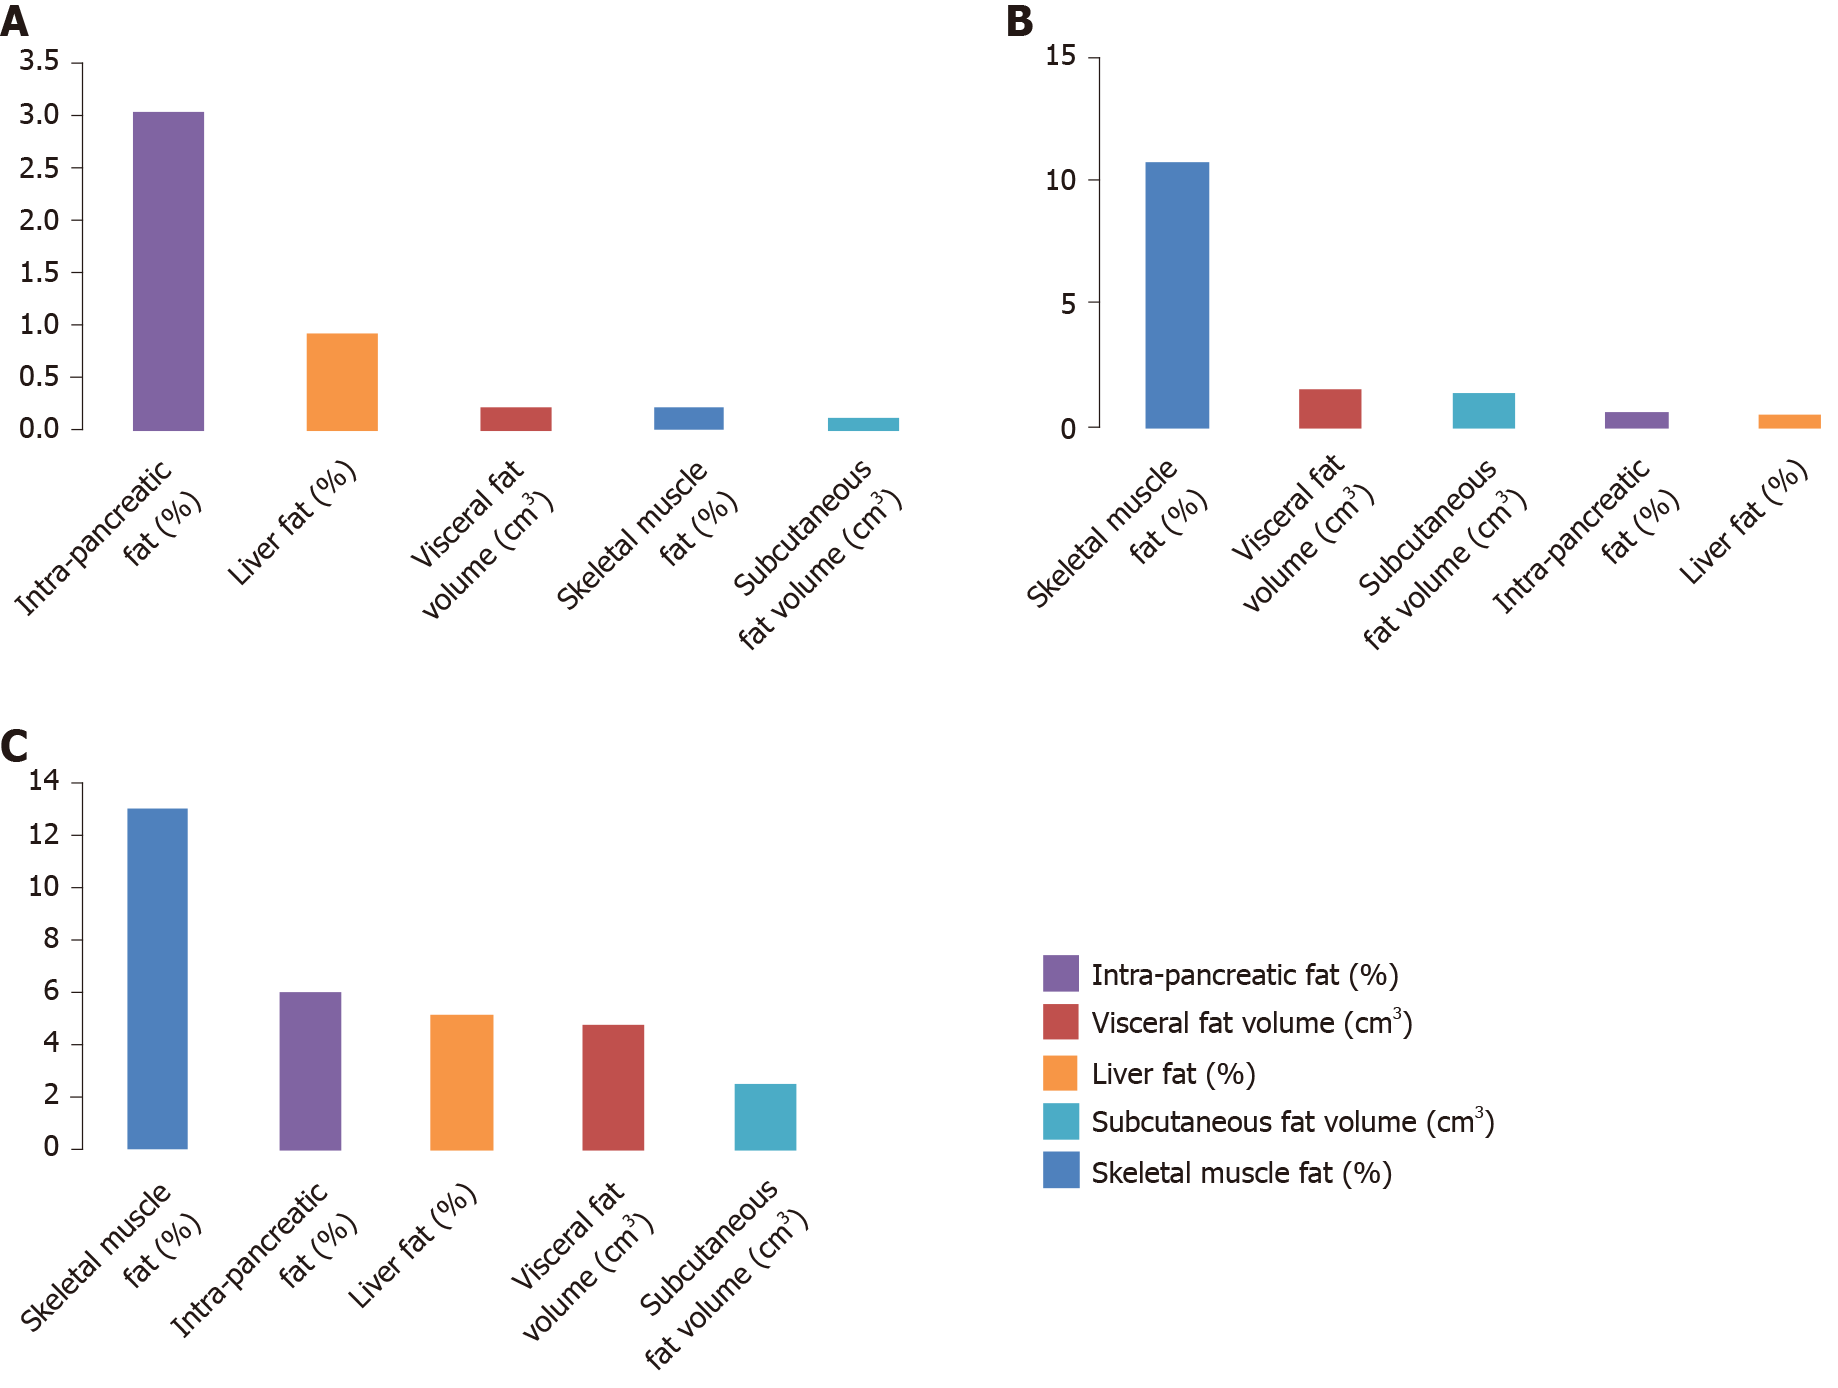
Figure 2 Contributions of the studied fat phenotypes to the variance in circulating levels of pancreatic lipase in the healthy controls, type 2 prediabetes/diabetes mellitus, and new-onset prediabetes/diabetes after acute pancreatitis groups.
Data are presented as a percentage of the corresponding abdominal fat phenotype that explains the variance in circulating levels of pancreatic lipase. A: New-onset prediabetes/diabetes after acute pancreatitis; B: Type 2 prediabetes/diabetes mellitus; C: Healthy controls.
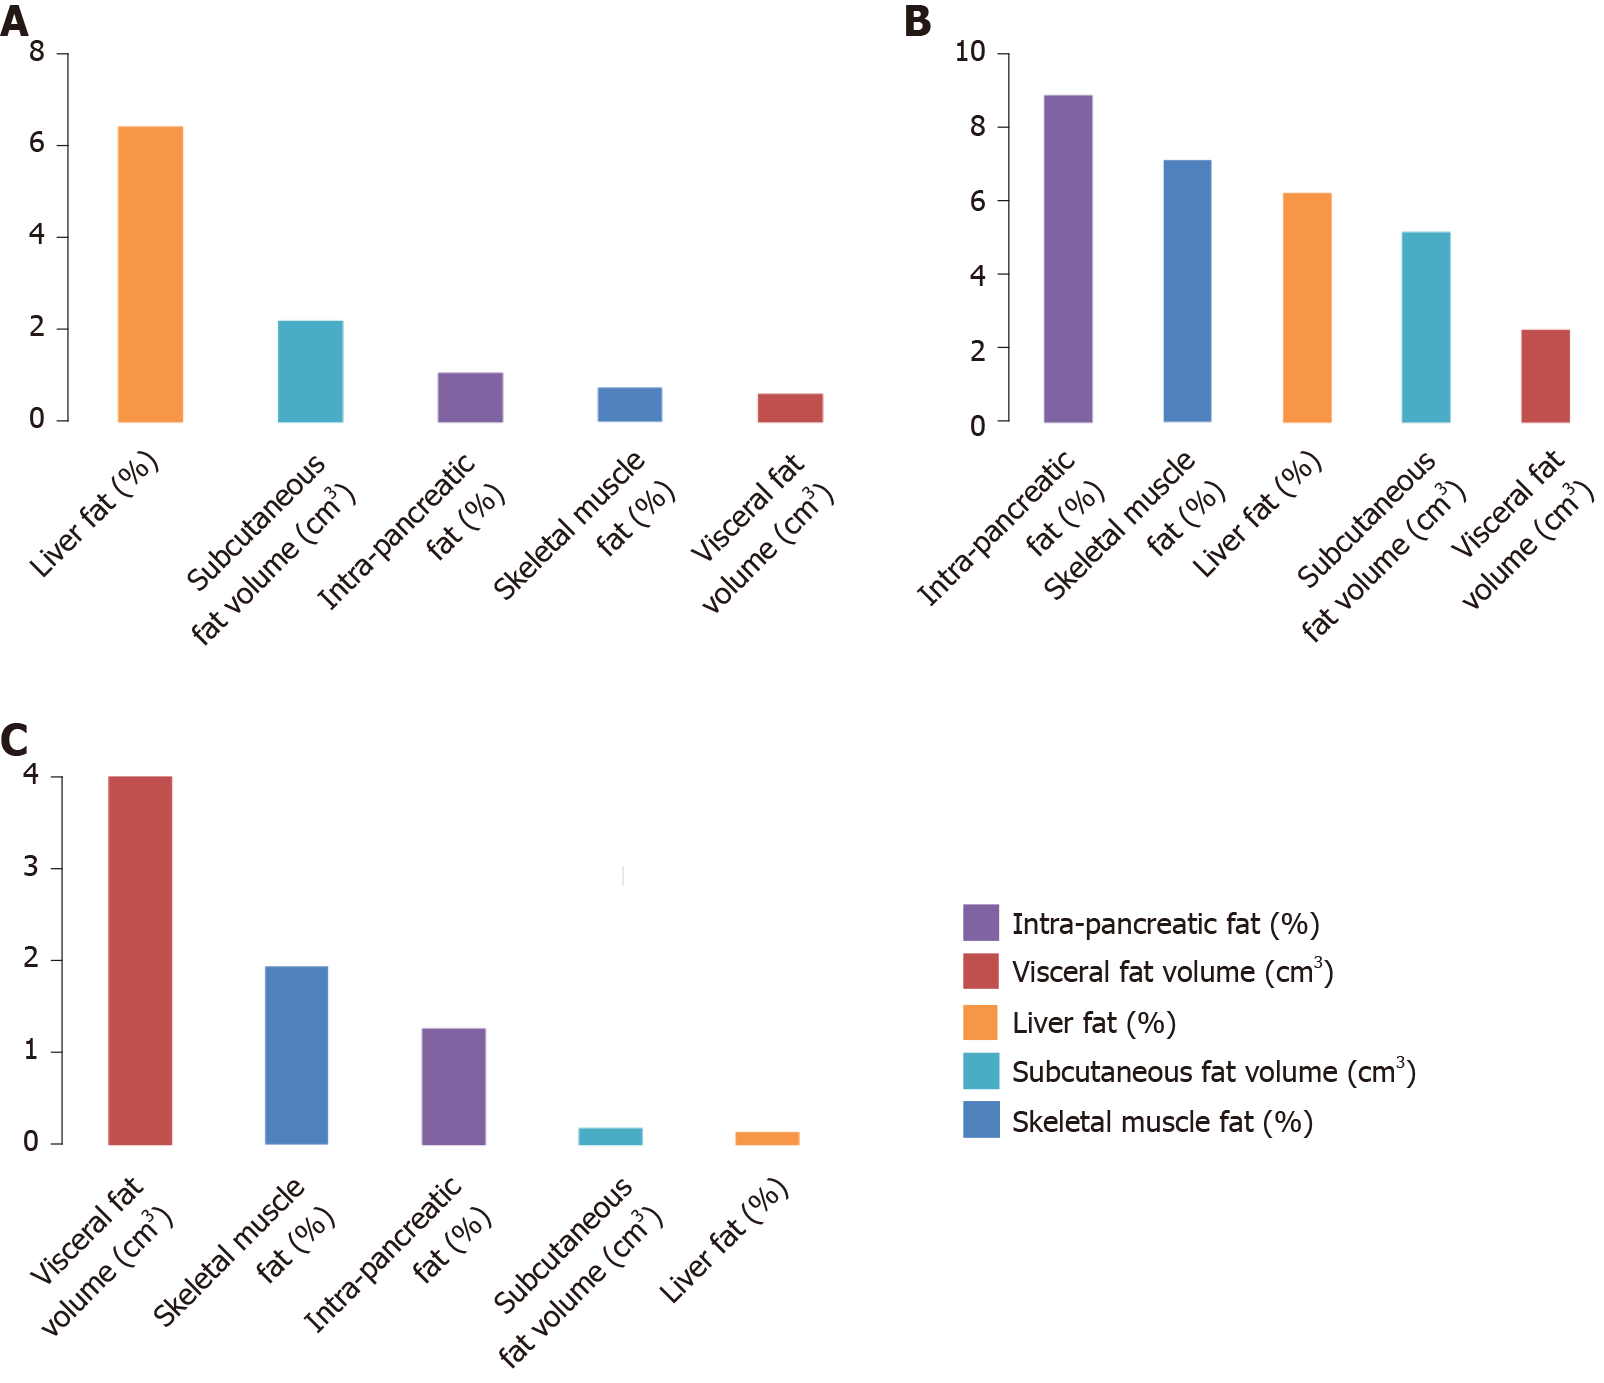
Figure 3 Contributions of the studied fat phenotypes to the variance in circulating levels of chymotrypsin in the healthy controls, type 2 prediabetes/diabetes mellitus, and new-onset prediabetes/diabetes after acute pancreatitis groups.
Data are presented as a percentage of the corresponding abdominal fat phenotype that explains the variance in circulating levels of chymotrypsin. A: New-onset prediabetes/diabetes after acute pancreatitis; B: Type 2 prediabetes/diabetes mellitus; C: Healthy controls.
- Citation: Ko J, Skudder-Hill L, Cho J, Bharmal SH, Petrov MS. Pancreatic enzymes and abdominal adipose tissue distribution in new-onset prediabetes/diabetes after acute pancreatitis. World J Gastroenterol 2021; 27(23): 3357-3371
- URL: https://www.wjgnet.com/1007-9327/full/v27/i23/3357.htm
- DOI: https://dx.doi.org/10.3748/wjg.v27.i23.3357


