Copyright
©The Author(s) 2021.
World J Gastroenterol. Jun 14, 2021; 27(22): 3109-3120
Published online Jun 14, 2021. doi: 10.3748/wjg.v27.i22.3109
Published online Jun 14, 2021. doi: 10.3748/wjg.v27.i22.3109
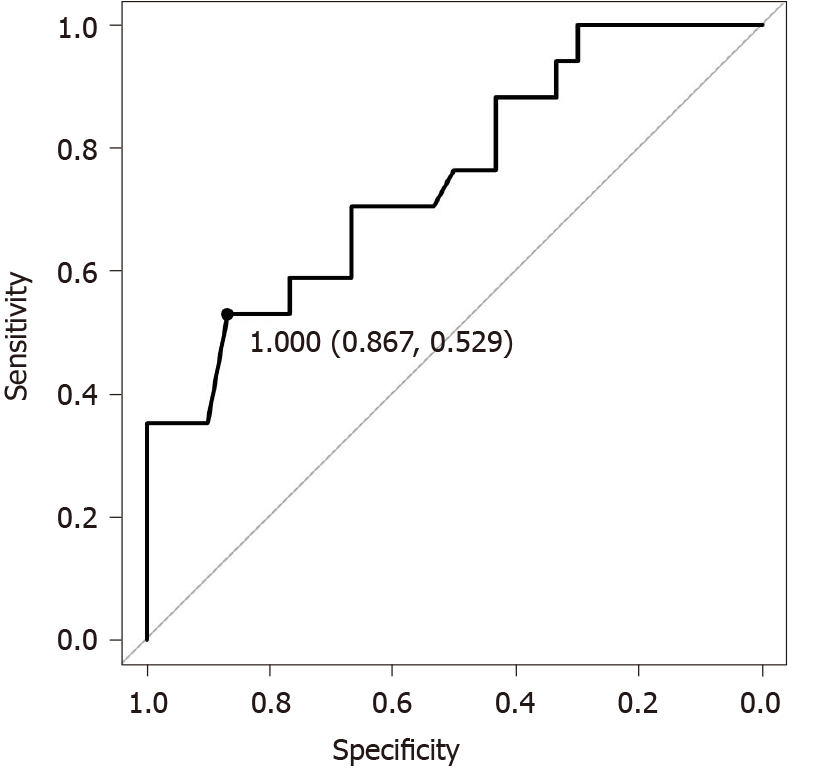
Figure 1
Receiver-operating characteristic analysis for prediction of failure during 3 mo after the reach of tacrolimus high trough level.
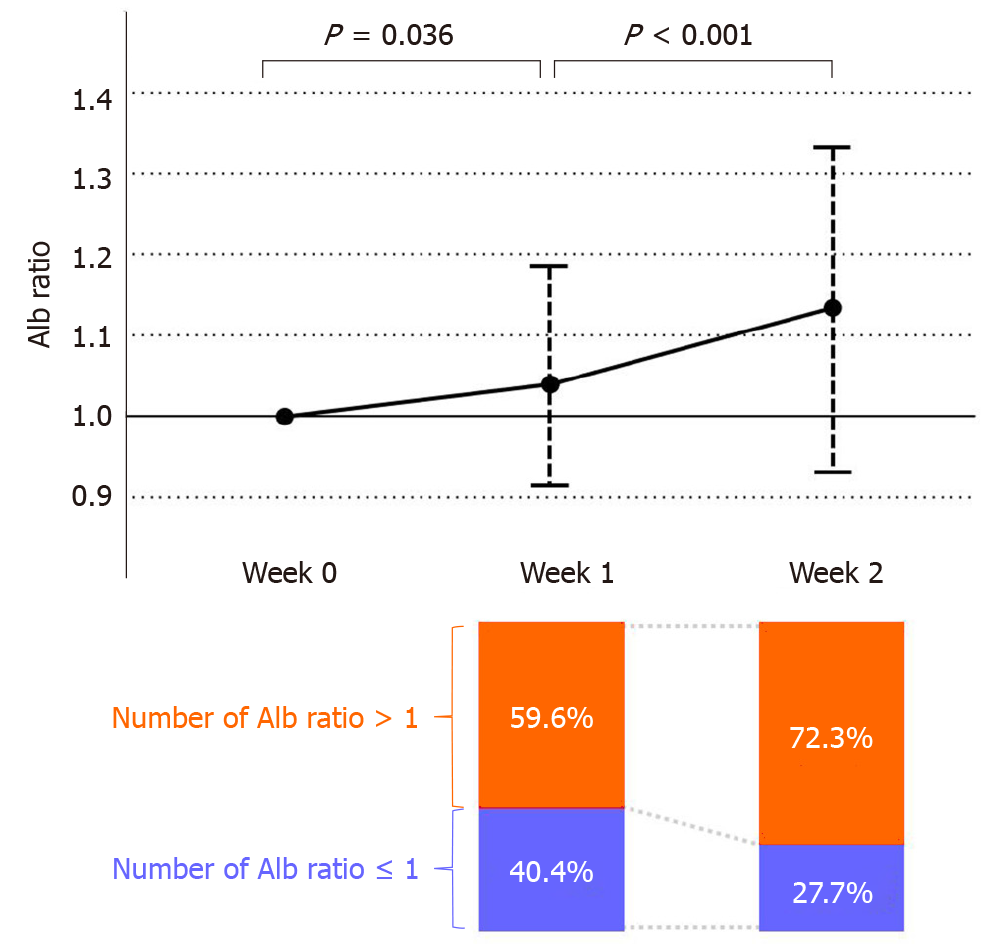
Figure 2 Changes in serum albumin ratio of each week and the percentage of the number of serum albumin ratio > 1 and ≤ 1.
Serum albumin (Alb) ratio at week 1 and week 2 shows the week 1/week 0 and week 2/week 0 Alb ratio, respectively. The percentage of the number of Alb ratio > 1 and ≤ 1 at week 1 and week 2 are shown in the bar graph.
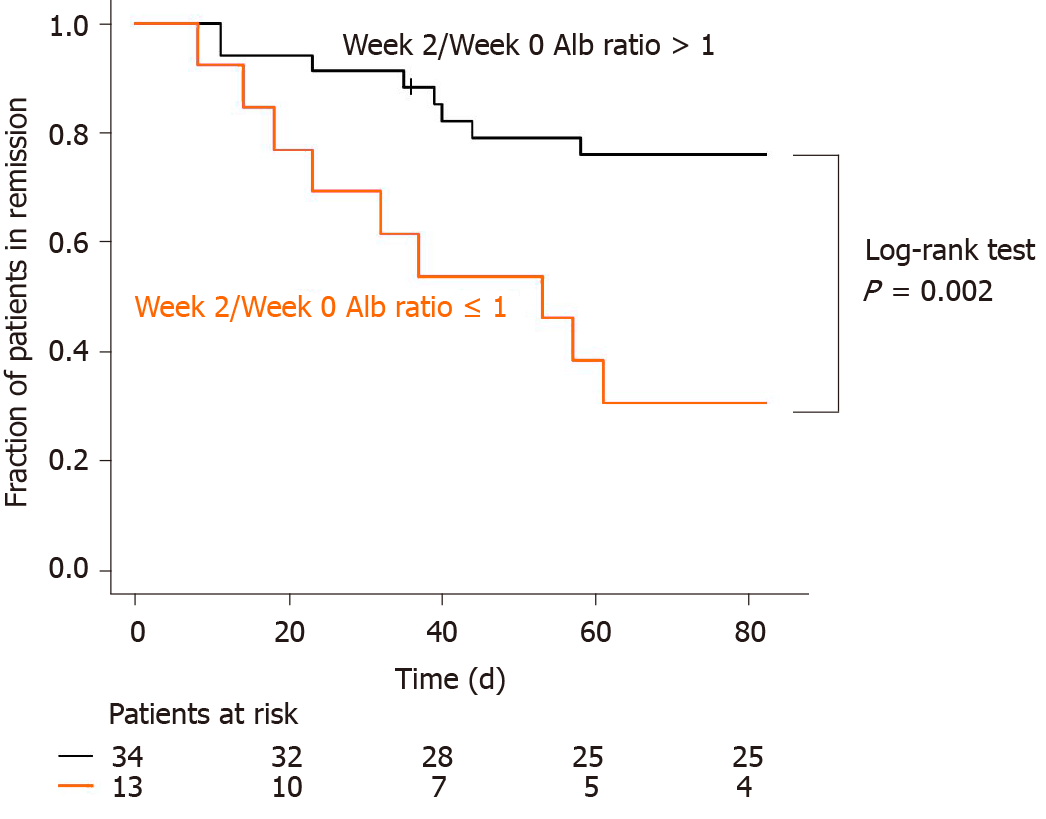
Figure 3
Kaplan-Meier time-to-relapse curve of patients with ulcerative colitis in relation to the week 2/week 0 albumin ratio > 1 and ≤ 1.
- Citation: Ishida N, Miyazu T, Tamura S, Tani S, Yamade M, Iwaizumi M, Hamaya Y, Osawa S, Furuta T, Sugimoto K. Early serum albumin changes in patients with ulcerative colitis treated with tacrolimus will predict clinical outcome. World J Gastroenterol 2021; 27(22): 3109-3120
- URL: https://www.wjgnet.com/1007-9327/full/v27/i22/3109.htm
- DOI: https://dx.doi.org/10.3748/wjg.v27.i22.3109


