Copyright
©The Author(s) 2021.
World J Gastroenterol. Jun 7, 2021; 27(21): 2834-2849
Published online Jun 7, 2021. doi: 10.3748/wjg.v27.i21.2834
Published online Jun 7, 2021. doi: 10.3748/wjg.v27.i21.2834
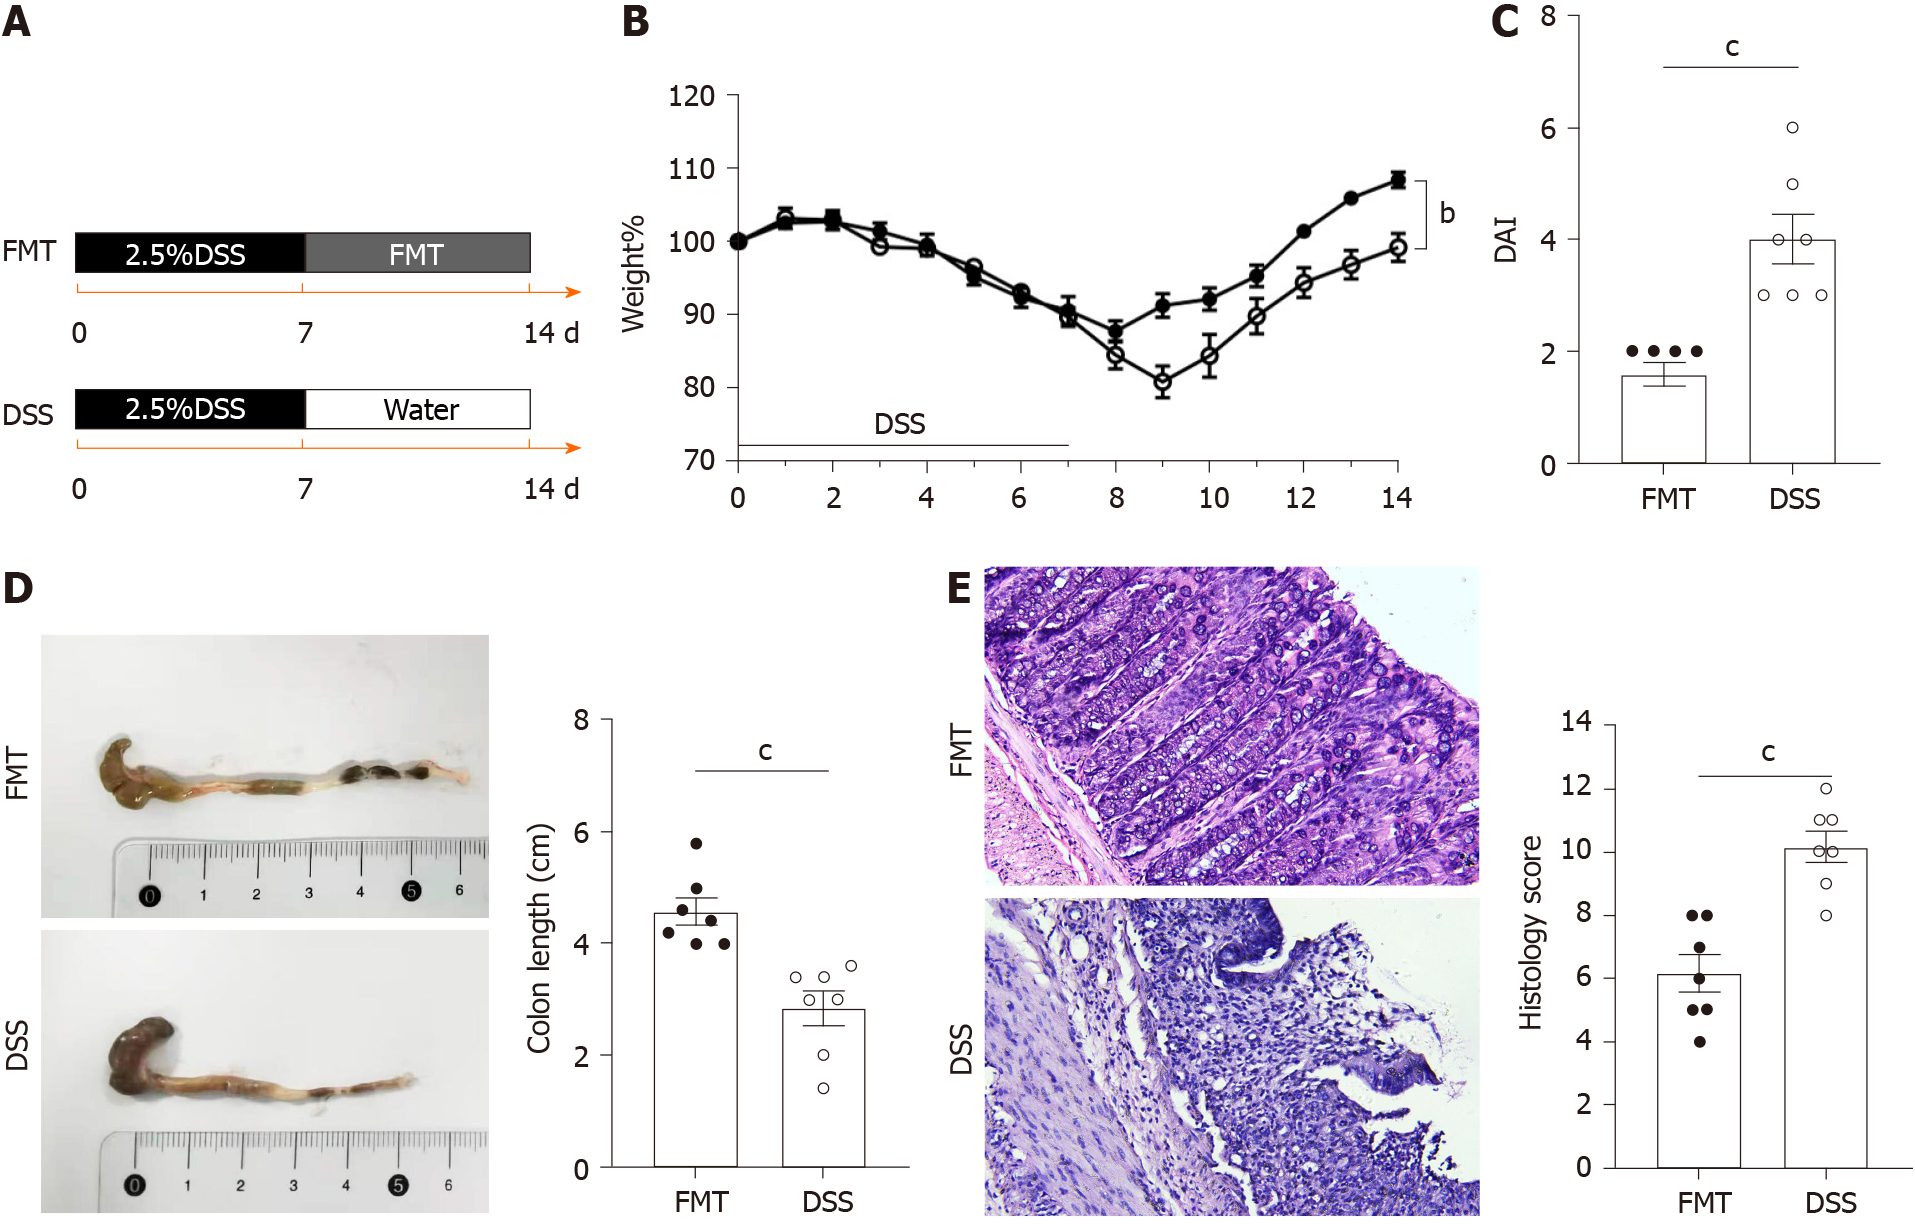
Figure 1 Therapeutic fecal microbiota transplantation ameliorates dextran sodium sulphate-induced inflammation.
A: Schematic representation of fecal microbiota transplantation treatment in the dextran sodium sulphate colitis model (n = 7 per group); B: Daily changes of bodyweight of each group during the disease process; C: Disease activity index scores of each group were evaluated after sacrifice; D: Macroscopic view of colon was observed, colon length from each group was measured; E: Serial sections of colon tissues were stained with hematoxylin and eosin, original magnification 200 ×, Histological scores of each group were determined. Values of aP < 0.05, bP < 0.01 and cP < 0.001 were considered as statistically significant. DSS: Dextran sodium sulphate; FMT: Fecal microbiota transplantation.
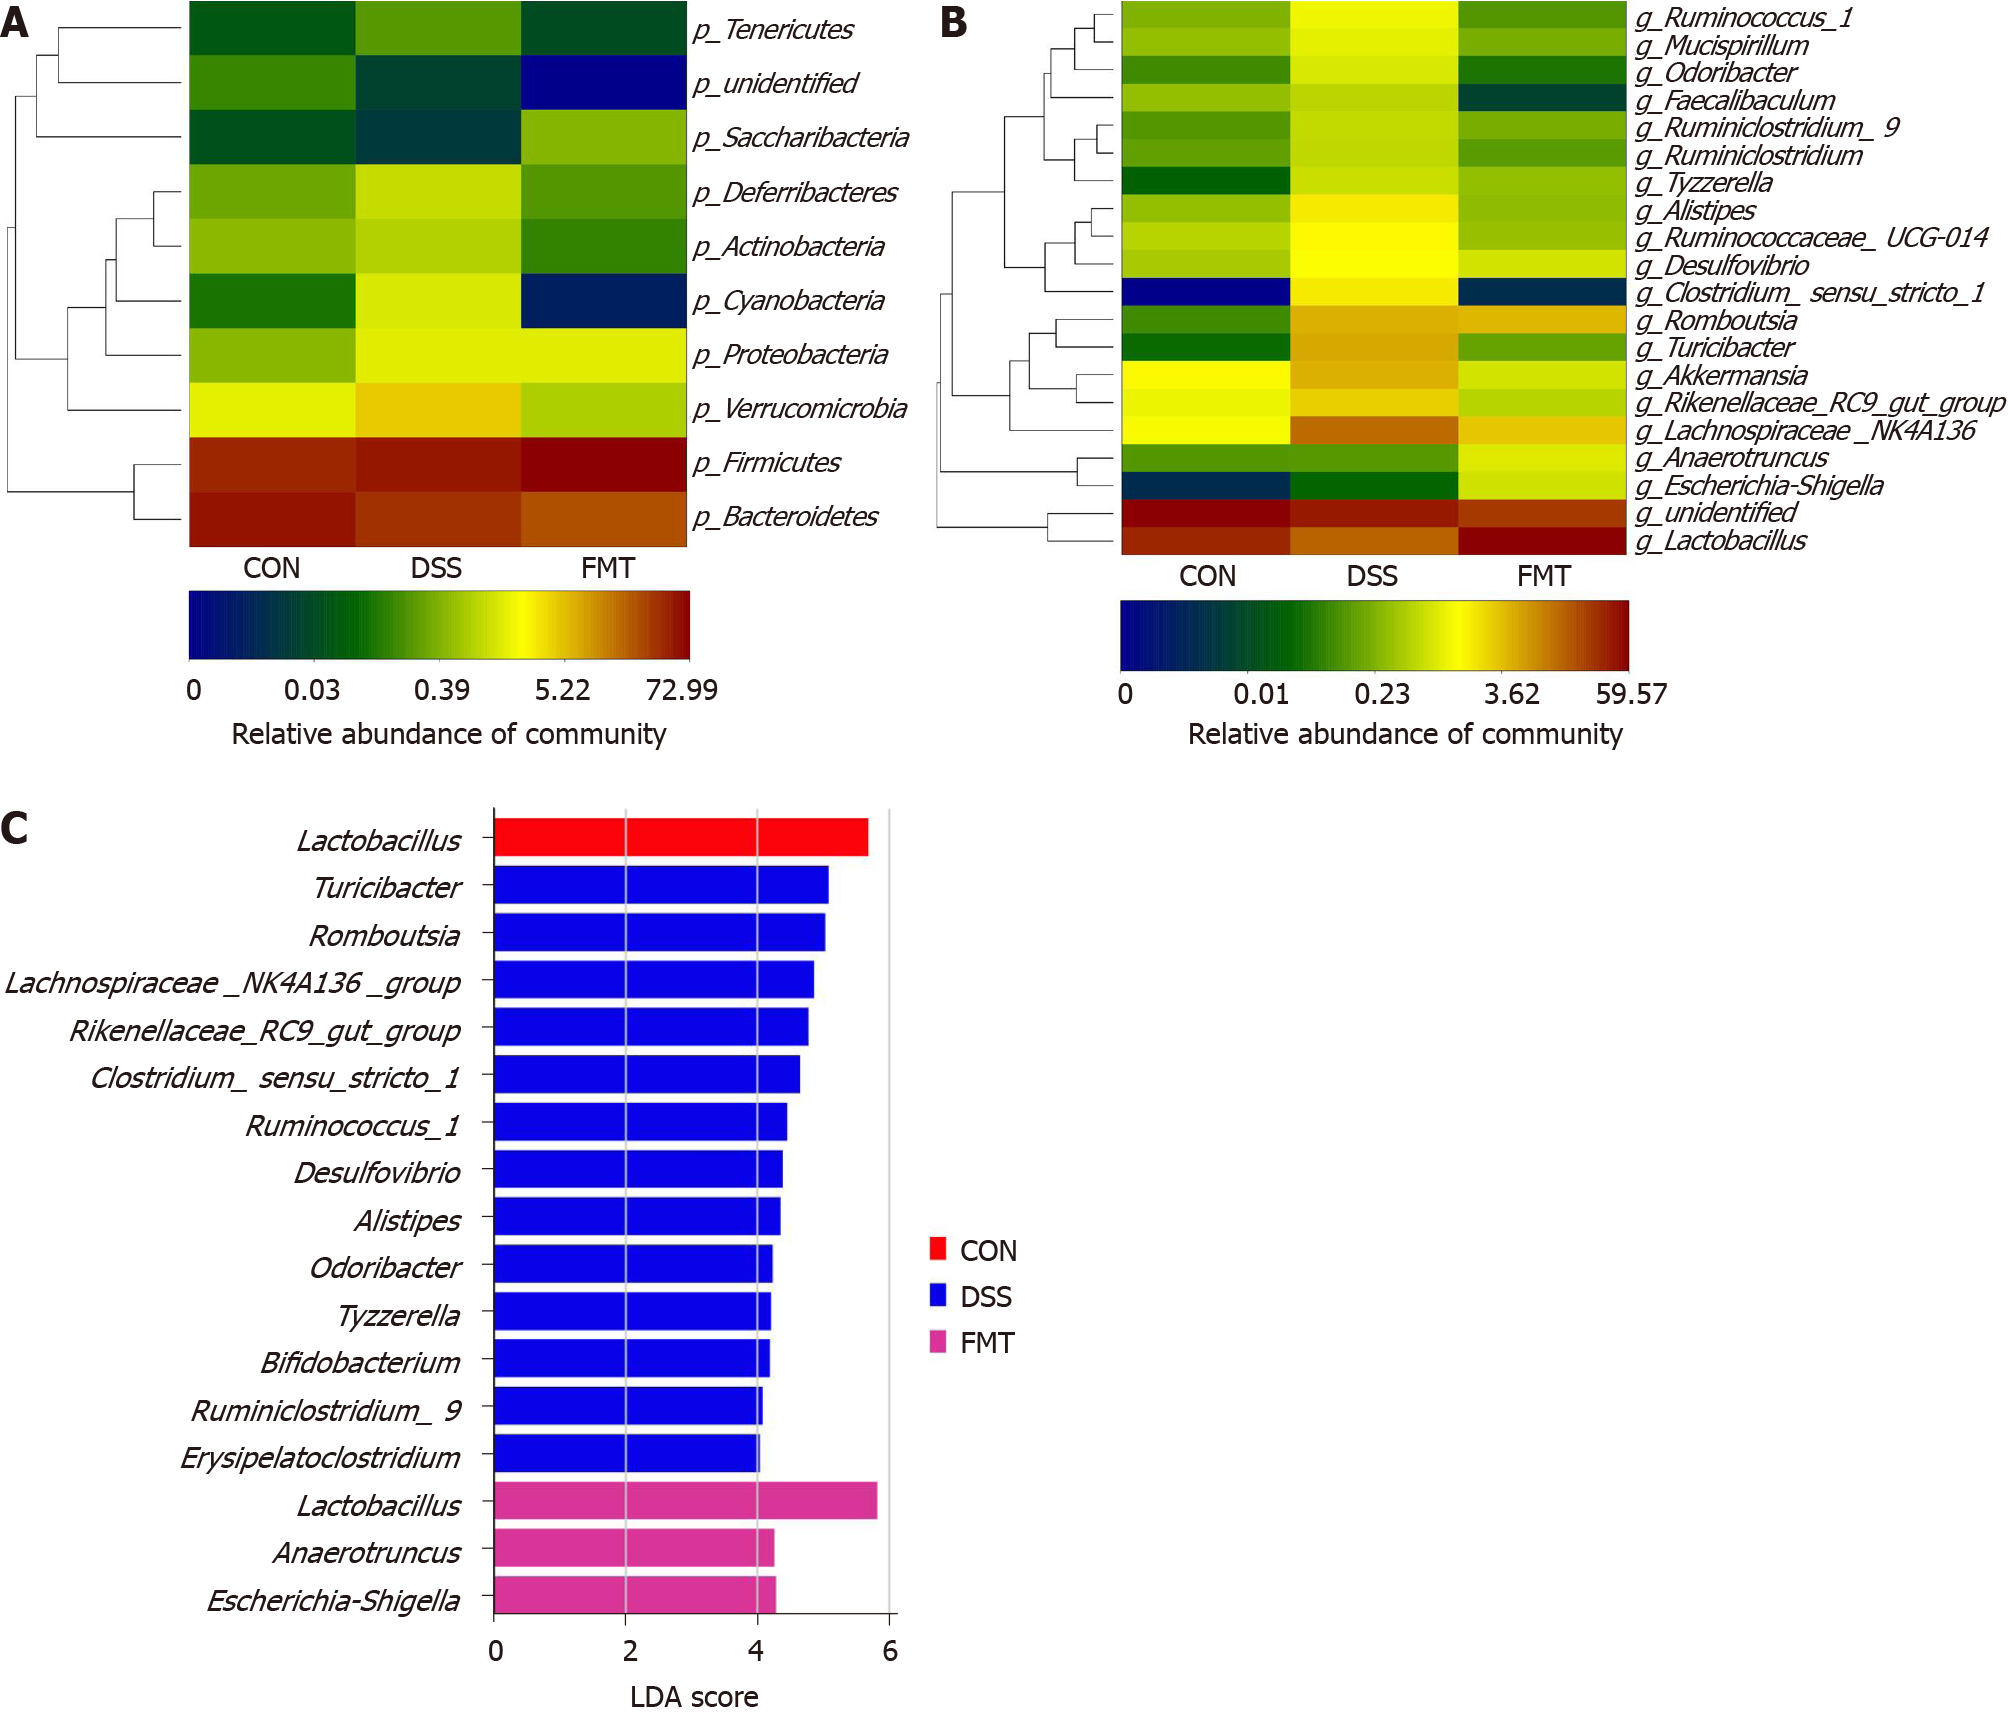
Figure 2 Fecal microbiota transplantation modulated the overall structure of gut microbiota.
A and B: Heatmap of the relative abundance at the level of phylum and genus; C: The linear discriminant analysis effect size analysis at the level of genus in groups. CON: Control; DSS: Dextran sodium sulphate; FMT: Fecal microbiota transplantation.
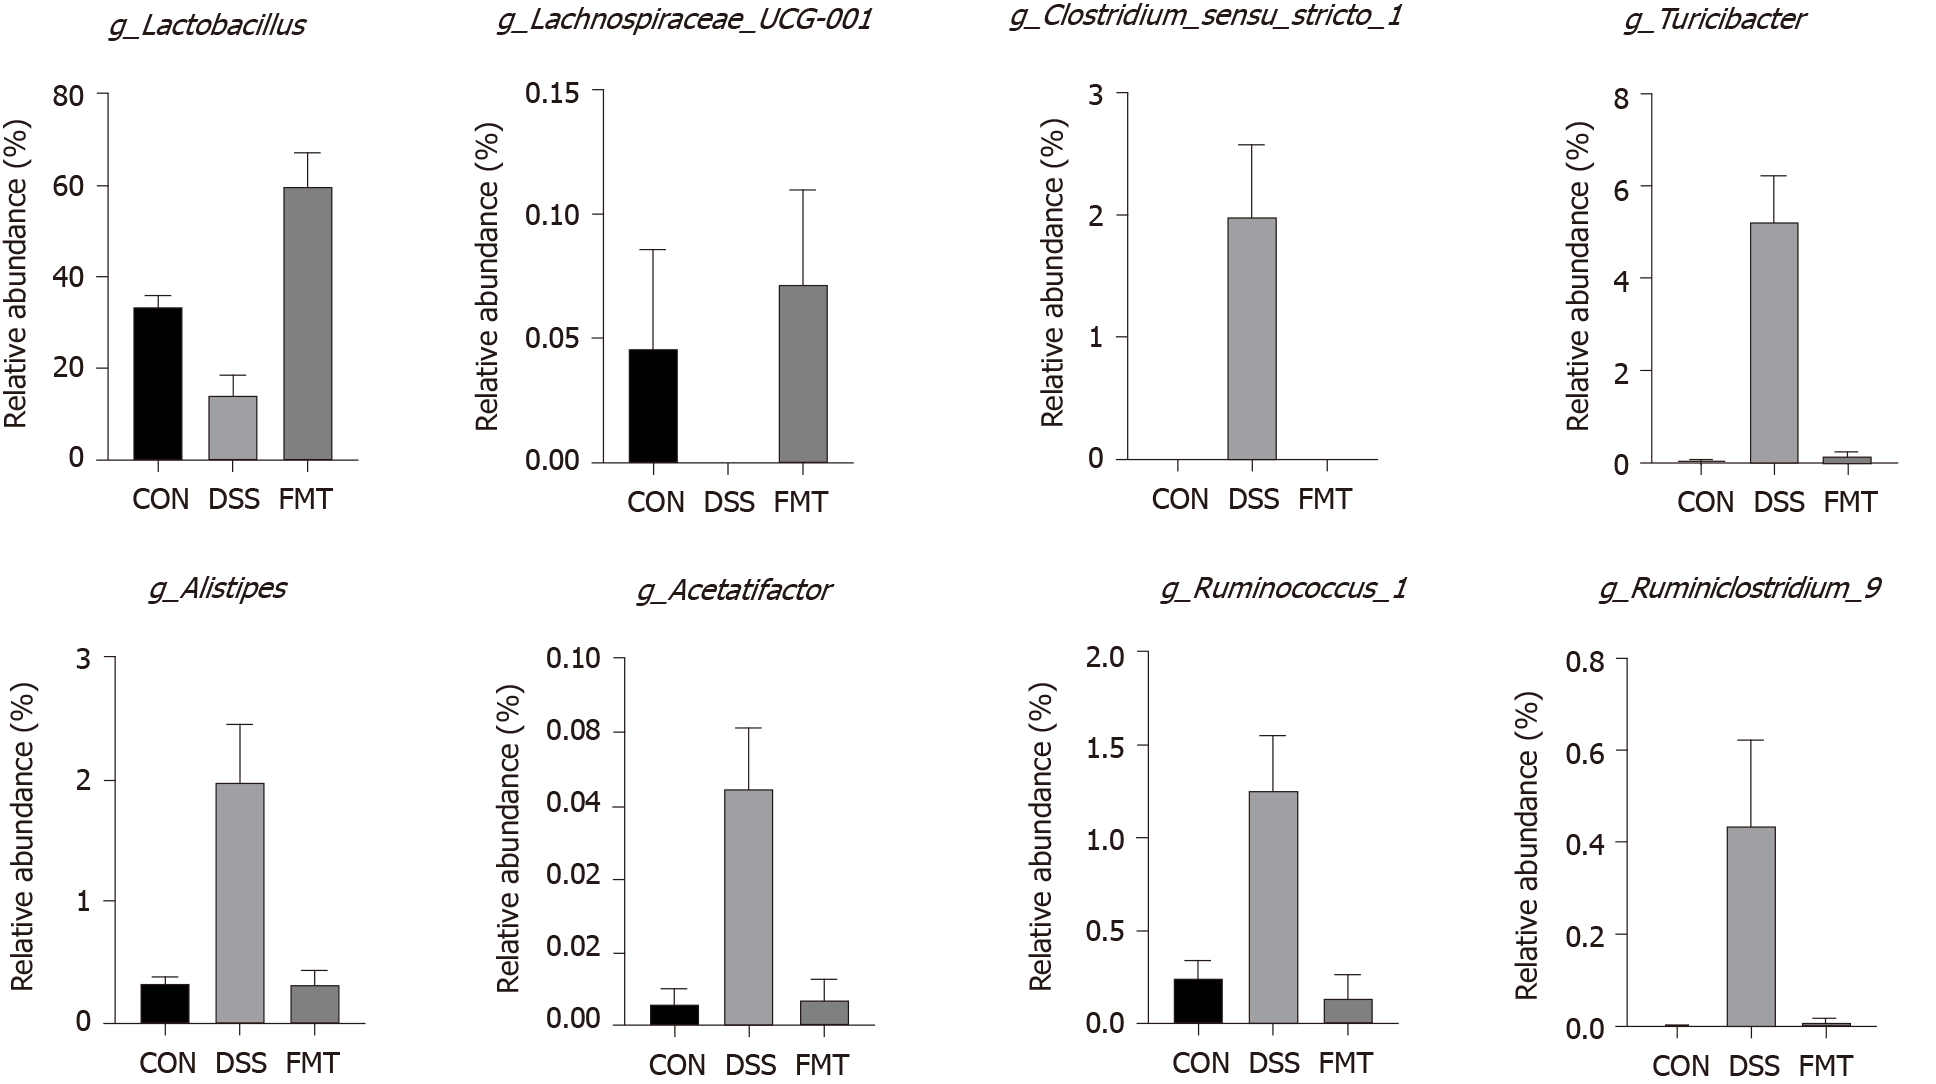
Figure 3 Fecal microbiota transplantation significantly regulated the relative abundance of eight genera compared with dextran sodium sulphate group.
Lactobacillus [cP < 0.001, one-way analysis of variance (ANOVA)]; Lachnospiraceae_UCG-001 (aP < 0.05, one-way ANOVA); Clostridium_sensu_stricto_1 (cP = 0.001, one-way ANOVA); Turicibacter (cP < 0.001, one-way ANOVA); Alistipes (cP = 0.001, one-way ANOVA); Acetatifactor (cP = 0.001, one-way ANOVA); Ruminococcus_1 (bP < 0.01, one-way ANOVA); Ruminiclostridium_6 (aP < 0.05, one-way ANOVA). CON: Control; DSS: Dextran sodium sulphate; FMT: Fecal microbiota transplantation.
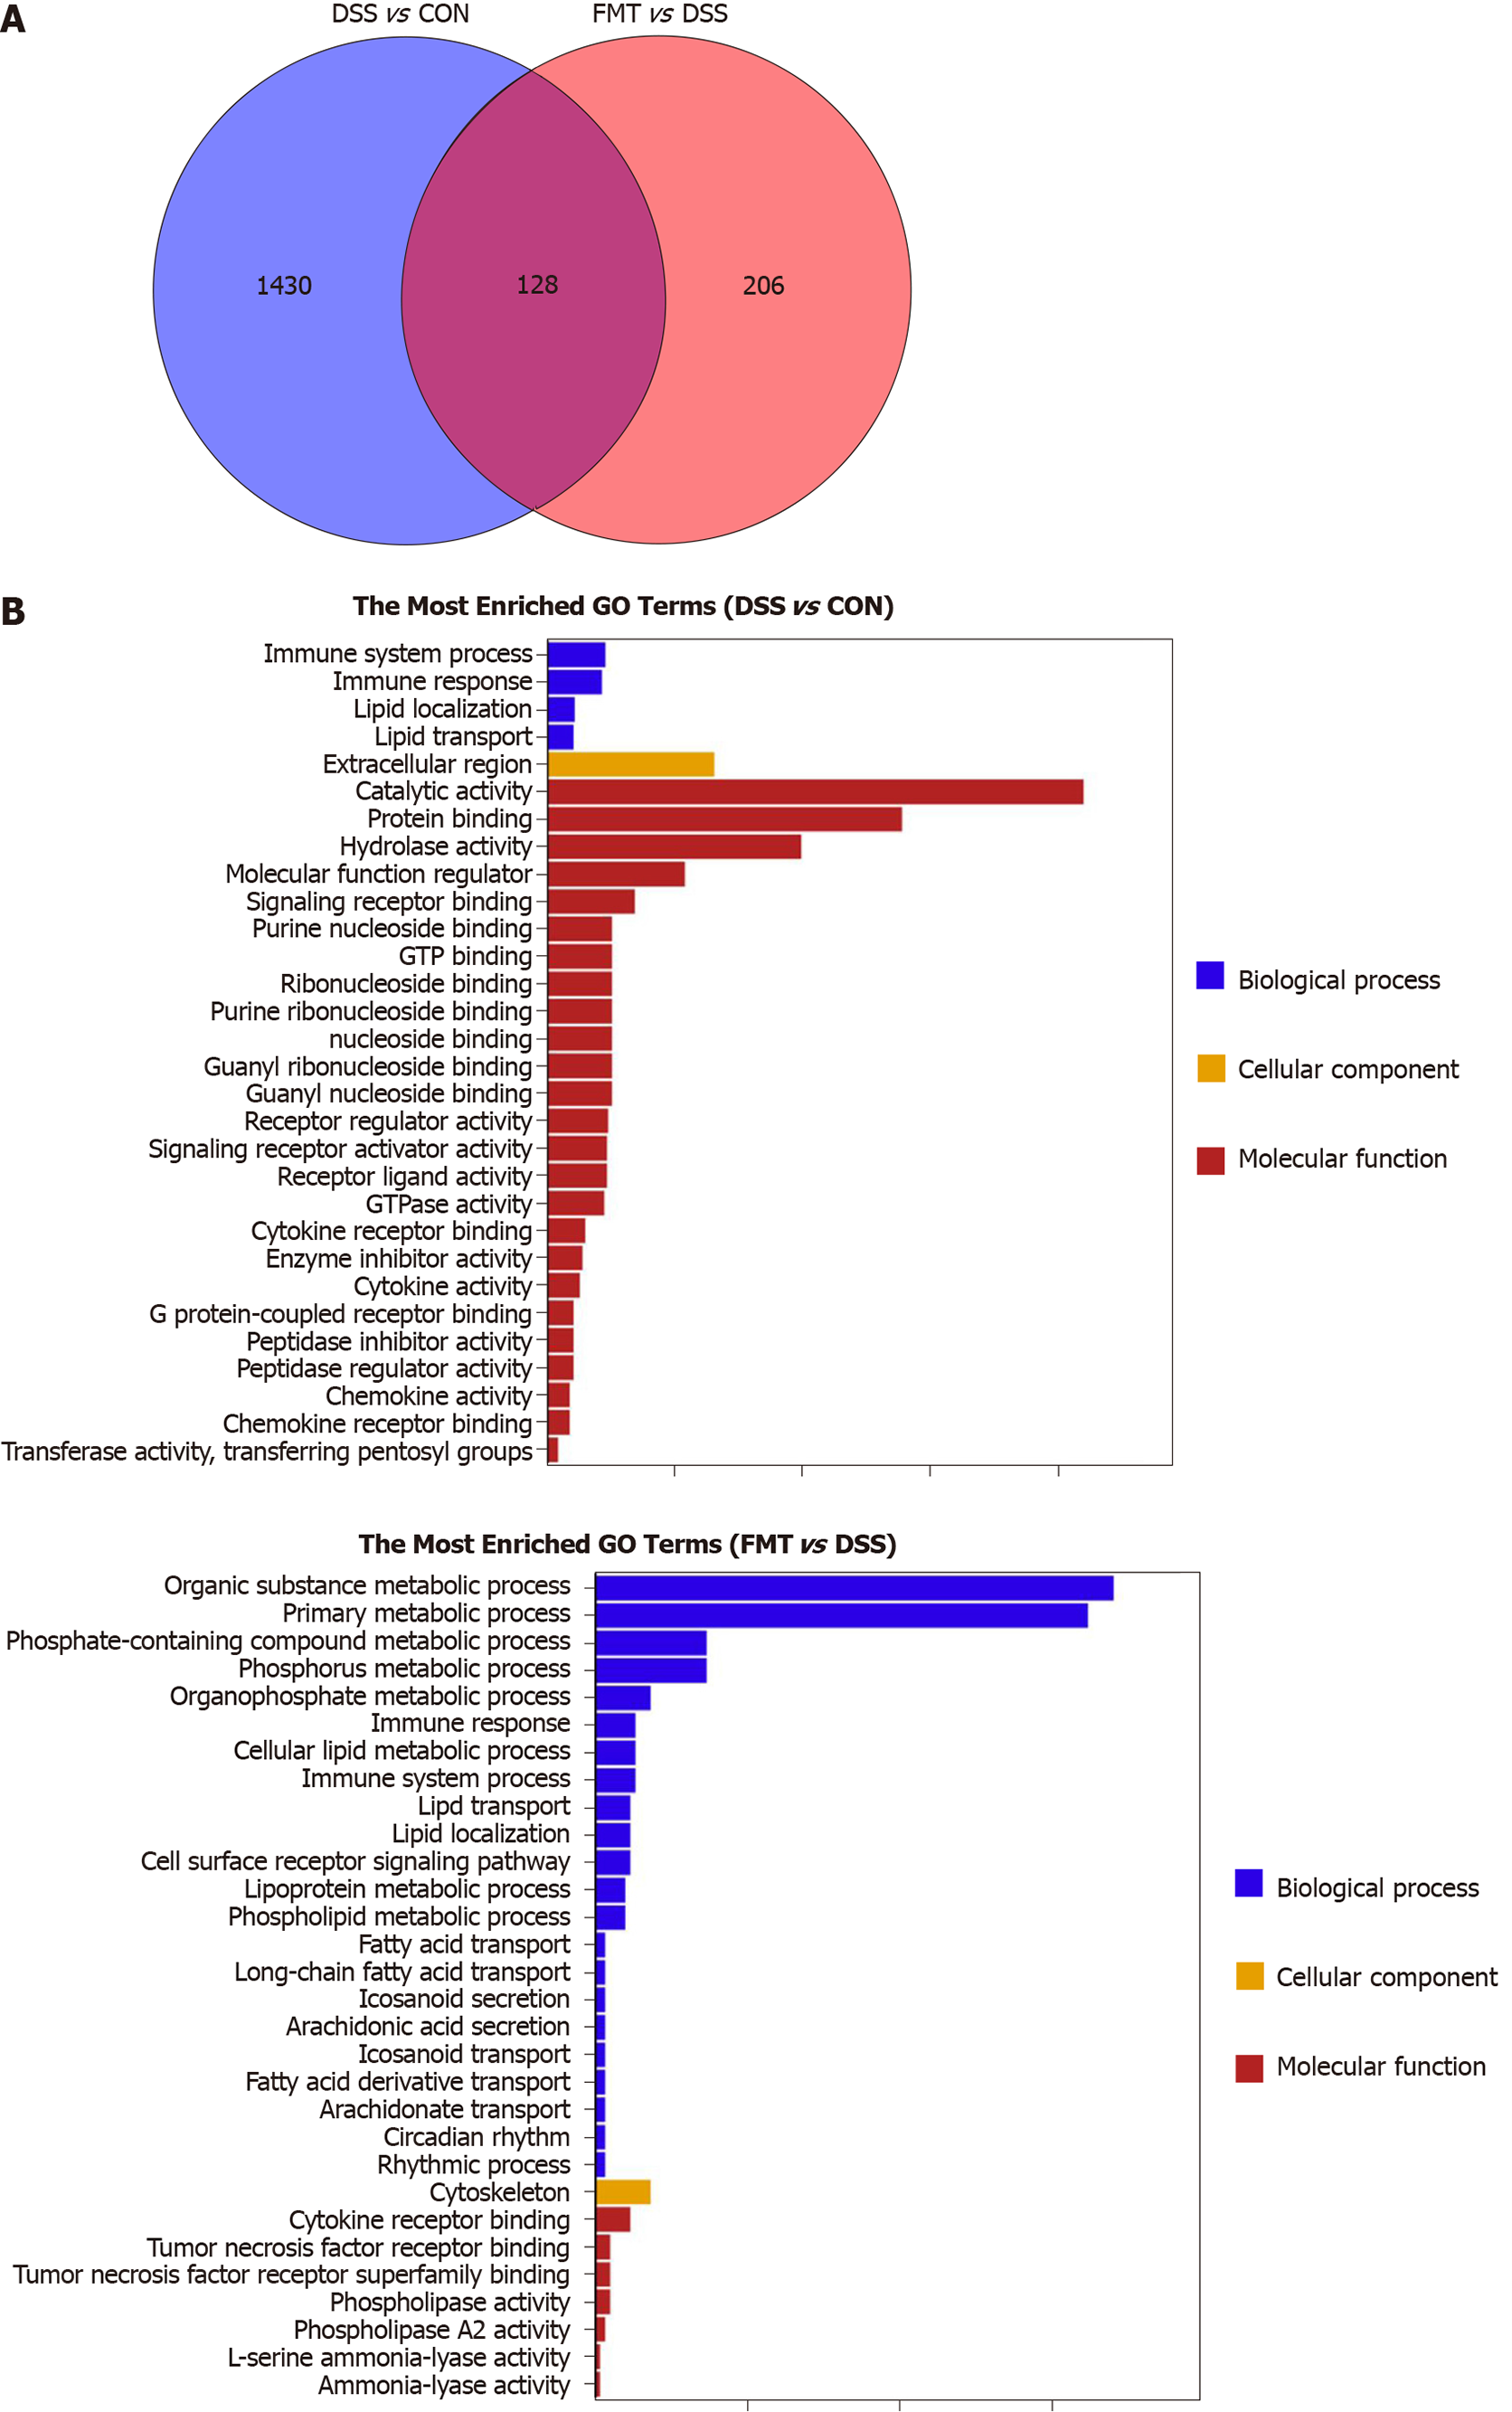
Figure 4 Effect of fecal microbiota transplantation on colonic transcriptome in colitis mice.
A: Venn diagram with genes regulated between dextran sodium sulphate (DSS) and fecal microbiota transplantation (FMT) or shared between the two sections; B: The top 30 gene ontology terms with the most significant enrichment between DSS group and control (CON) group (left), FMT group and DSS group (right). After DSS treatment (left), the differentially expressed genes in mice colon were mainly associated with immune system process, while after FMT (right), the differentially expressed genes were mainly related to metabolic process and immune response. GO: Gene ontology.
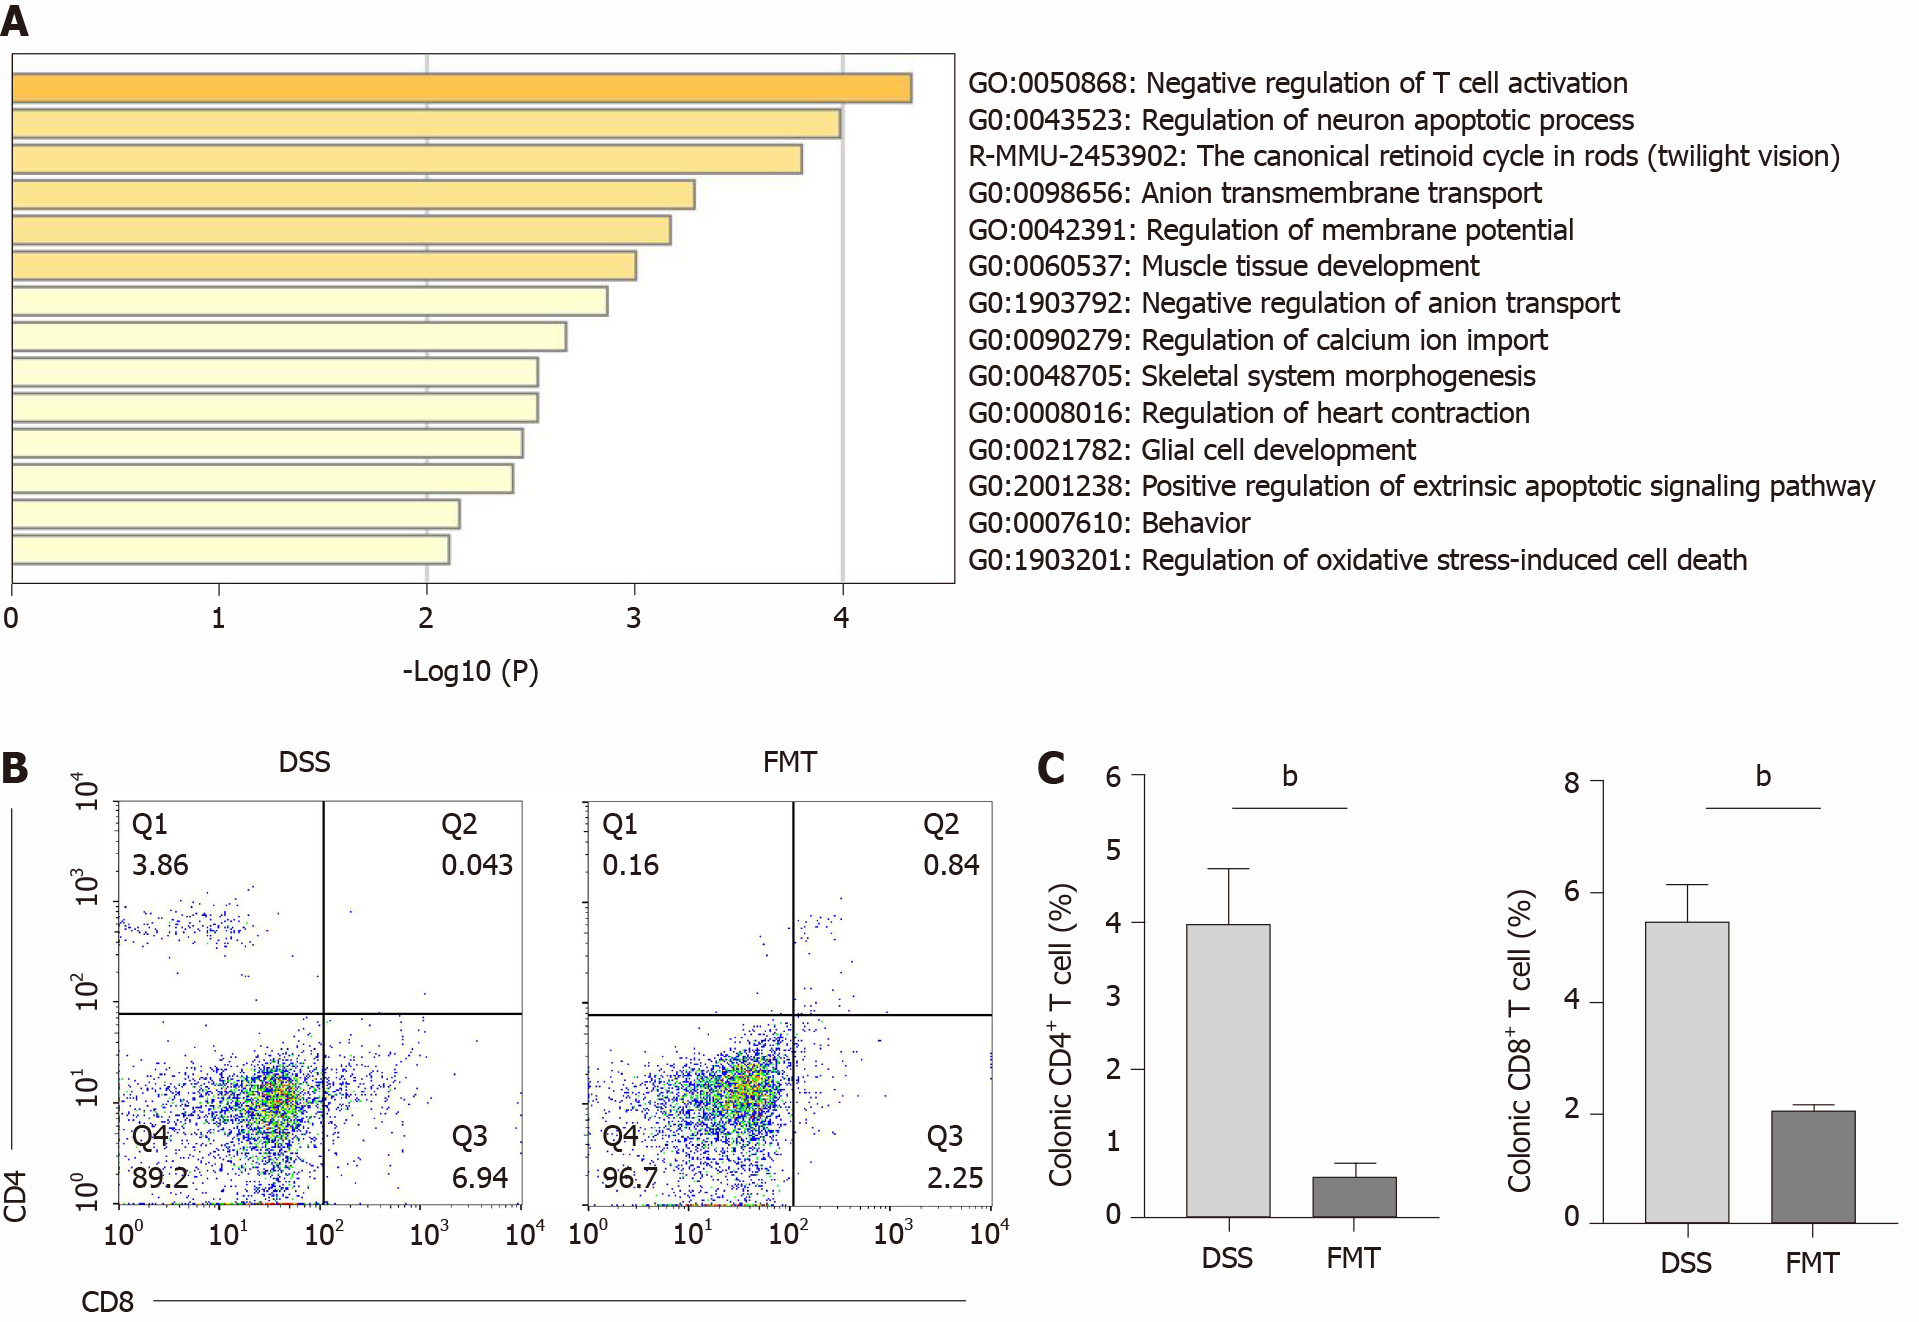
Figure 5 Therapeutic fecal microbiota transplantation modulates T cell phenotypes.
A: Differentially expressed genes between control, dextran sodium sulphate (DSS) and fecal microbiota transplantation (FMT) group analyzed in Metascape; B: Colonic CD4+ and CD8+ T cells in DSS and FMT group; n = 4 mice per group; C: Bar charts of the percentage of T cells (bP < 0.01). CON: Control.
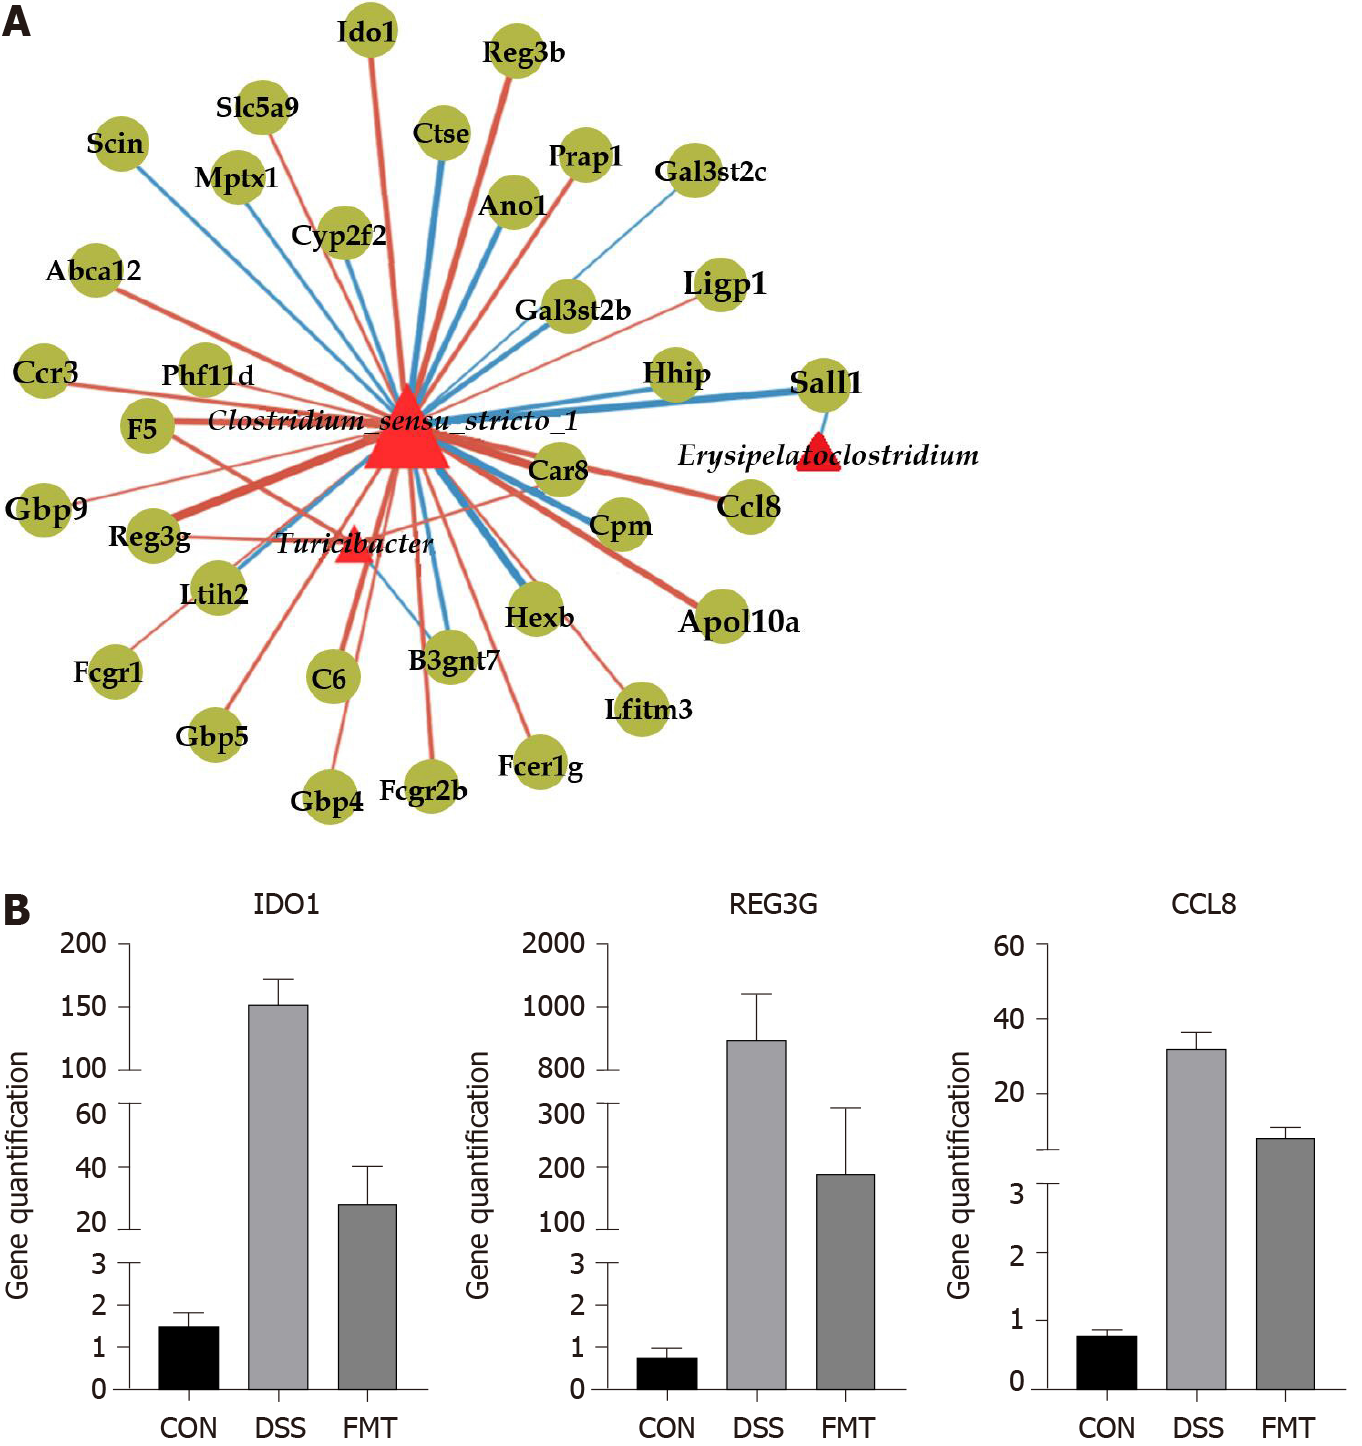
Figure 6 Network analysis of fecal microbiota transplantation in colitis mice.
A: Network visualizing significant gene-microbe correlations (r > 0.8, P < 0.05). B: Relative quantification of transcript level of indoleamine 2,3-dioxygenase 1 (IDO1), antimicrobial C-type lectin regenerating islet-derived 3 gamma (REG3G) and monocyte chemoattractant protein 2 (CCL8) in groups (all the P < 0.001, one-way analysis of variance). CON: Control; DSS: Dextran sodium sulphate; FMT: Fecal microbiota transplantation.
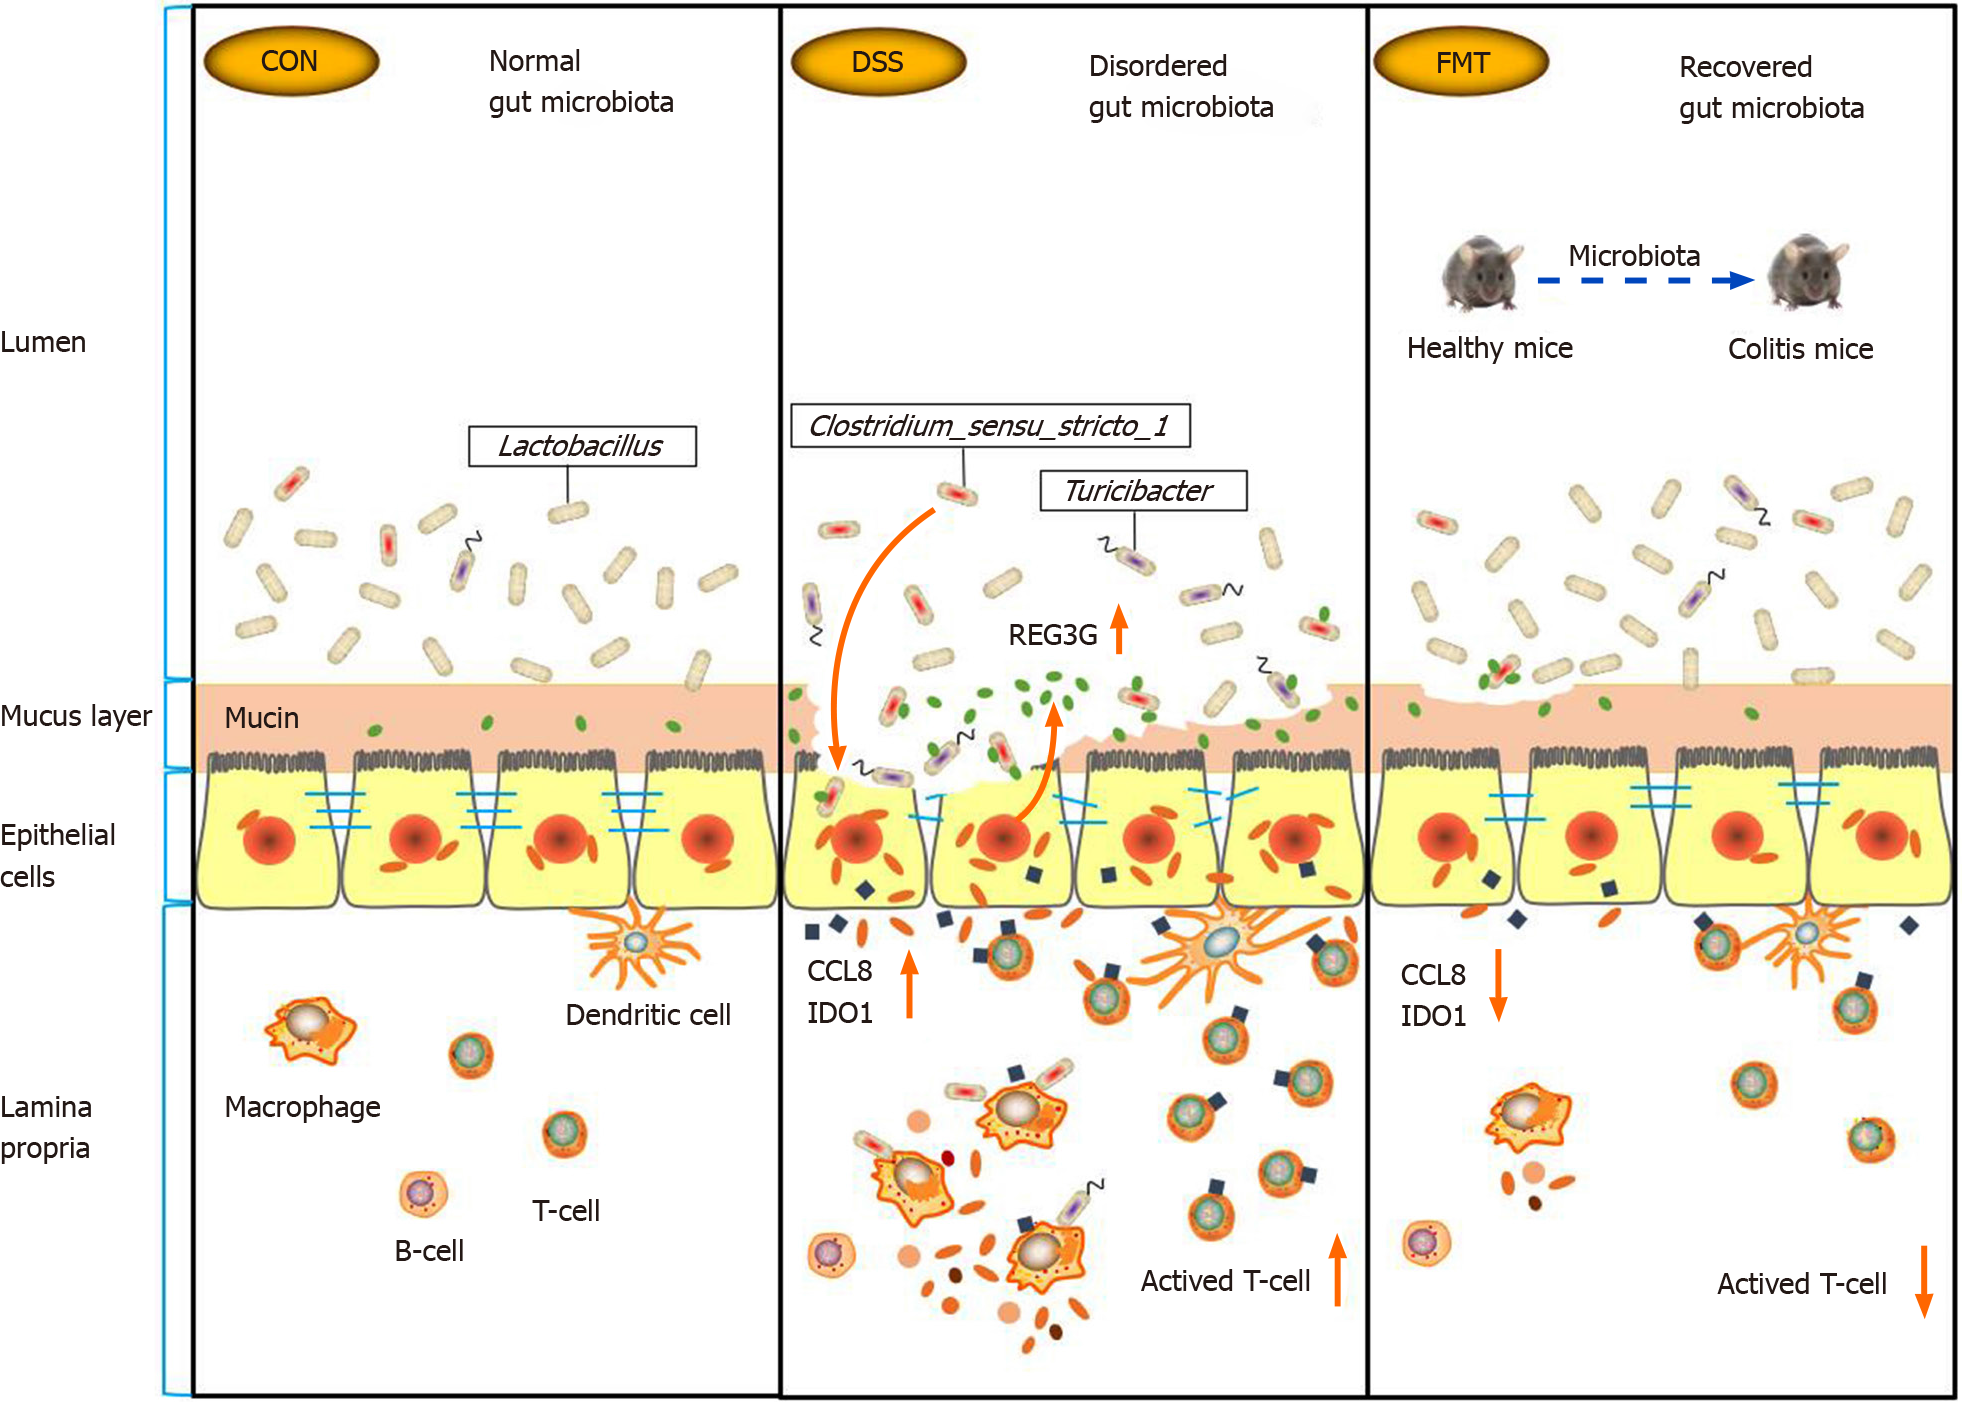
Figure 7 Summary scheme of the mechanisms underlying the therapeutic effect of fecal microbiota transplantation on experimental colitis.
CCL8: Monocyte chemoattractant protein 2; CON: Control; DSS: Dextran sodium sulphate; FMT: Fecal microbiota transplantation; IDO1: Indoleamine 2,3-dioxygenase 1; REG3G: Antimicrobial C-type lectin regenerating islet-derived 3 gamma.
- Citation: Wen X, Wang HG, Zhang MN, Zhang MH, Wang H, Yang XZ. Fecal microbiota transplantation ameliorates experimental colitis via gut microbiota and T-cell modulation. World J Gastroenterol 2021; 27(21): 2834-2849
- URL: https://www.wjgnet.com/1007-9327/full/v27/i21/2834.htm
- DOI: https://dx.doi.org/10.3748/wjg.v27.i21.2834


