Copyright
©The Author(s) 2021.
World J Gastroenterol. May 14, 2021; 27(18): 2141-2159
Published online May 14, 2021. doi: 10.3748/wjg.v27.i18.2141
Published online May 14, 2021. doi: 10.3748/wjg.v27.i18.2141
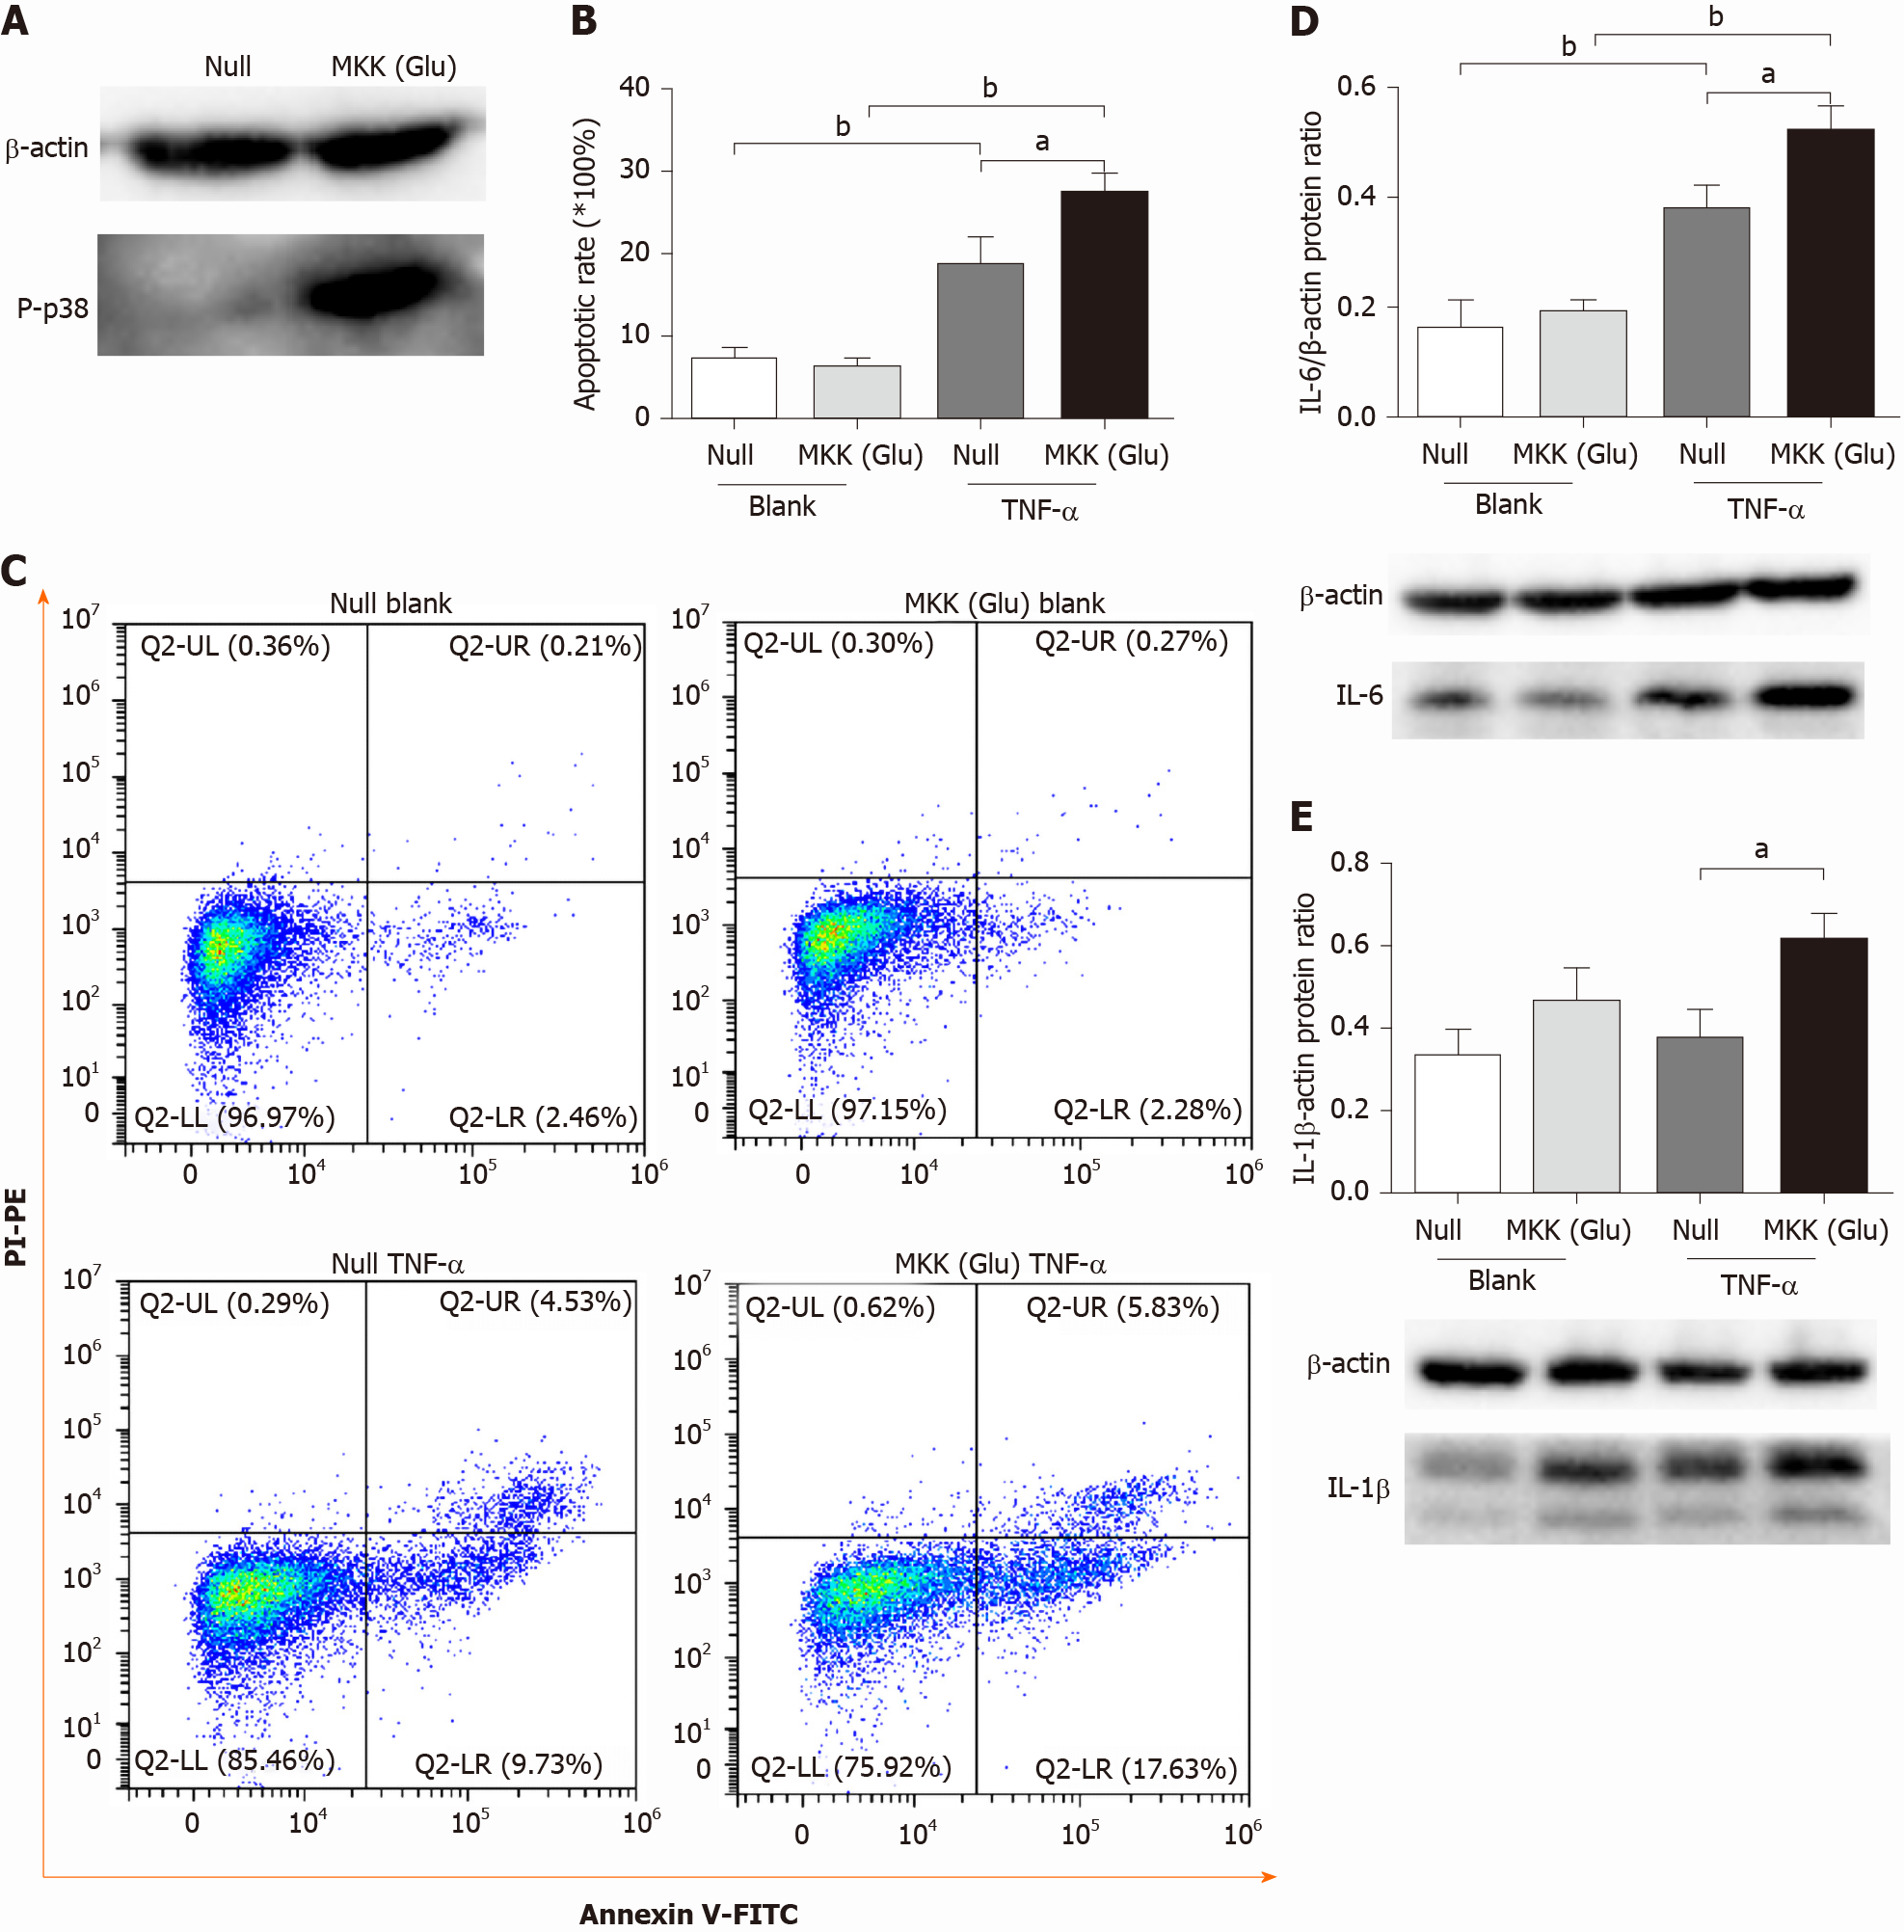
Figure 1 p38 mitogen-activated protein kinase overactivation aggravates tumor necrosis factor-alpha-induced apoptosis and inflammatory cytokine expression in pulmonary microvascular endothelial cells.
A: Western blotting confirmed that mitogen-activated protein kinase kinase (Glu) transfection constitutively activated p38 mitogen-activated protein kinase in pulmonary microvascular endothelial cells; B: Apoptotic rate in null and mitogen-activated protein kinase kinase (Glu) pulmonary microvascular endothelial cells stimulated with or without tumor necrosis factor-alpha for 24 h; C: Representative images of flow cytometry analysis for apoptosis; D: The expression level of interleukin-6 in each group; E: The expression level of interleukin-1β in each group. Data are expressed as mean ± SE of 3-4 samples per group; aP < 0.05; bP < 0.01. IL: Interleukin; MKK: Mitogen-activated protein kinase kinase; TNF-α: Tumor necrosis factor-alpha.
Figure 2 Effects of SB203580 on pancreatic histopathological changes and histopathological severity scores.
A: Representative hematoxylin and eosin images of pancreatic sections (magnification 200 ×); I: Sham group; II: Severe acute pancreatitis (SAP) group; III: SAP + SB2.5 group; IV: SAP + SB5 group; V: SAP + SB10 group; B: Total scores; C: Edema scores; D: Inflammatory infiltration scores; E: Hemorrhage scores; F: Necrosis scores. B-F: Pancreatic histopathology scores in different groups; Data were expressed as mean ± SE; aP < 0.05 vs sham group; bP < 0.05 vs SAP group; cP < 0.05 vs SAP + SB2.5 group. SAP: Severe acute pancreatitis.
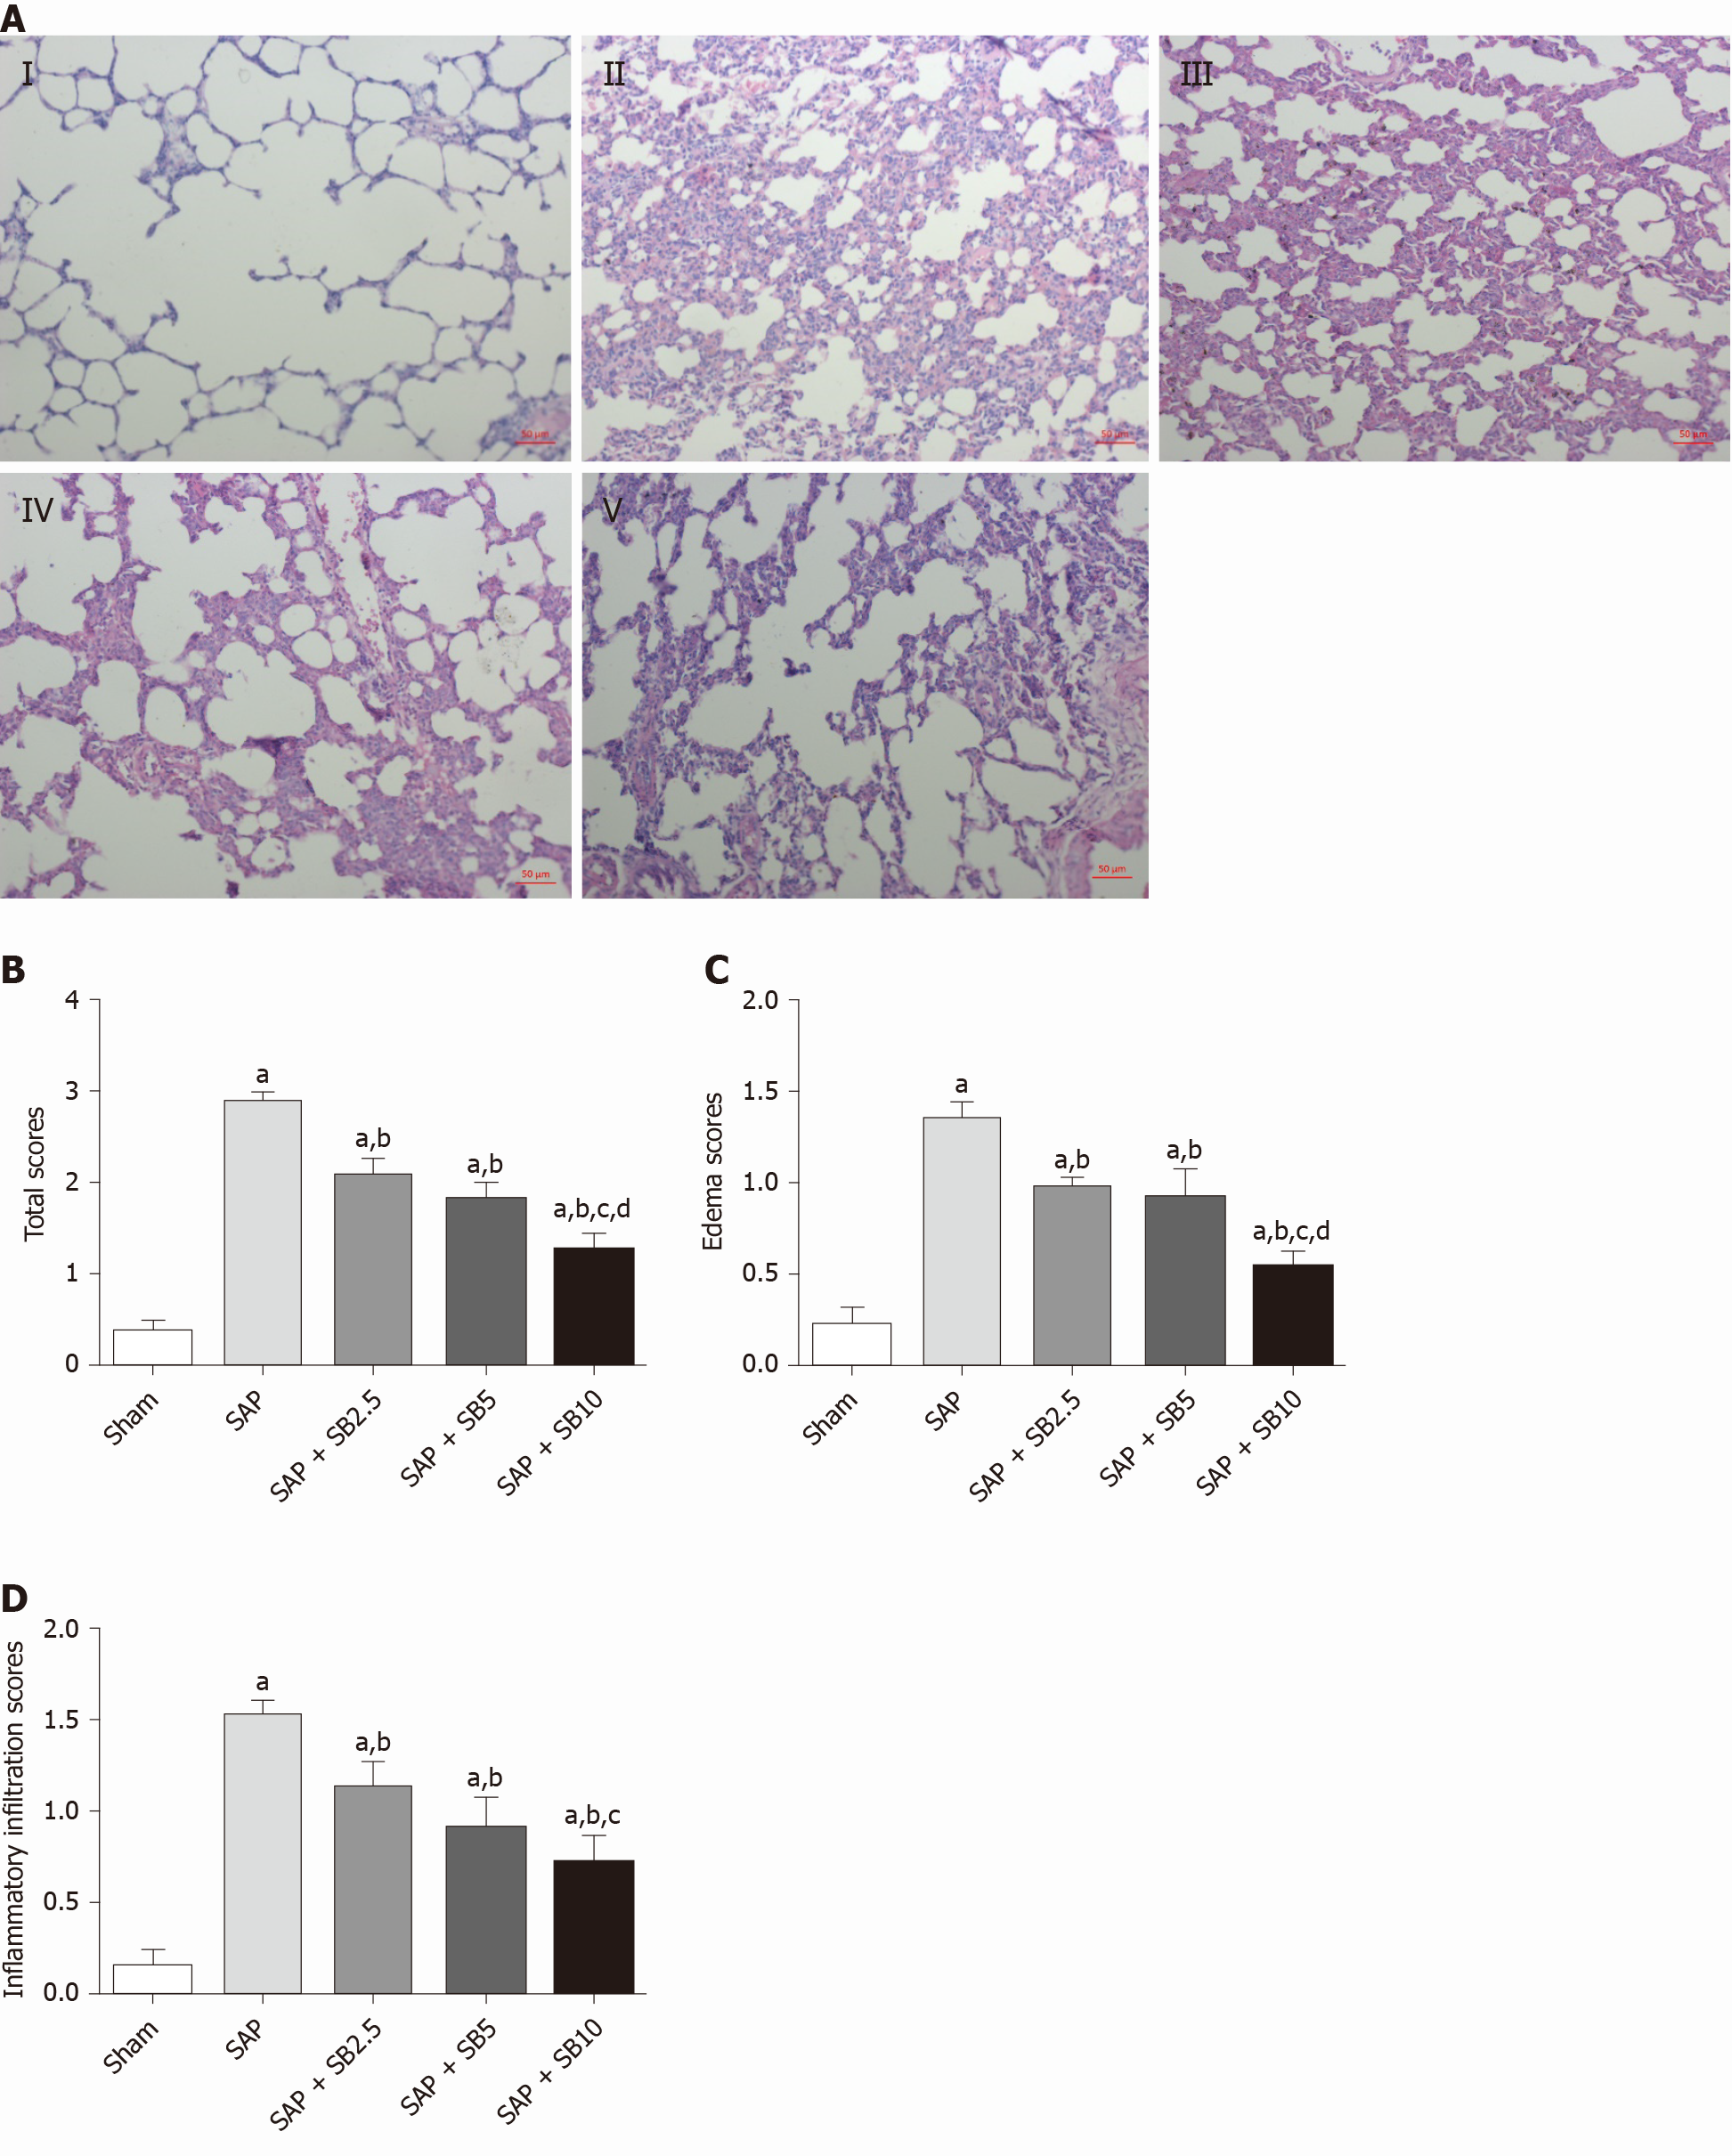
Figure 3 Effects of SB203580 on pulmonary histopathological changes and histopathological severity scores.
A: Representative hematoxylin and eosin images of pulmonary sections (magnification 200 ×); I: Sham group; II: Severe acute pancreatitis (SAP) group; III: SAP + SB2.5 group; IV: SAP + SB5 group; V: SAP + SB10 group; B: Total scores. C: Edema scores; D: Inflammatory infiltration scores. B-D: Pulmonary histopathology scores in different groups; Data are expressed as mean ± SE of the mean; aP < 0.05 vs sham group; bP < 0.05 vs SAP group; cP < 0.05 vs SAP + SB2.5 group; dP < 0.05 vs SAP + SB5 group. SAP: Severe acute pancreatitis.
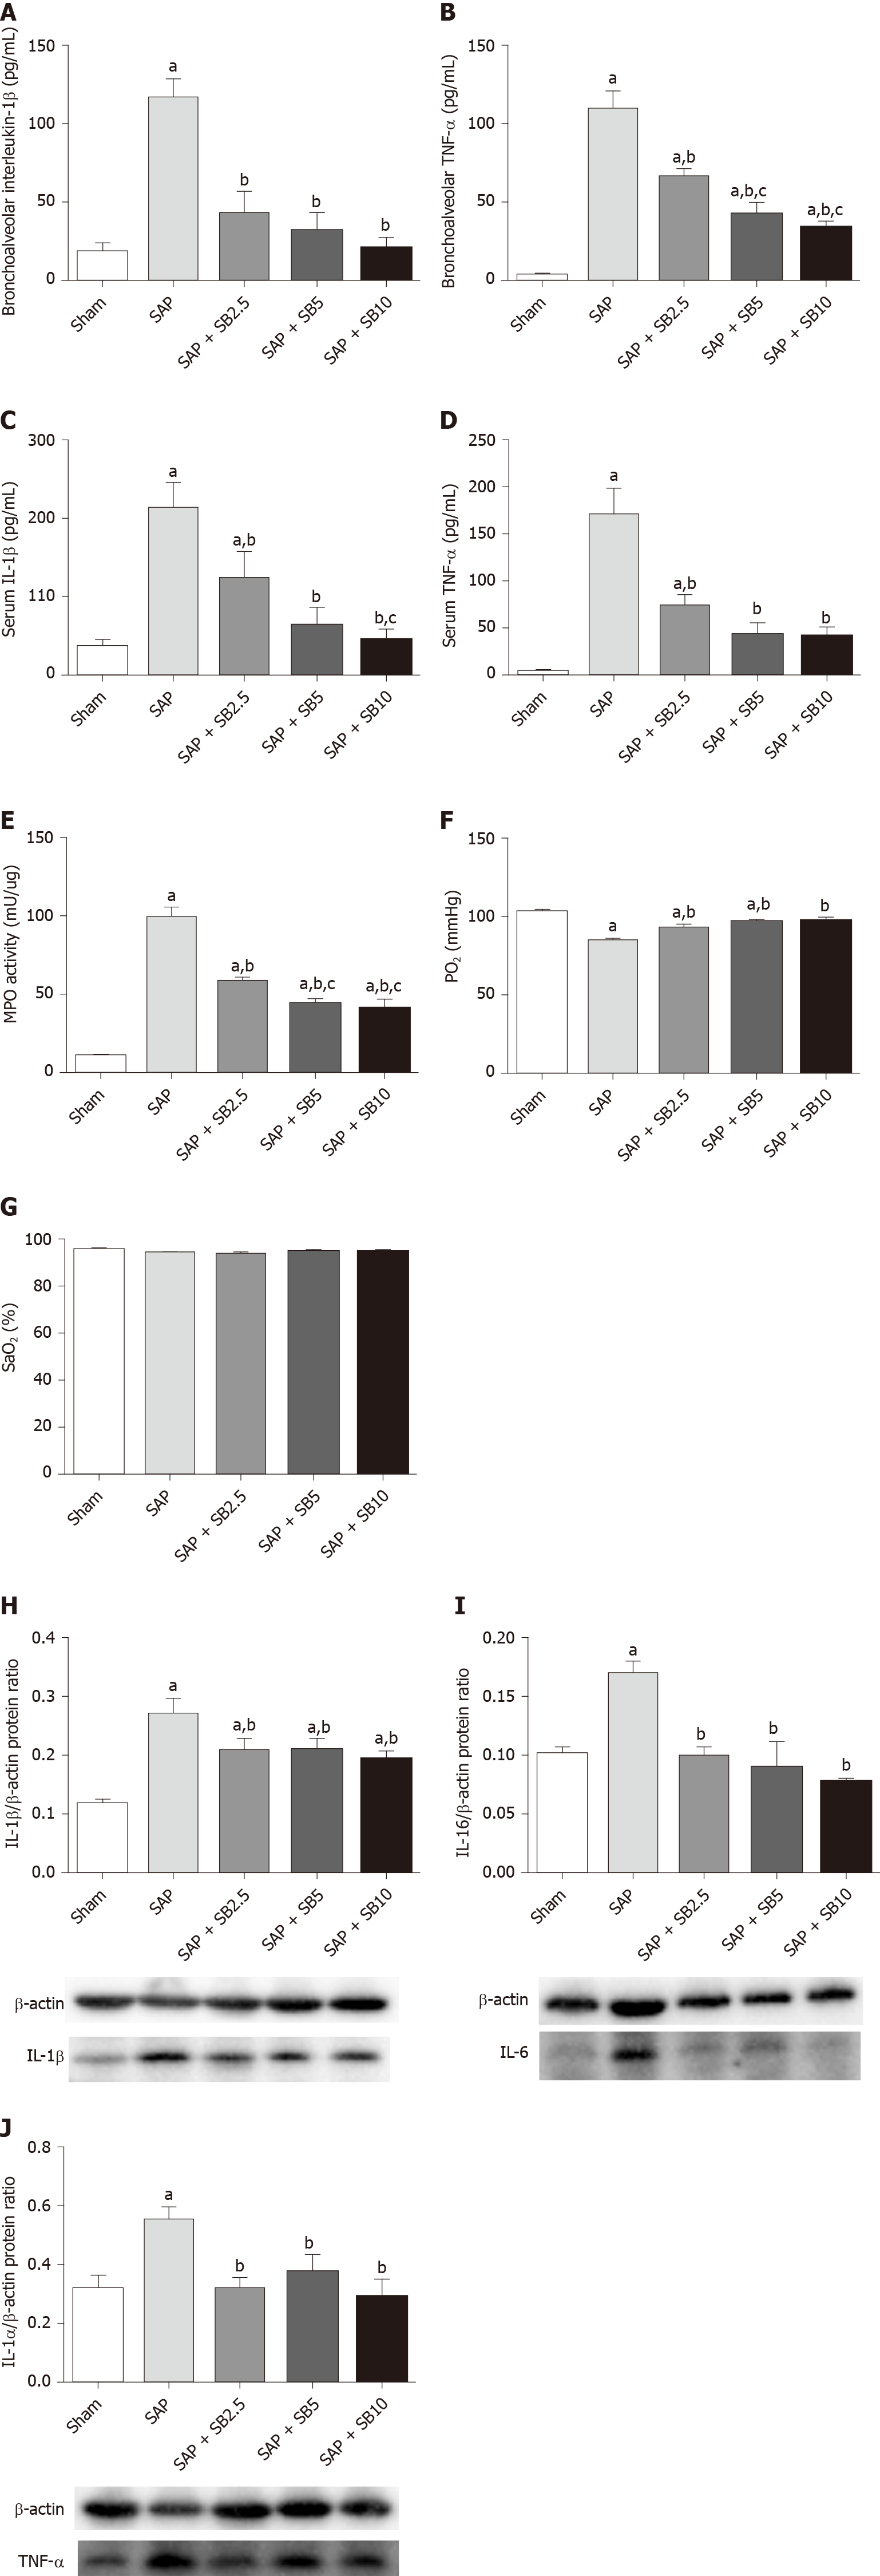
Figure 4 Effects of SB203580 on pulmonary severity indices of severe acute pancreatitis in rats.
A: Bronchoalveolar interleukin-1β (IL-1β); B: Bronchoalveolar tumor necrosis factor alpha (TNF-α); C: Serum IL-1β; D: Serum TNF-α; E: Lung myeloperoxidase activity; F: Partial pressure of oxygen; G: Oxygen saturation; H: Representative western blotting analysis results for IL-1β in lung tissues; I: Representative western blotting analysis results for IL-6 in lung tissues; J: Representative western blotting analysis results for TNF-α in lung tissues. Data are expressed as mean ± SE of the mean; aP < 0.05 vs sham group; bP < 0.05 vs severe acute pancreatitis group; cP < 0.05 vs severe acute pancreatitis + SB2.5 group. IL: Interleukin; MPO: Myeloperoxidase; PaO2: Pressure of oxygen; SaO2: Oxygen saturation; SAP: Severe acute pancreatitis; TNF-α: Tumor necrosis factor-alpha.
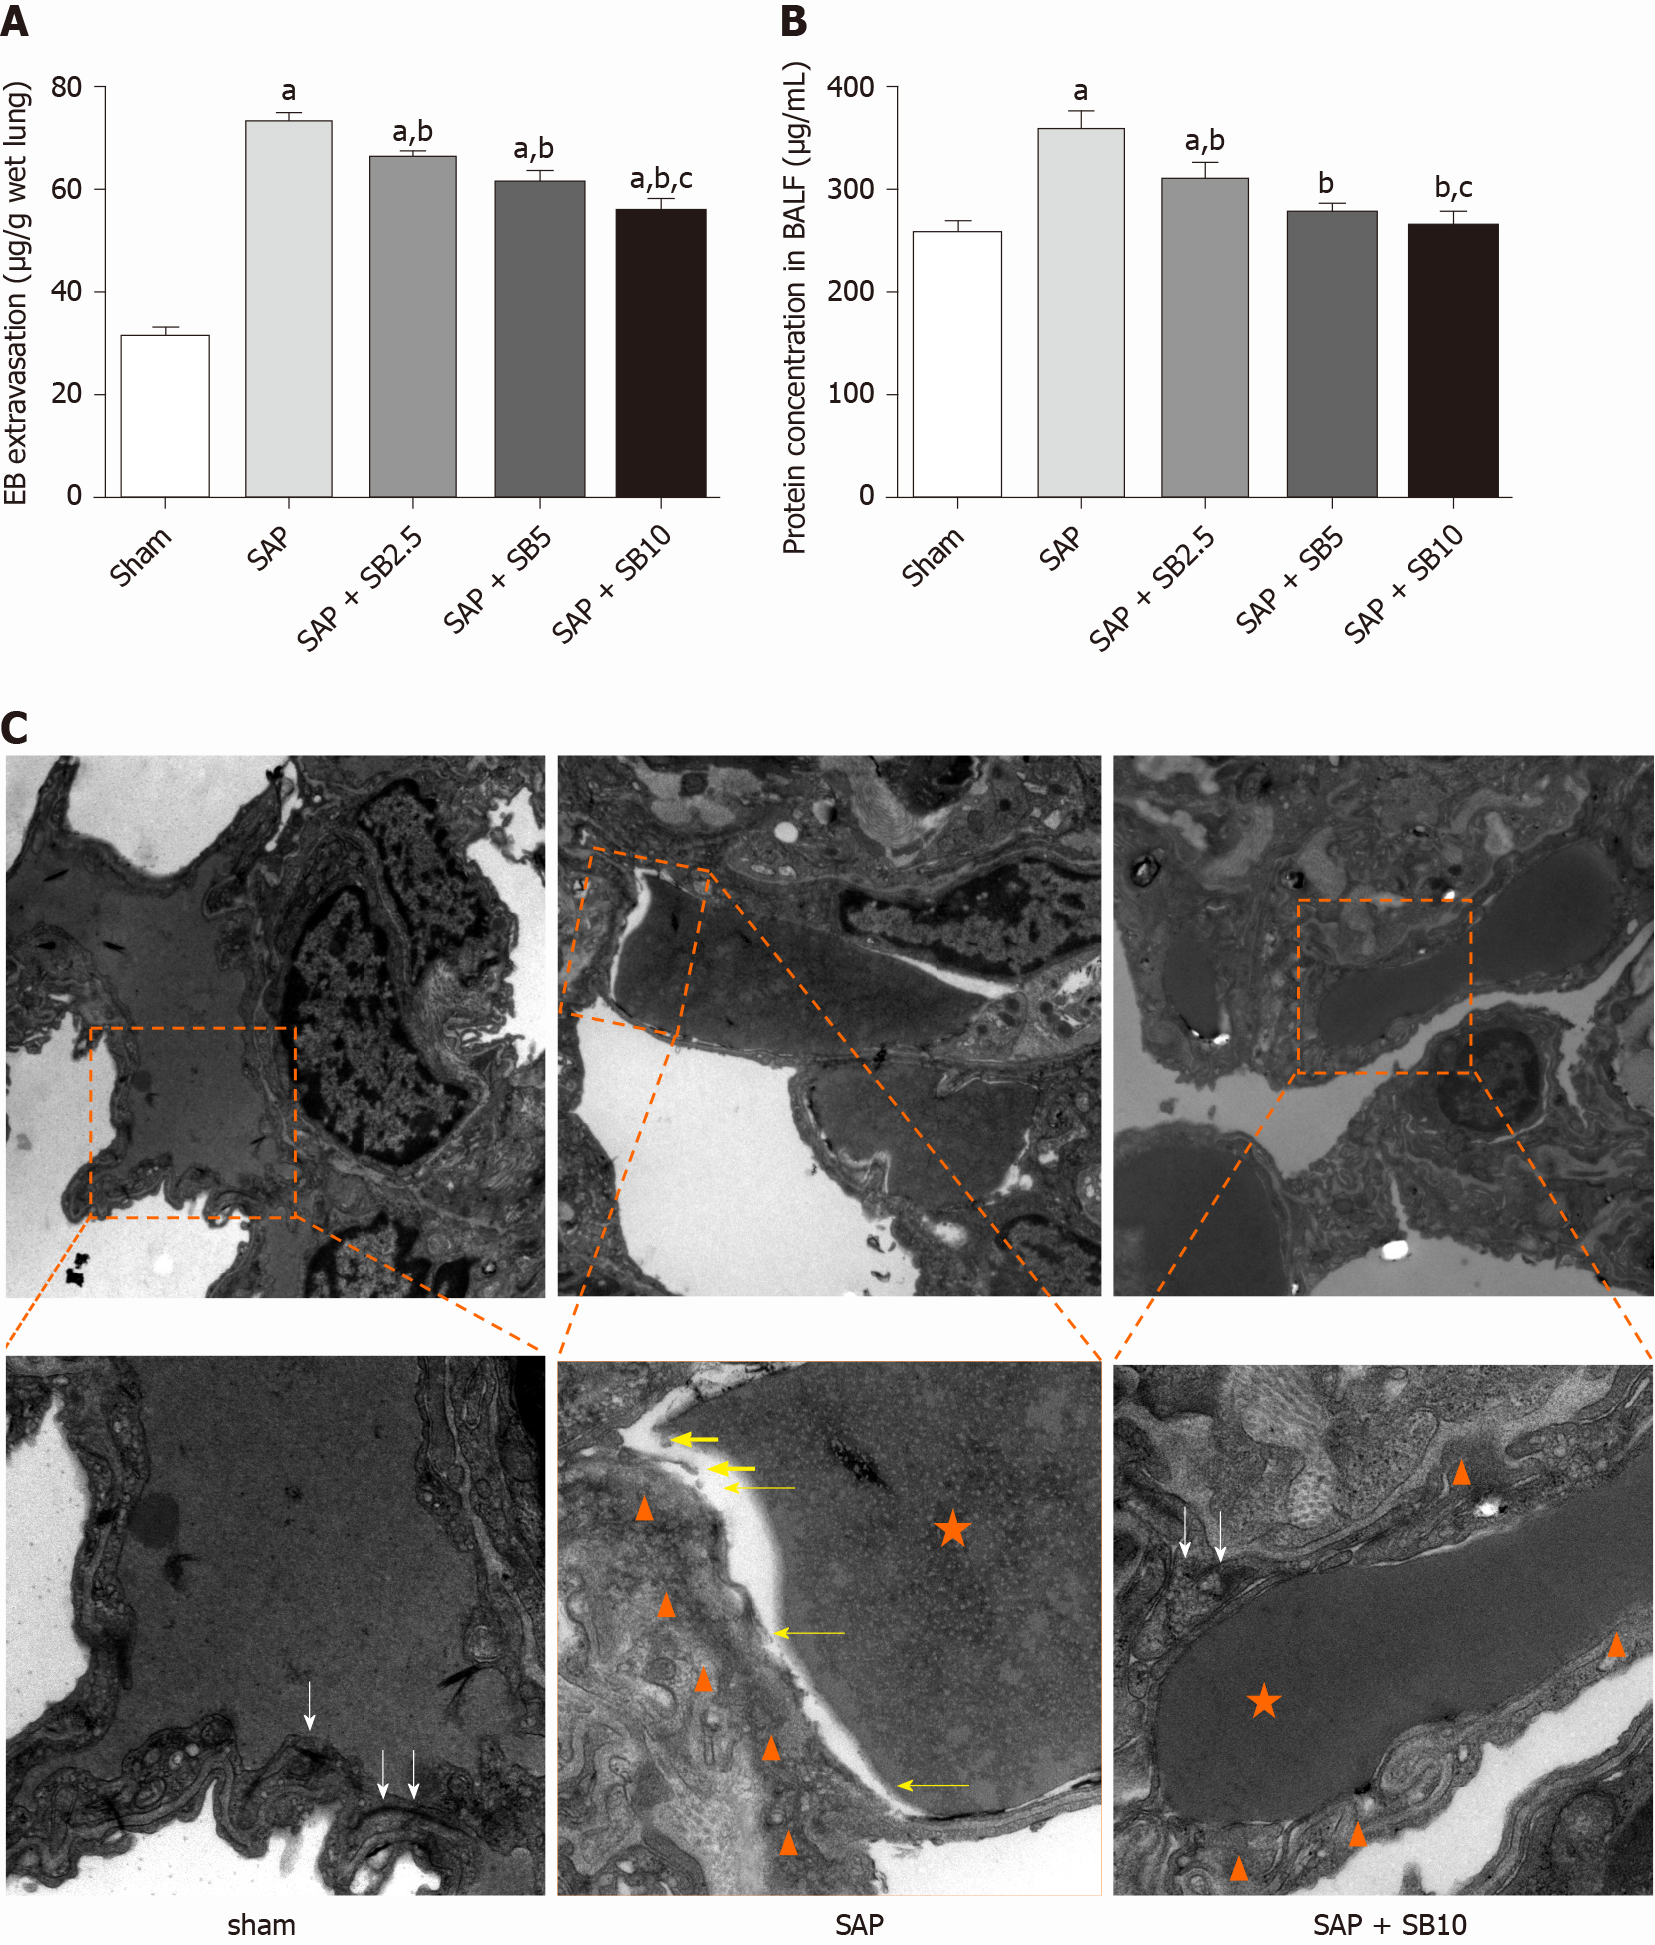
Figure 5 Effects of SB203580 on pulmonary capillary injury of severe acute pancreatitis rats.
A: Evans blue extravasation in lung tissues; B: Bronchoalveolar protein concentration; C: Representative electron microscope photomicrographs of pulmonary microvascular endothelial cells in lung tissues; Sham group: Magnification 1500 × and 4000 ×, respectively; Severe acute pancreatitis (SAP) group: Magnification 1500 × and 5000 ×, respectively; SAP + SB10 group: Magnification 1500 × and 5000 ×, respectively; White arrows: Dense endothelial cell–cell junctions; White arrowheads: Low electron density clouds with an irregular thickness indicating basal membrane edema; Yellow arrows: Dissolution, rupture and debris of capillary endothelial; Orange star: Red blood cell. Data were expressed as mean ± SE; aP < 0.05 vs sham group; bP < 0.05 vs SAP group; cP < 0.05 vs SAP + SB2.5 group. SAP: Severe acute pancreatitis.
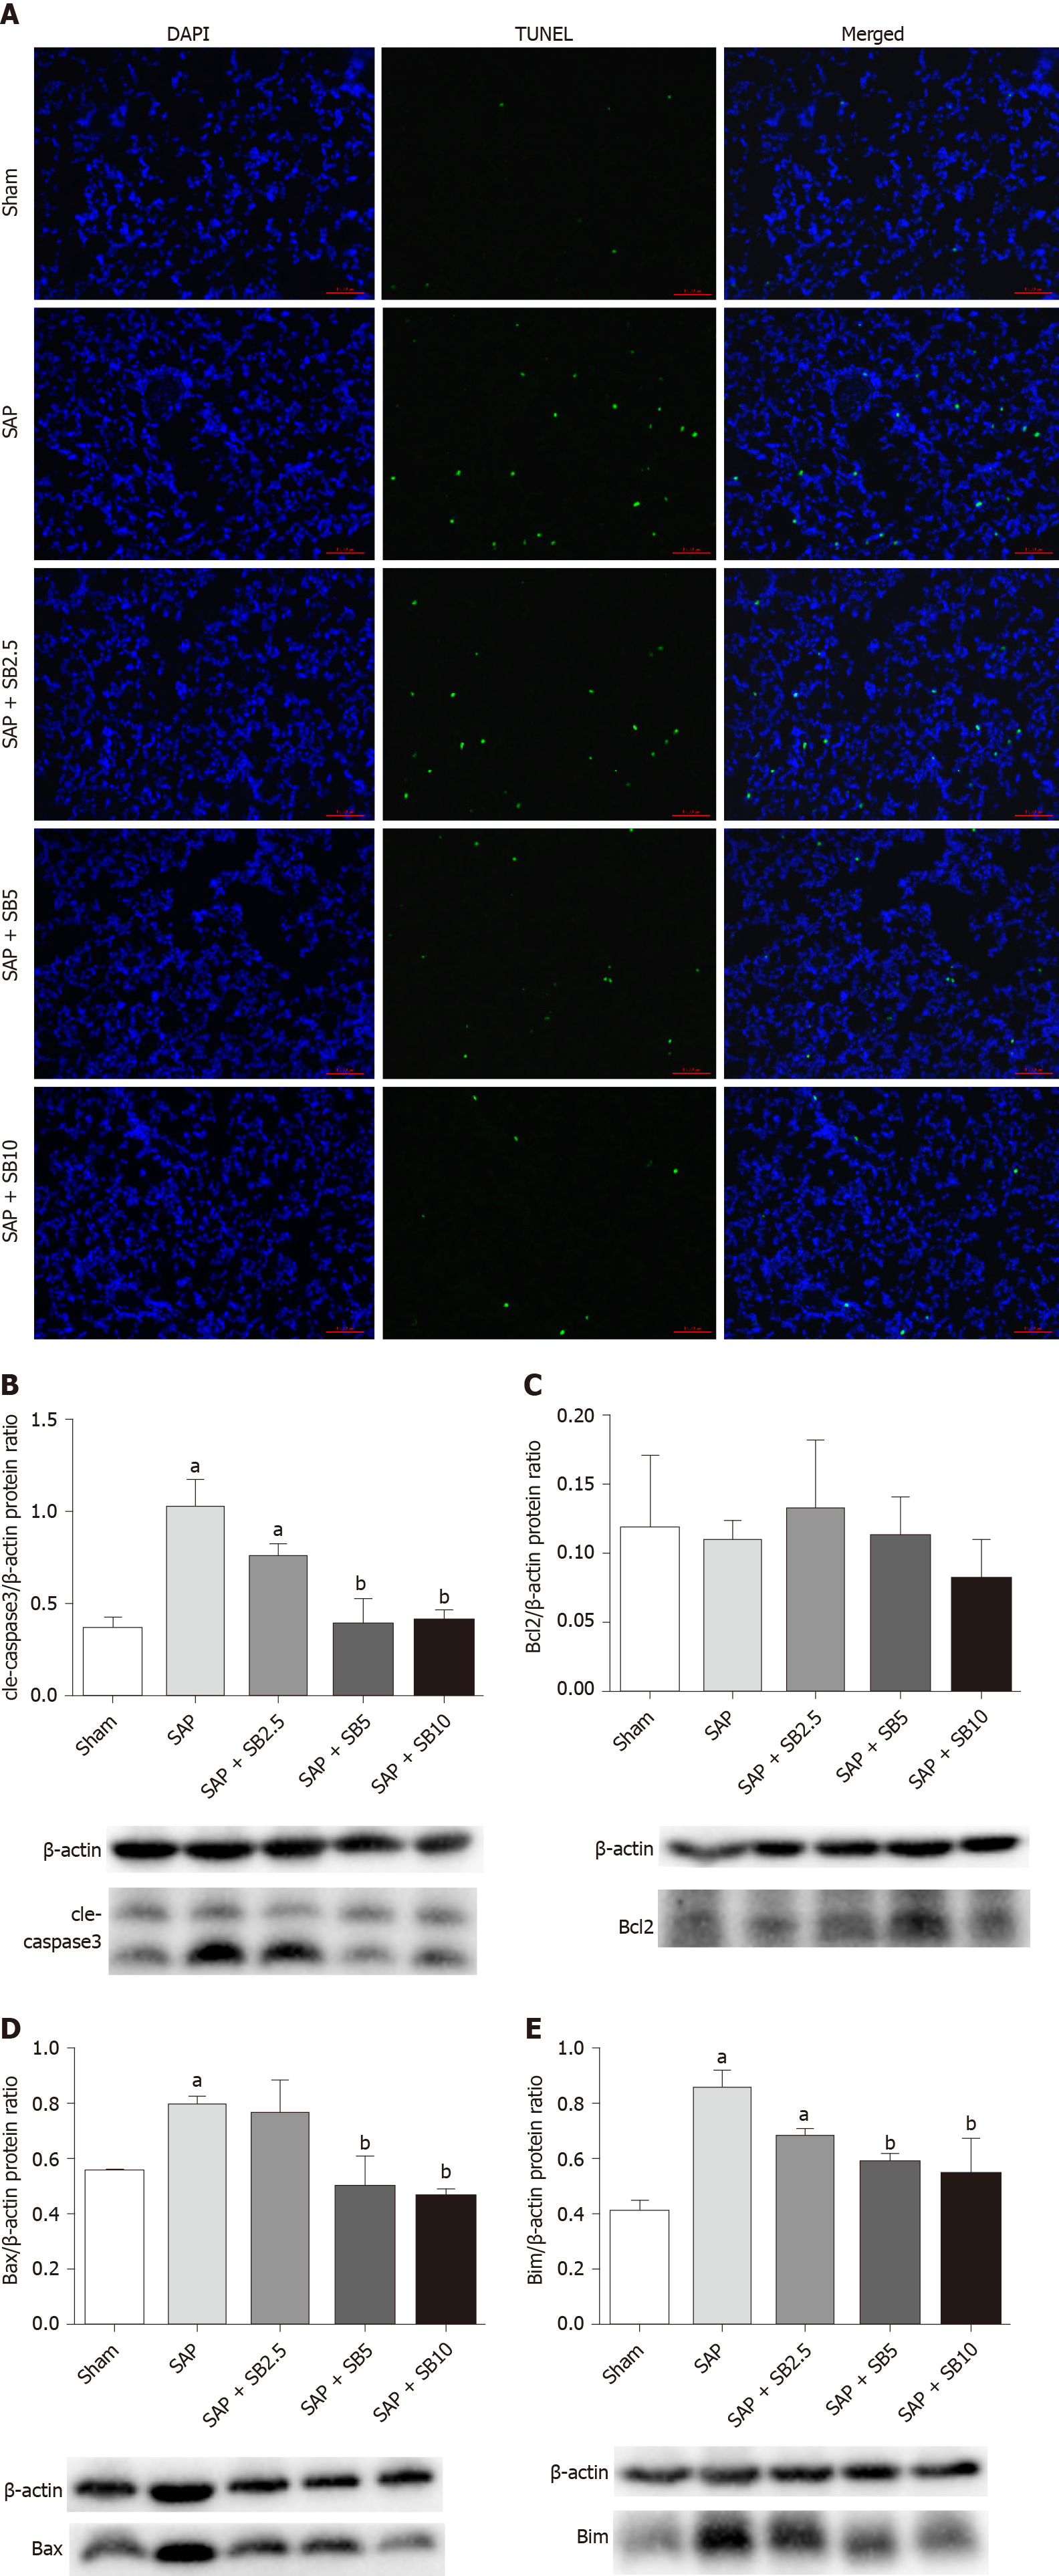
Figure 6 Effect of SB203580 on apoptosis of lung tissues in severe acute pancreatitis.
A: Representative terminal deoxynucleotidyl transferase-mediated dUTP nick end labeling images of pulmonary sections (200 ×); B: Cle-caspase3; C: Bcl2; D: Bax; E: Bim. B-E: Representative western blotting analysis results for apoptosis-related proteins in lung tissues; Data were expressed as mean ± SE; aP < 0.05 vs sham group; bP < 0.05 vs severe acute pancreatitis group. SAP: Severe acute pancreatitis.
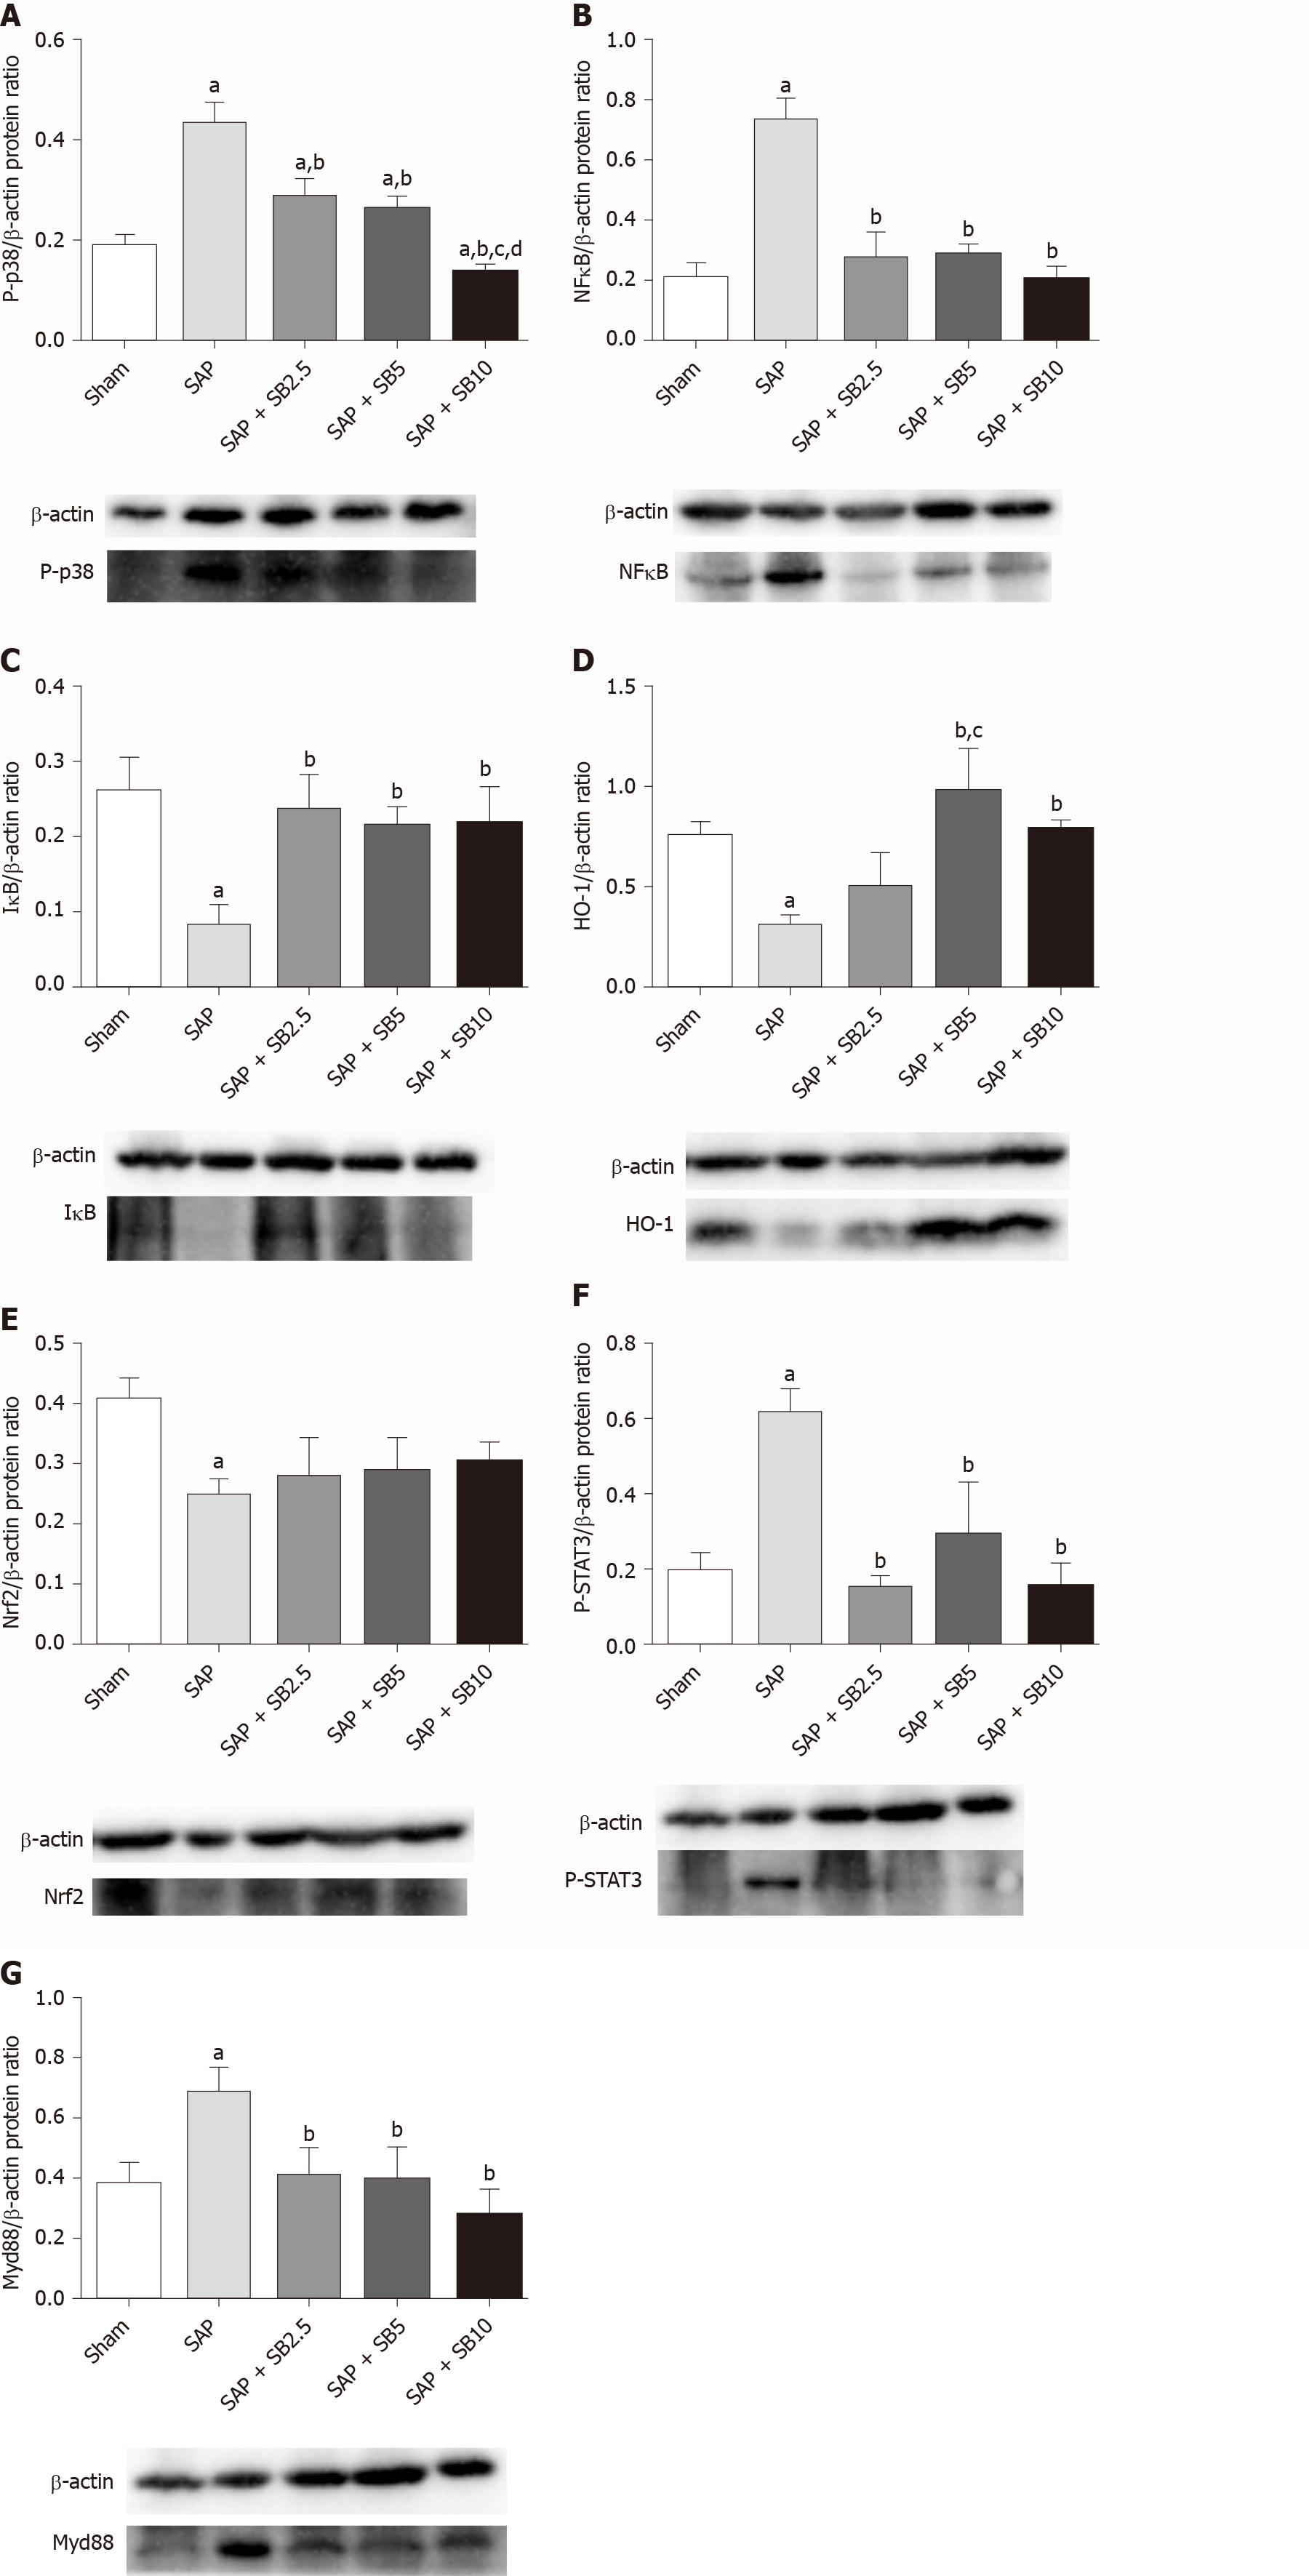
Figure 7 Effect of SB203580 on proinflammatory and proapoptotic signaling pathways.
Representative Western blotting analysis results for protein expression in pulmonary tissue; A: P-p38; B: NFκB; C: IκB; D: HO-1; E: Nrf2; F: P-STAT3; G: Myd88. Data are expressed as mean ± SE; aP < 0.05 vs sham group; bP < 0.05 vs severe acute pancreatitis group; cP < 0.05 vs severe acute pancreatitis + SB2.5 group; dP < 0.05 vs severe acute pancreatitis + SB5 group. Nrf2: Nuclear factor erythroid 2-related factor 2; STAT3: Signal transducer and activator of transcription-3.
- Citation: Zhang XX, Wang HY, Yang XF, Lin ZQ, Shi N, Chen CJ, Yao LB, Yang XM, Guo J, Xia Q, Xue P. Alleviation of acute pancreatitis-associated lung injury by inhibiting the p38 mitogen-activated protein kinase pathway in pulmonary microvascular endothelial cells. World J Gastroenterol 2021; 27(18): 2141-2159
- URL: https://www.wjgnet.com/1007-9327/full/v27/i18/2141.htm
- DOI: https://dx.doi.org/10.3748/wjg.v27.i18.2141


