Copyright
©The Author(s) 2021.
World J Gastroenterol. Mar 21, 2021; 27(11): 1101-1116
Published online Mar 21, 2021. doi: 10.3748/wjg.v27.i11.1101
Published online Mar 21, 2021. doi: 10.3748/wjg.v27.i11.1101
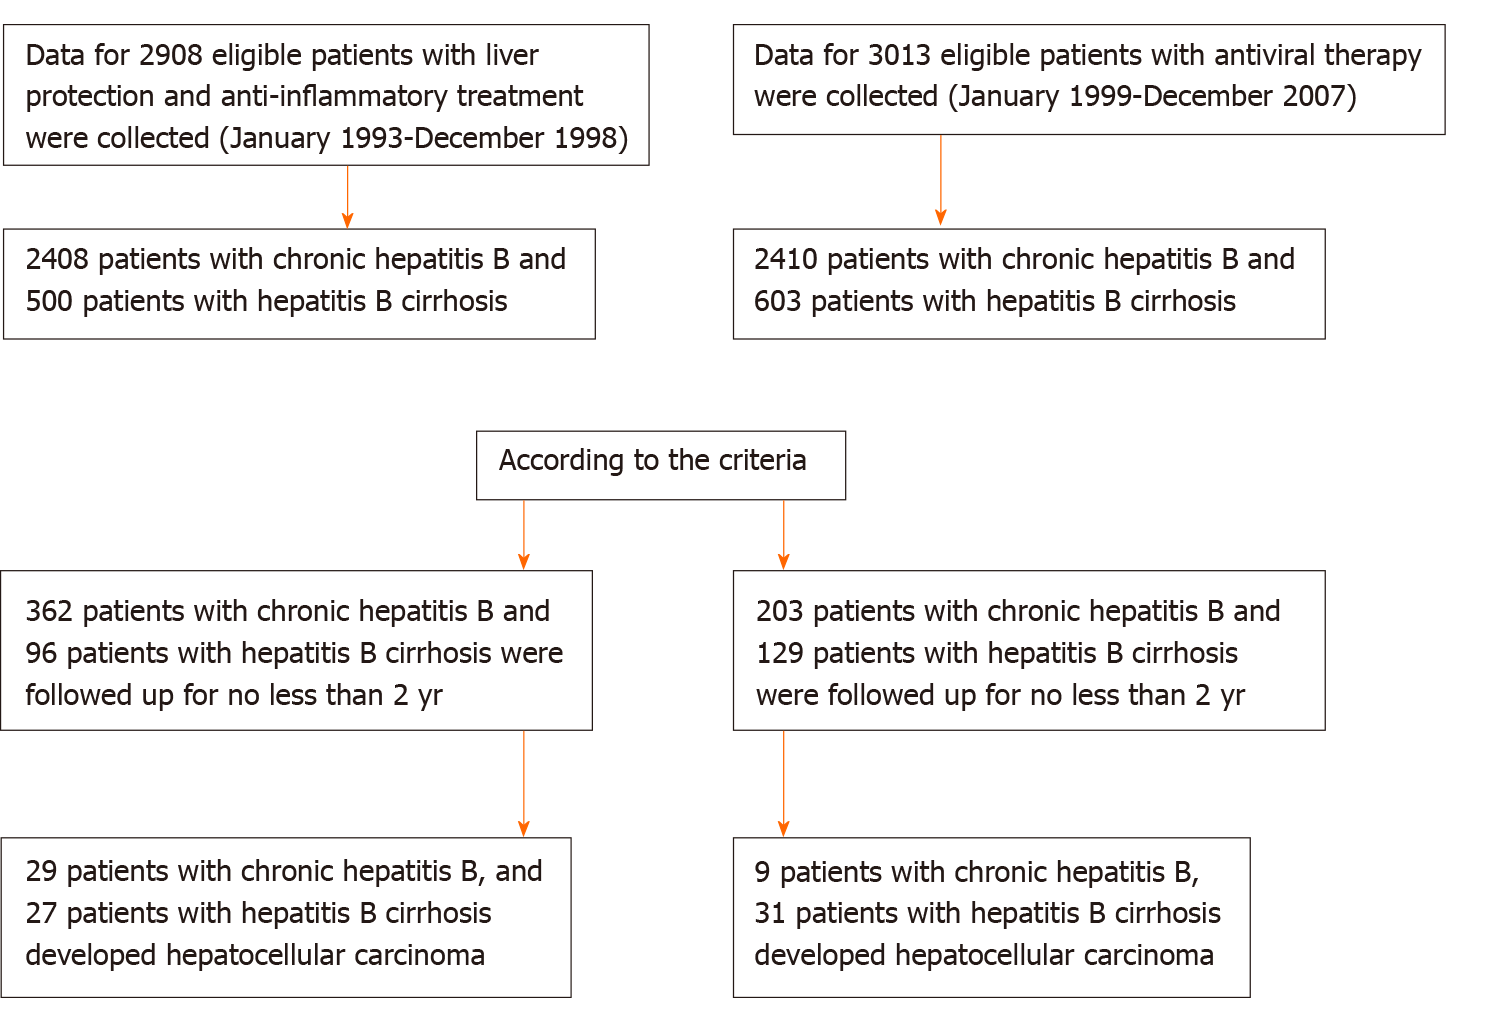
Figure 1 Flow chart of the control group.
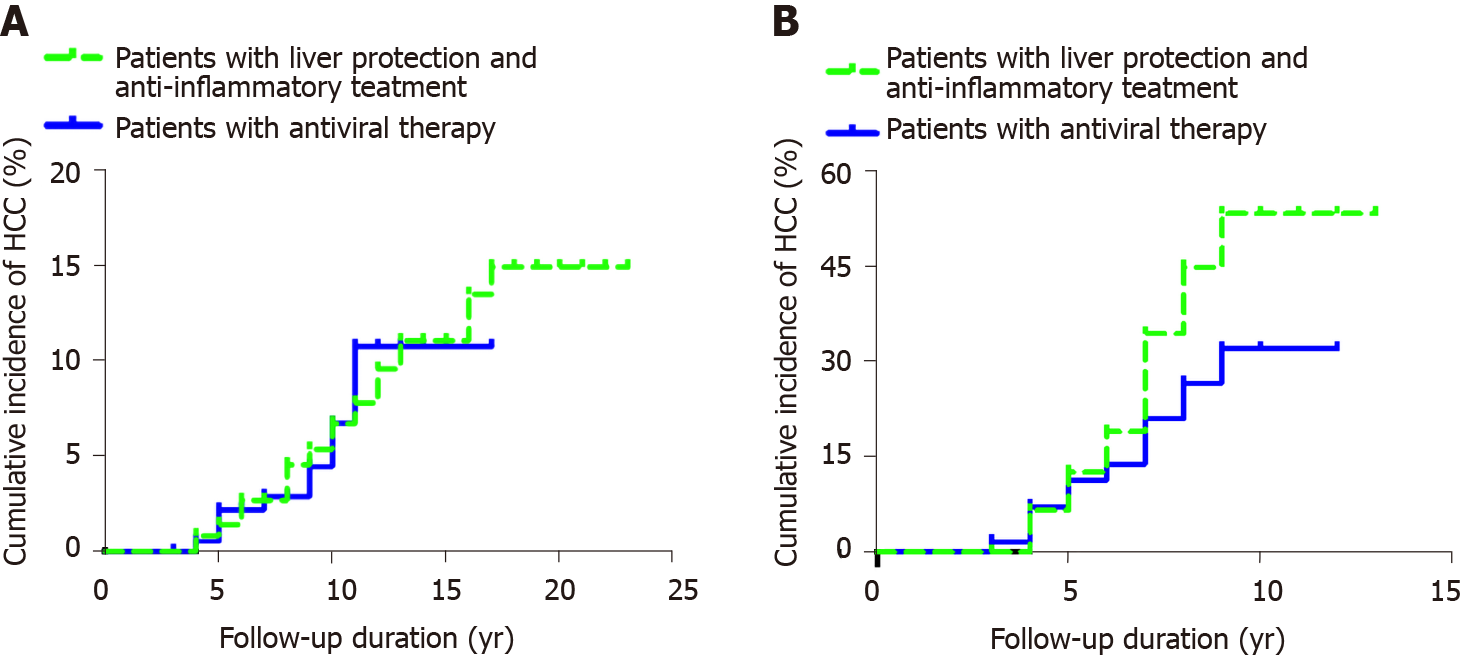
Figure 2 Cumulative incidence of hepatocellular carcinoma.
A: Comparison of the incidence of hepatocellular carcinoma over time in two groups of chronic hepatitis B patients (patients with liver protection and anti-inflammatory treatment and patients with antiviral therapy); B: Comparison of the incidence of hepatocellular carcinoma over time in patients with hepatitis B cirrhosis. HCC: Hepatocellular carcinoma.
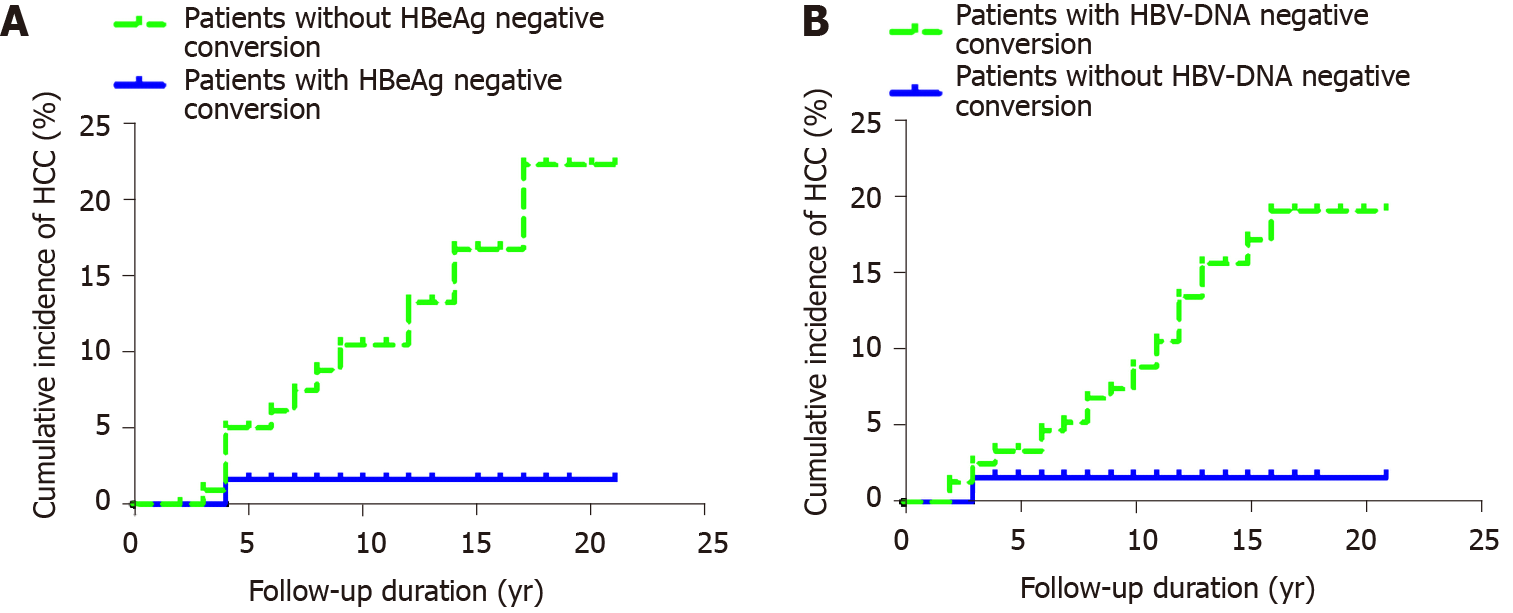
Figure 3 Cumulative incidence of hepatocellular carcinoma.
A: Incidence of hepatocellular carcinoma after hepatitis B e antigen negative conversion in hepatitis B e antigen-positive chronic hepatitis B patients; B: Cumulative incidence of hepatocellular carcinoma after hepatitis B virus-DNA negative conversion in patients with chronic hepatitis B. HCC: Hepatocellular carcinoma; HBeAg: Hepatitis B e antigen; HBV: Hepatitis B virus.
Figure 4 Cumulative incidence of hepatocellular carcinoma.
A: Cumulative incidence of hepatocellular carcinoma in patients with antiviral resistance in chronic hepatitis B; B: Cumulative incidence of hepatocellular carcinoma in patients with antiviral resistance in hepatitis B cirrhosis. HCC: Hepatocellular carcinoma.
- Citation: Jiang XY, Huang B, Huang DP, Wei CS, Zhong WC, Peng DT, Huang FR, Tong GD. Long-term follow-up of cumulative incidence of hepatocellular carcinoma in hepatitis B virus patients without antiviral therapy. World J Gastroenterol 2021; 27(11): 1101-1116
- URL: https://www.wjgnet.com/1007-9327/full/v27/i11/1101.htm
- DOI: https://dx.doi.org/10.3748/wjg.v27.i11.1101


