Copyright
©The Author(s) 2020.
World J Gastroenterol. Feb 28, 2020; 26(8): 850-864
Published online Feb 28, 2020. doi: 10.3748/wjg.v26.i8.850
Published online Feb 28, 2020. doi: 10.3748/wjg.v26.i8.850
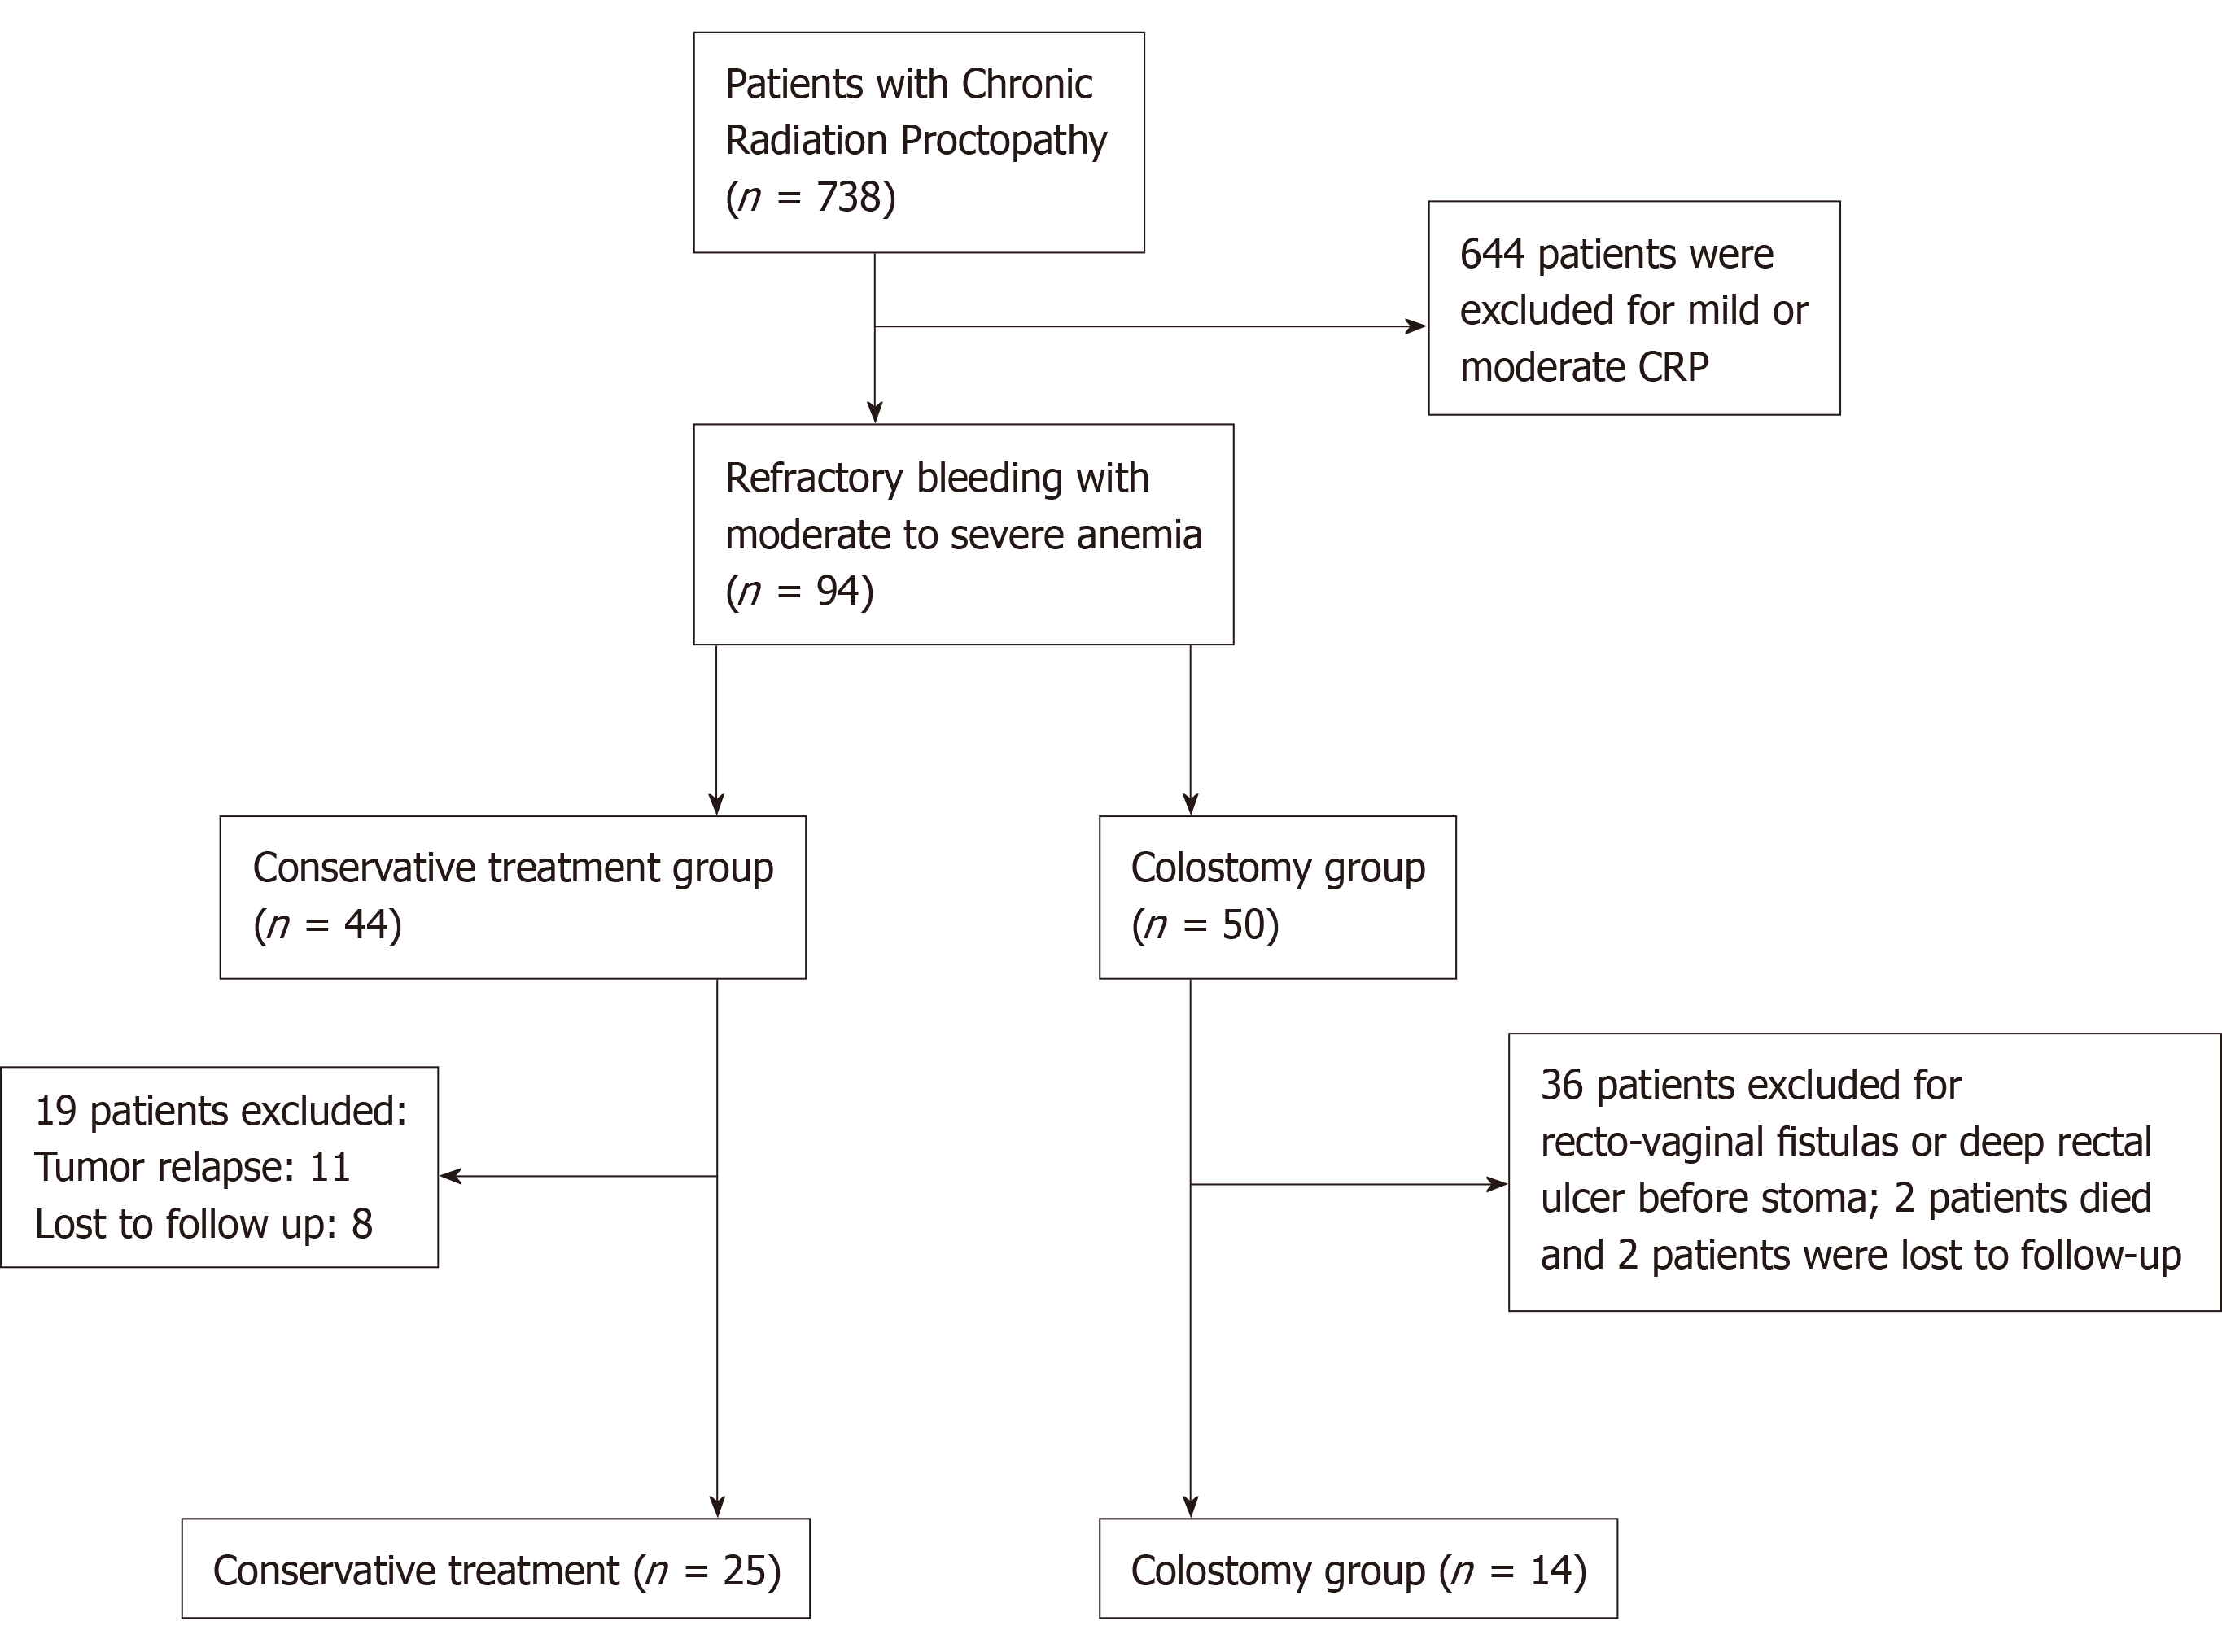
Figure 1 Flow chart of patient selection.
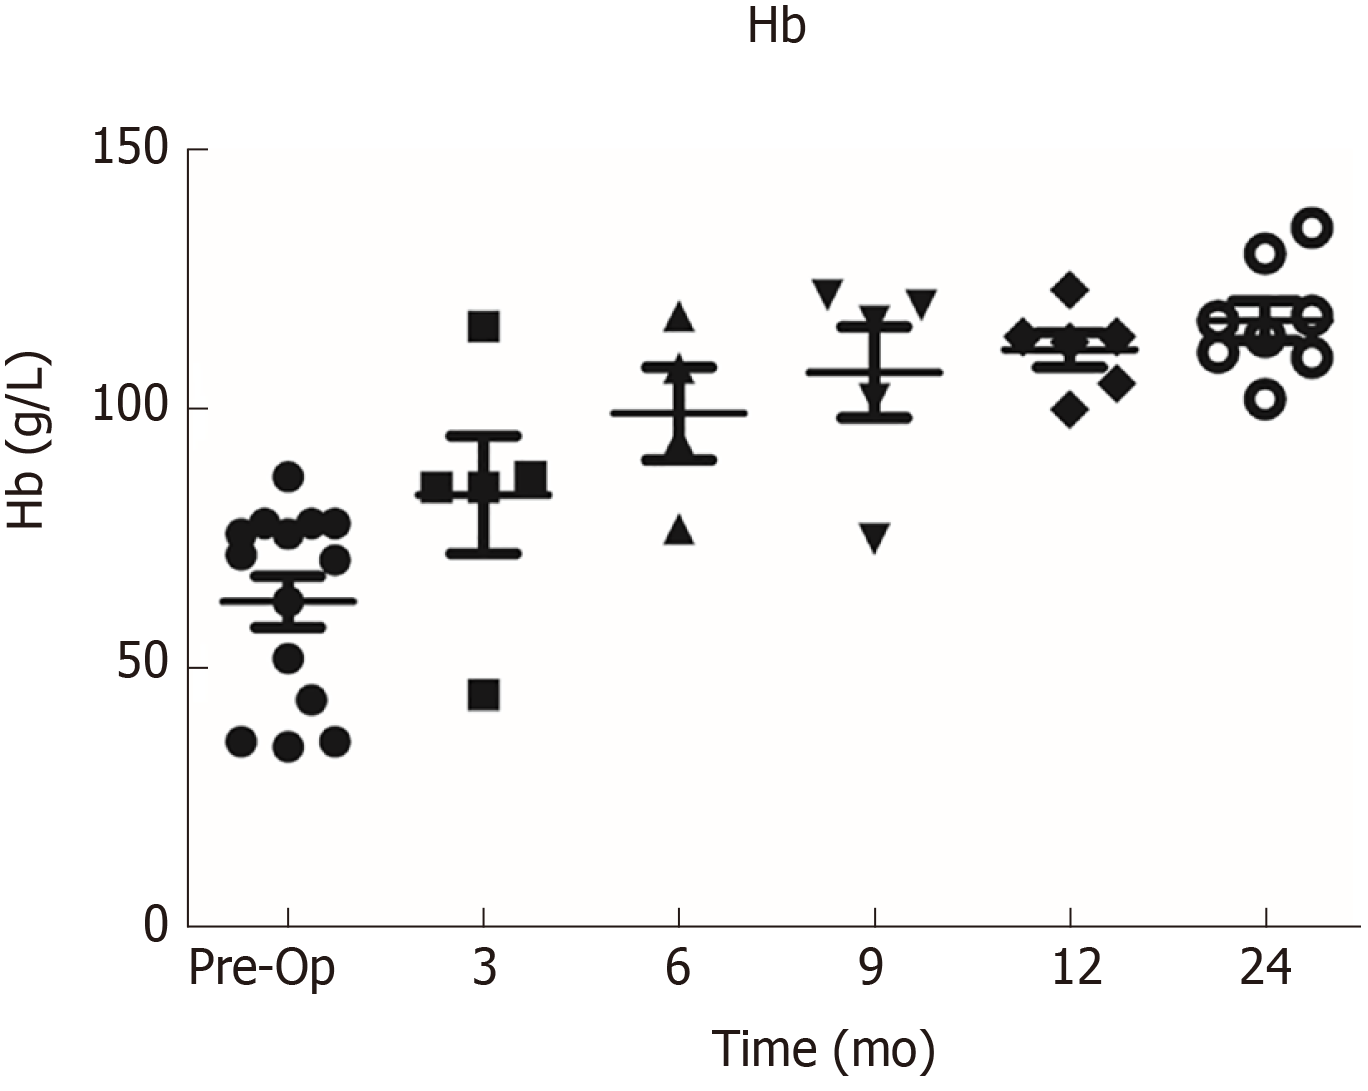
Figure 2 Dynamic changes in hemoglobin levels.
Pre-Op: Pre-operative.
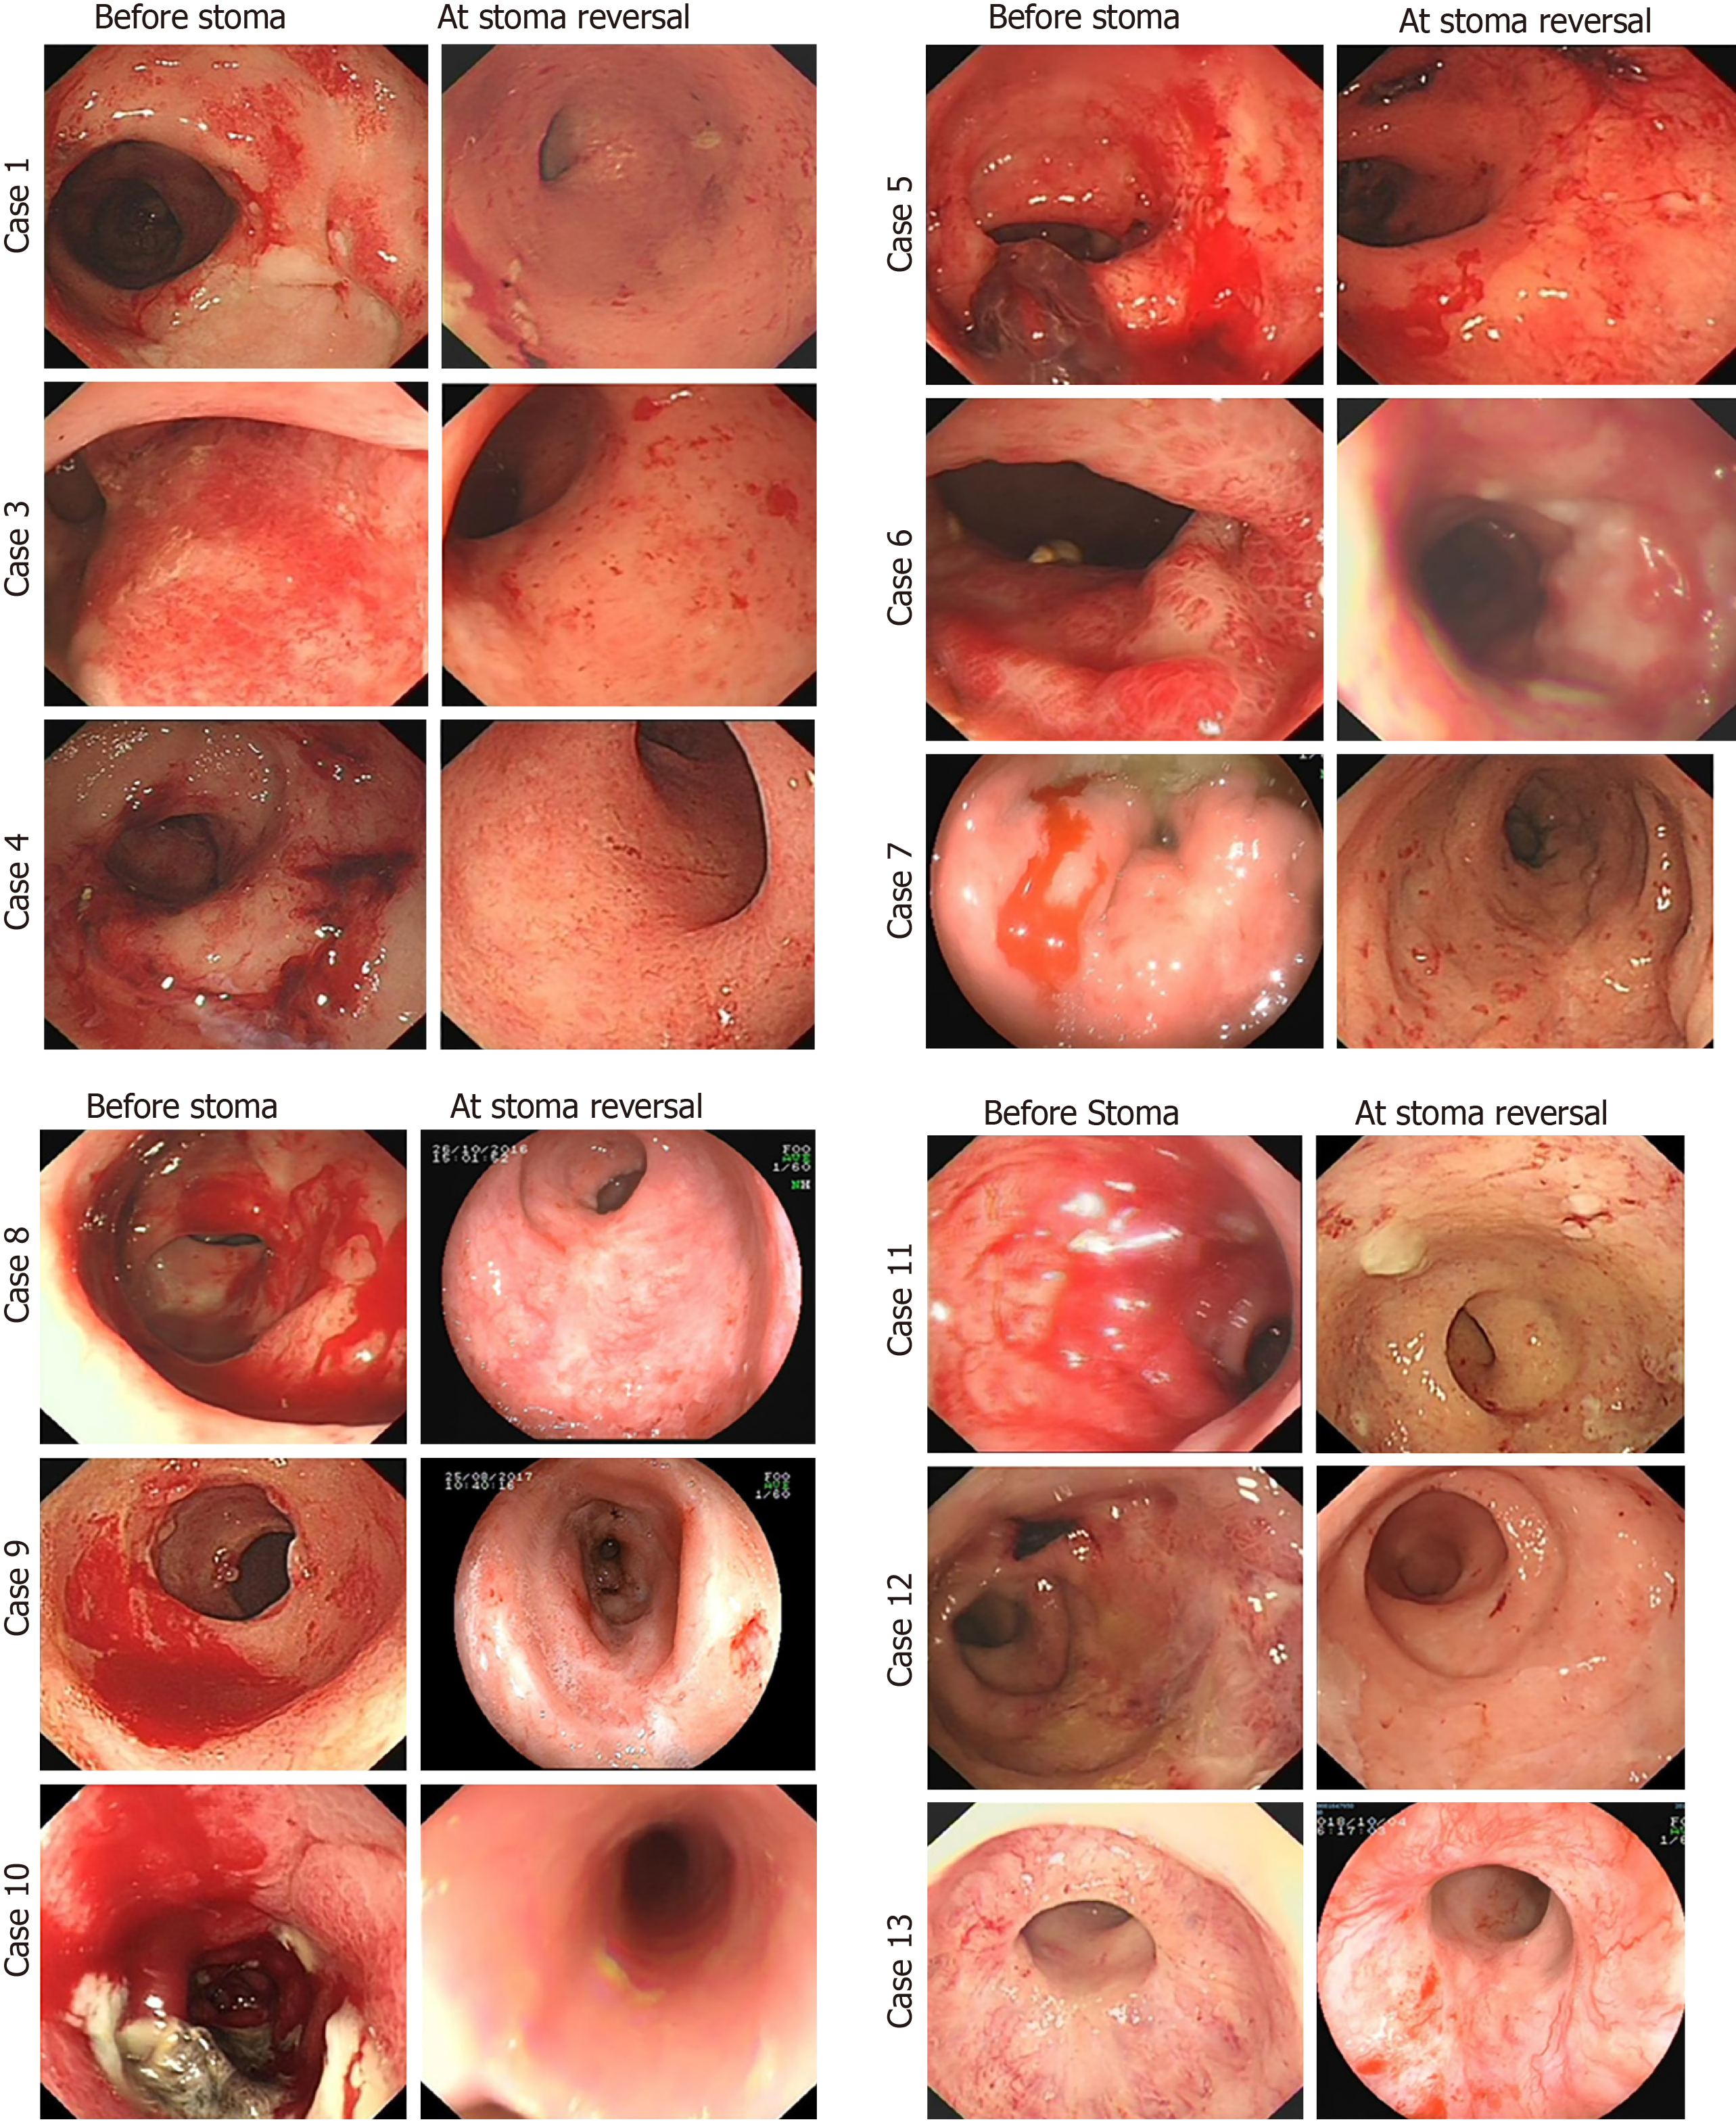
Figure 3 Endoscopic changes before stoma and at reversal.
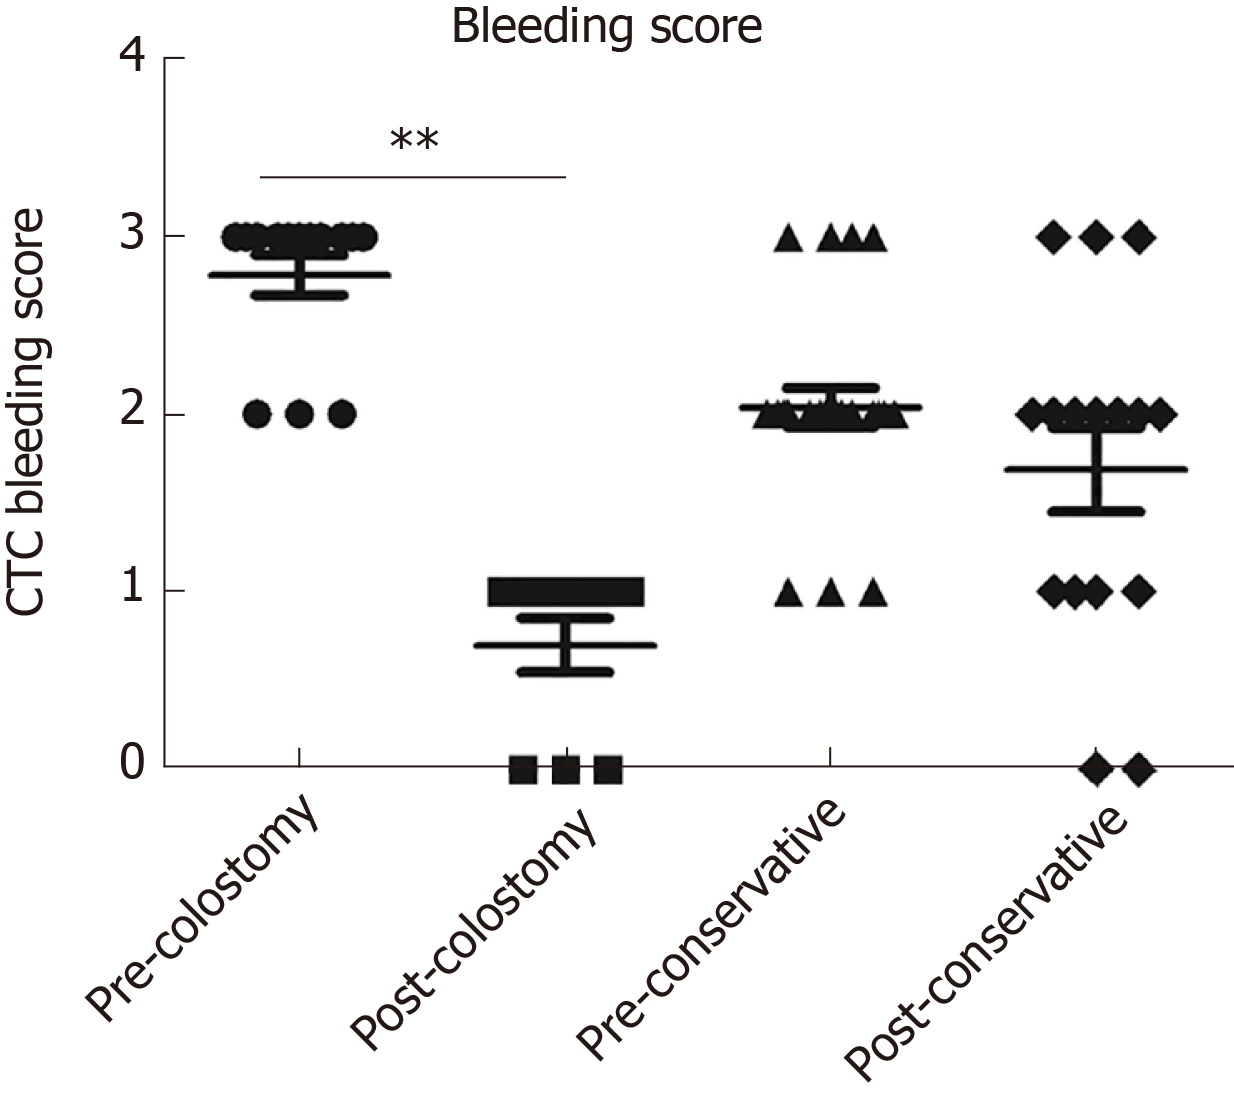
Figure 4 CTC bleeding scores before stoma and at stoma reversal.
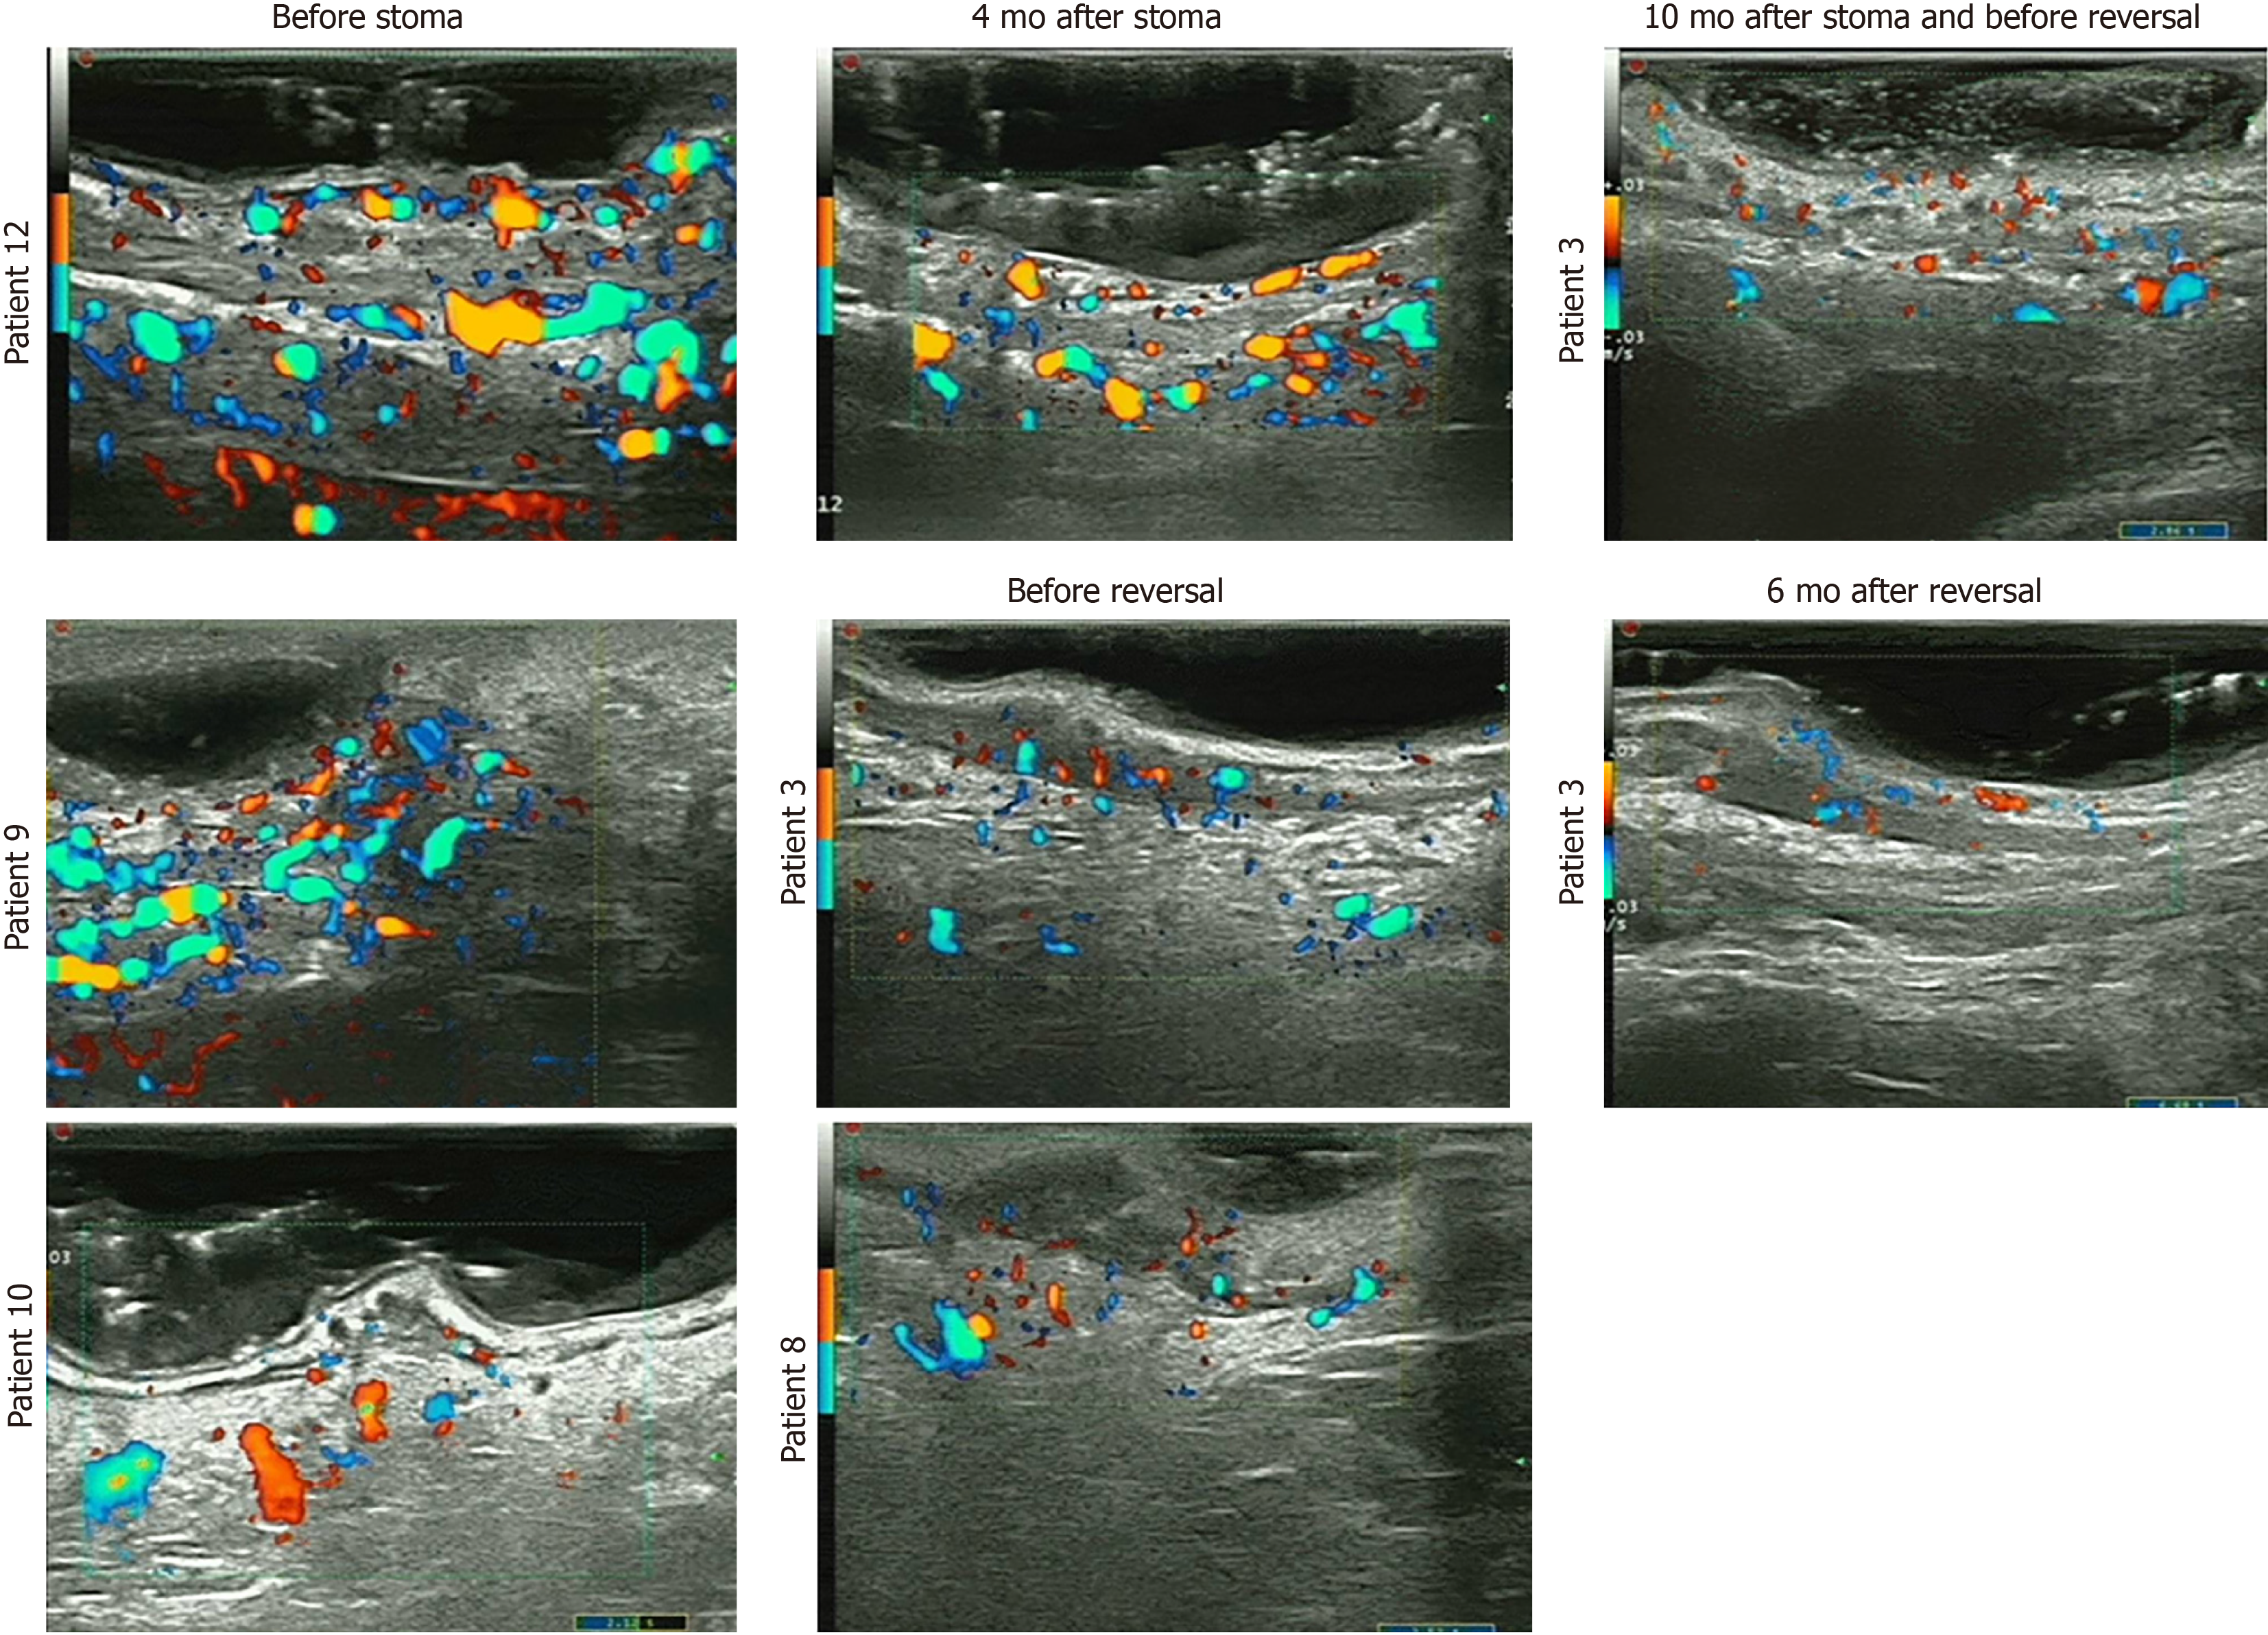
Figure 5 Endoscopic ultrasound features before stoma and at stoma reversal.
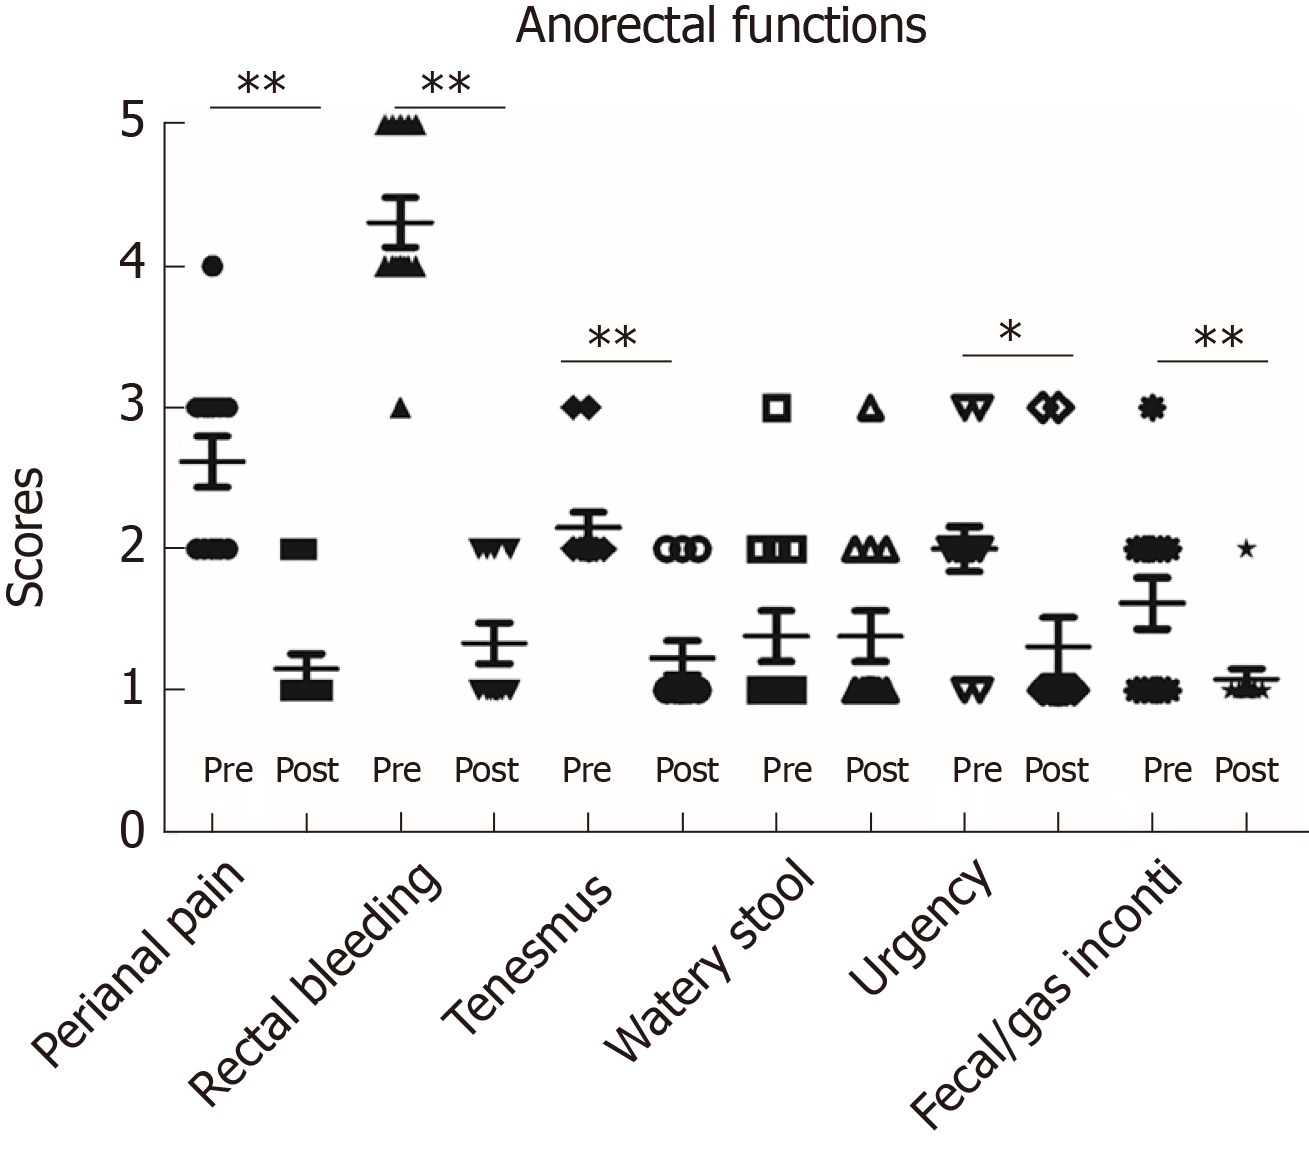
Figure 6 Anorectal functions before stoma and after stoma reversal.
- Citation: Yuan ZX, Qin QY, Zhu MM, Zhong QH, Fichera A, Wang H, Wang HM, Huang XY, Cao WT, Zhao YB, Wang L, Ma TH. Diverting colostomy is an effective and reversible option for severe hemorrhagic radiation proctopathy. World J Gastroenterol 2020; 26(8): 850-864
- URL: https://www.wjgnet.com/1007-9327/full/v26/i8/850.htm
- DOI: https://dx.doi.org/10.3748/wjg.v26.i8.850


