Copyright
©The Author(s) 2020.
World J Gastroenterol. Dec 21, 2020; 26(47): 7538-7549
Published online Dec 21, 2020. doi: 10.3748/wjg.v26.i47.7538
Published online Dec 21, 2020. doi: 10.3748/wjg.v26.i47.7538
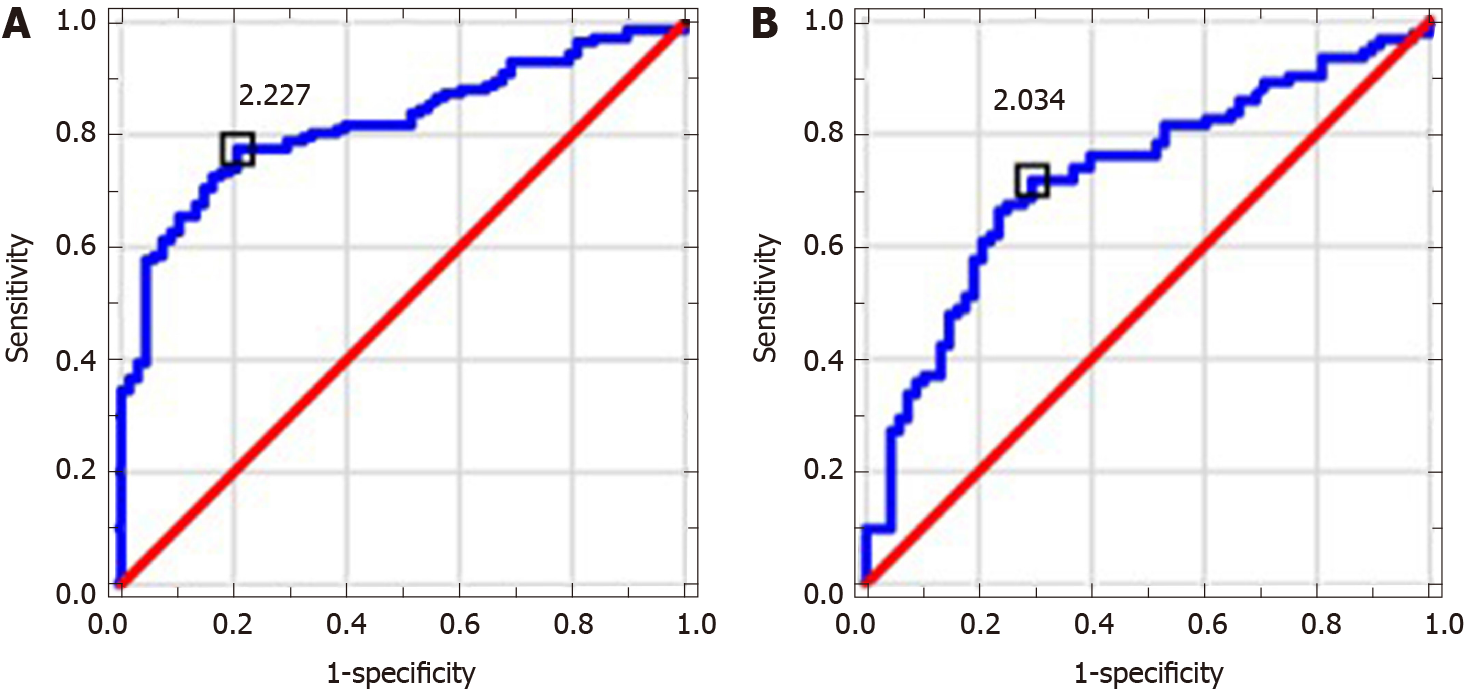
Figure 1 Receiver operating characteristics for neutrophil-to-lymphocyte ratio in alcoholic liver cirrhosis and nonalcoholic fatty liver disease groups.
Area under the curve value (AUC) = 0.821 (cut-off > 2.227) and AUC = 0.725 (cut-off > 2.034), respectively. A: Alcoholic liver cirrhosis; B: Nonalcoholic fatty liver disease.
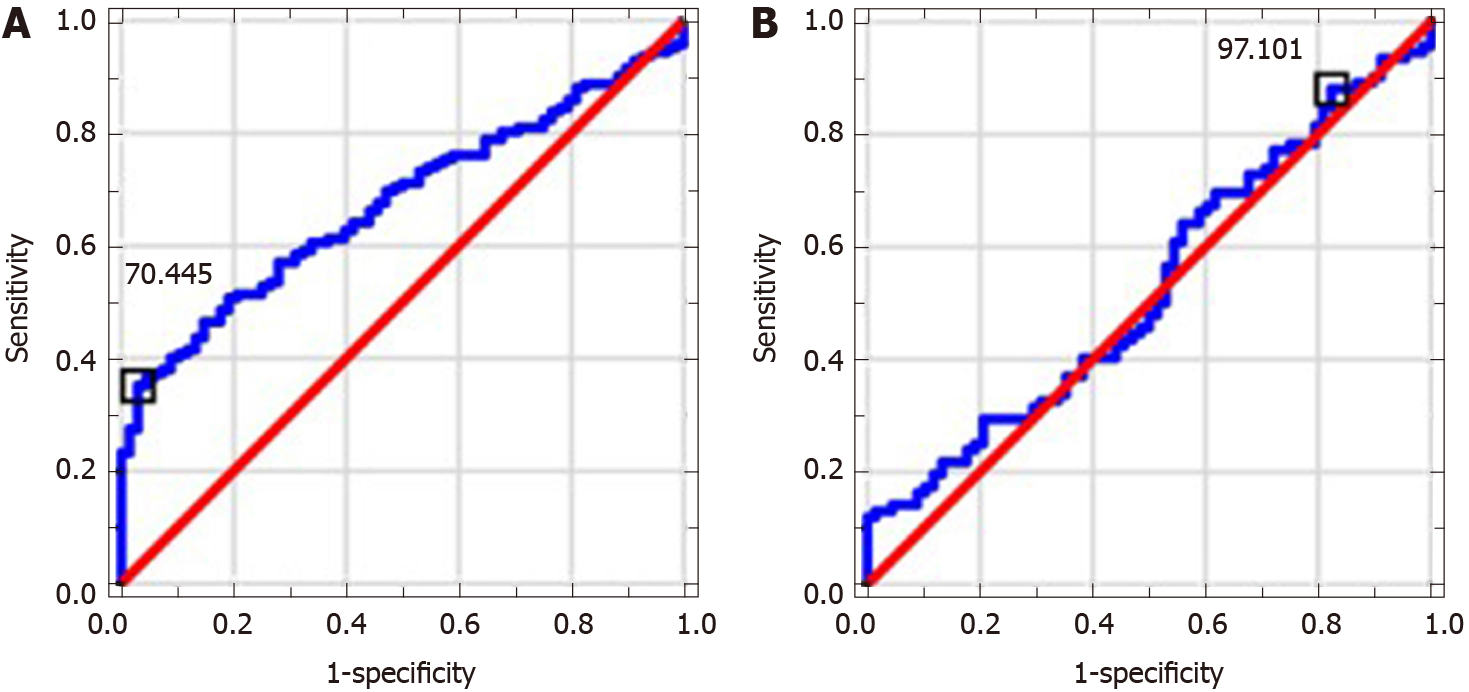
Figure 2 Receiver operating characteristics for platelet-to-lymphocyte ratio in alcoholic liver cirrhosis and nonalcoholic fatty liver disease groups.
Area under the curve value (AUC) = 0.675 (cut off < 70.445) and AUC = 0.528 (cut-off < 97.101), respectively. A: Alcoholic liver cirrhosis; B: Nonalcoholic fatty liver disease.
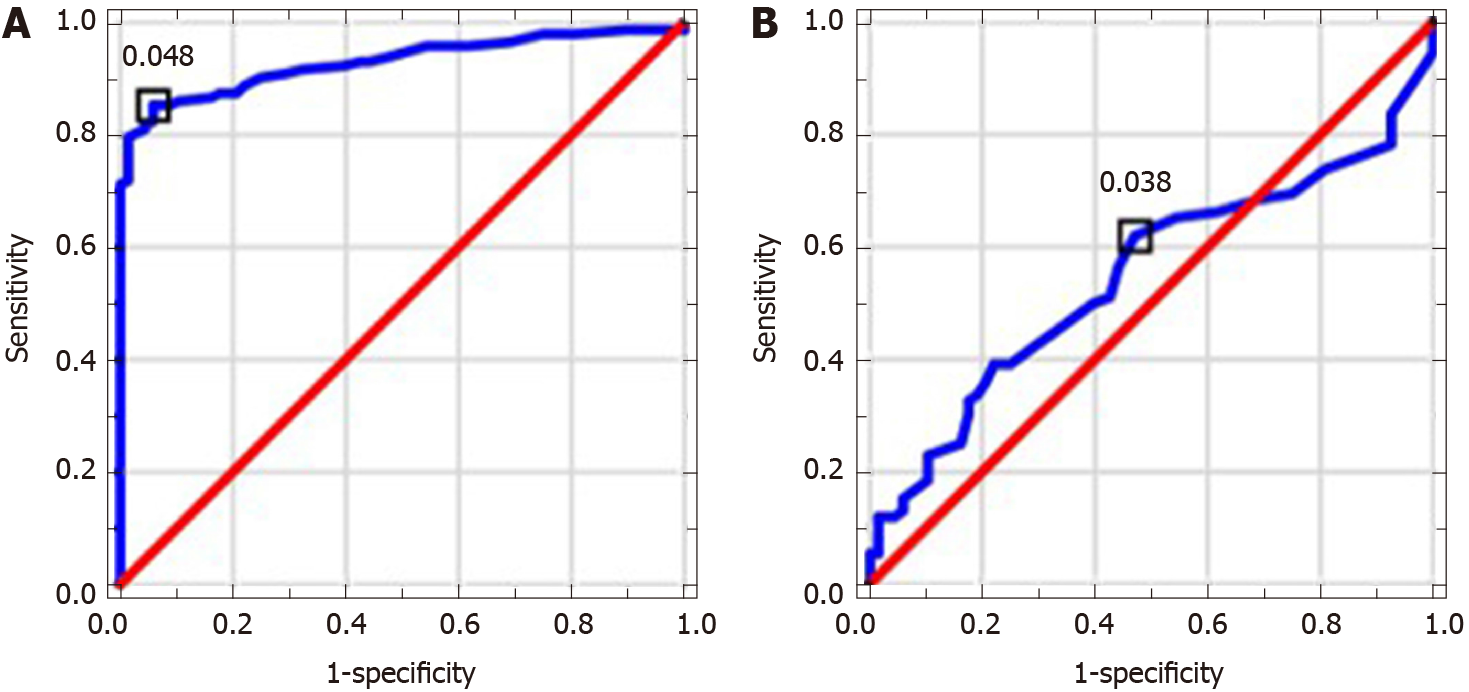
Figure 3 Receiver operating characteristics for mean platelet volume-to-platelet-ratio in alcoholic liver cirrhosis (A) and nonalcoholic fatty liver disease (B) groups.
Area under the curve value (AUC) = 0.929 (cut-off > 0.048) and AUC = 0.547 (cut-off > 0.038), respectively. A: Alcoholic liver cirrhosis; B: Nonalcoholic fatty liver disease.
- Citation: Michalak A, Cichoż-Lach H, Guz M, Kozicka J, Cybulski M, Jeleniewicz W, Stepulak A. Towards an evaluation of alcoholic liver cirrhosis and nonalcoholic fatty liver disease patients with hematological scales. World J Gastroenterol 2020; 26(47): 7538-7549
- URL: https://www.wjgnet.com/1007-9327/full/v26/i47/7538.htm
- DOI: https://dx.doi.org/10.3748/wjg.v26.i47.7538


