Copyright
©The Author(s) 2020.
World J Gastroenterol. Dec 7, 2020; 26(45): 7173-7190
Published online Dec 7, 2020. doi: 10.3748/wjg.v26.i45.7173
Published online Dec 7, 2020. doi: 10.3748/wjg.v26.i45.7173
Figure 1 Levels of Zonula occludens-1 and indoleamine 2,3-dioxygenase 1 mRNA in colon tissue and their correlations with fecal tryptophan metabolites.
A: The relative Zonula occludens-1 (ZO-1) mRNA levels in colorectal adenoma and colorectal cancer (CRC) were significantly lower than those in controls (P < 0.001); B: The relative indoleamine 2,3-dioxygenase 1 (IDO1) mRNA levels in ARA and CRC were higher than those in controls (P =0.04 and P = 0.035, respectively); C: Fecal kynurenine/tryptophan (Trp) ratio was positively correlated with the level of IDO1 mRNA in all subjects; D: There was a positive correlation between fecal indoles/Trp ratio and ZO-1 mRNA level in all subjects. KYN: Kynurenine; Trp: Tryptophan; HC: Healthy control; ADA: Colorectal adenoma; CRC: Colorectal cancer; ZO-1: Zonula occludens-1; IDO1: Indoleamine 2,3-dioxygenase 1.
Figure 2 Immunohistochemical staining for Zonula occludens-1 and its correlation with fecal indoles/tryptophan ratio (× 200 magnification).
Immunoreactivity of Zonula occludens-1 (ZO-1) tended to be decreased in colorectal adenoma (B) and colorectal cancer (C) compared to controls (A) as shown in the figure (scale bar = 100 μm); D: There was a positive correlation between fecal indoles/tryptophan ratio and ZO-1 protein in all subjects (P = 0.045). MOD: Mean optical density; Trp: Tryptophan; ZO-1: Zonula occludens-1.
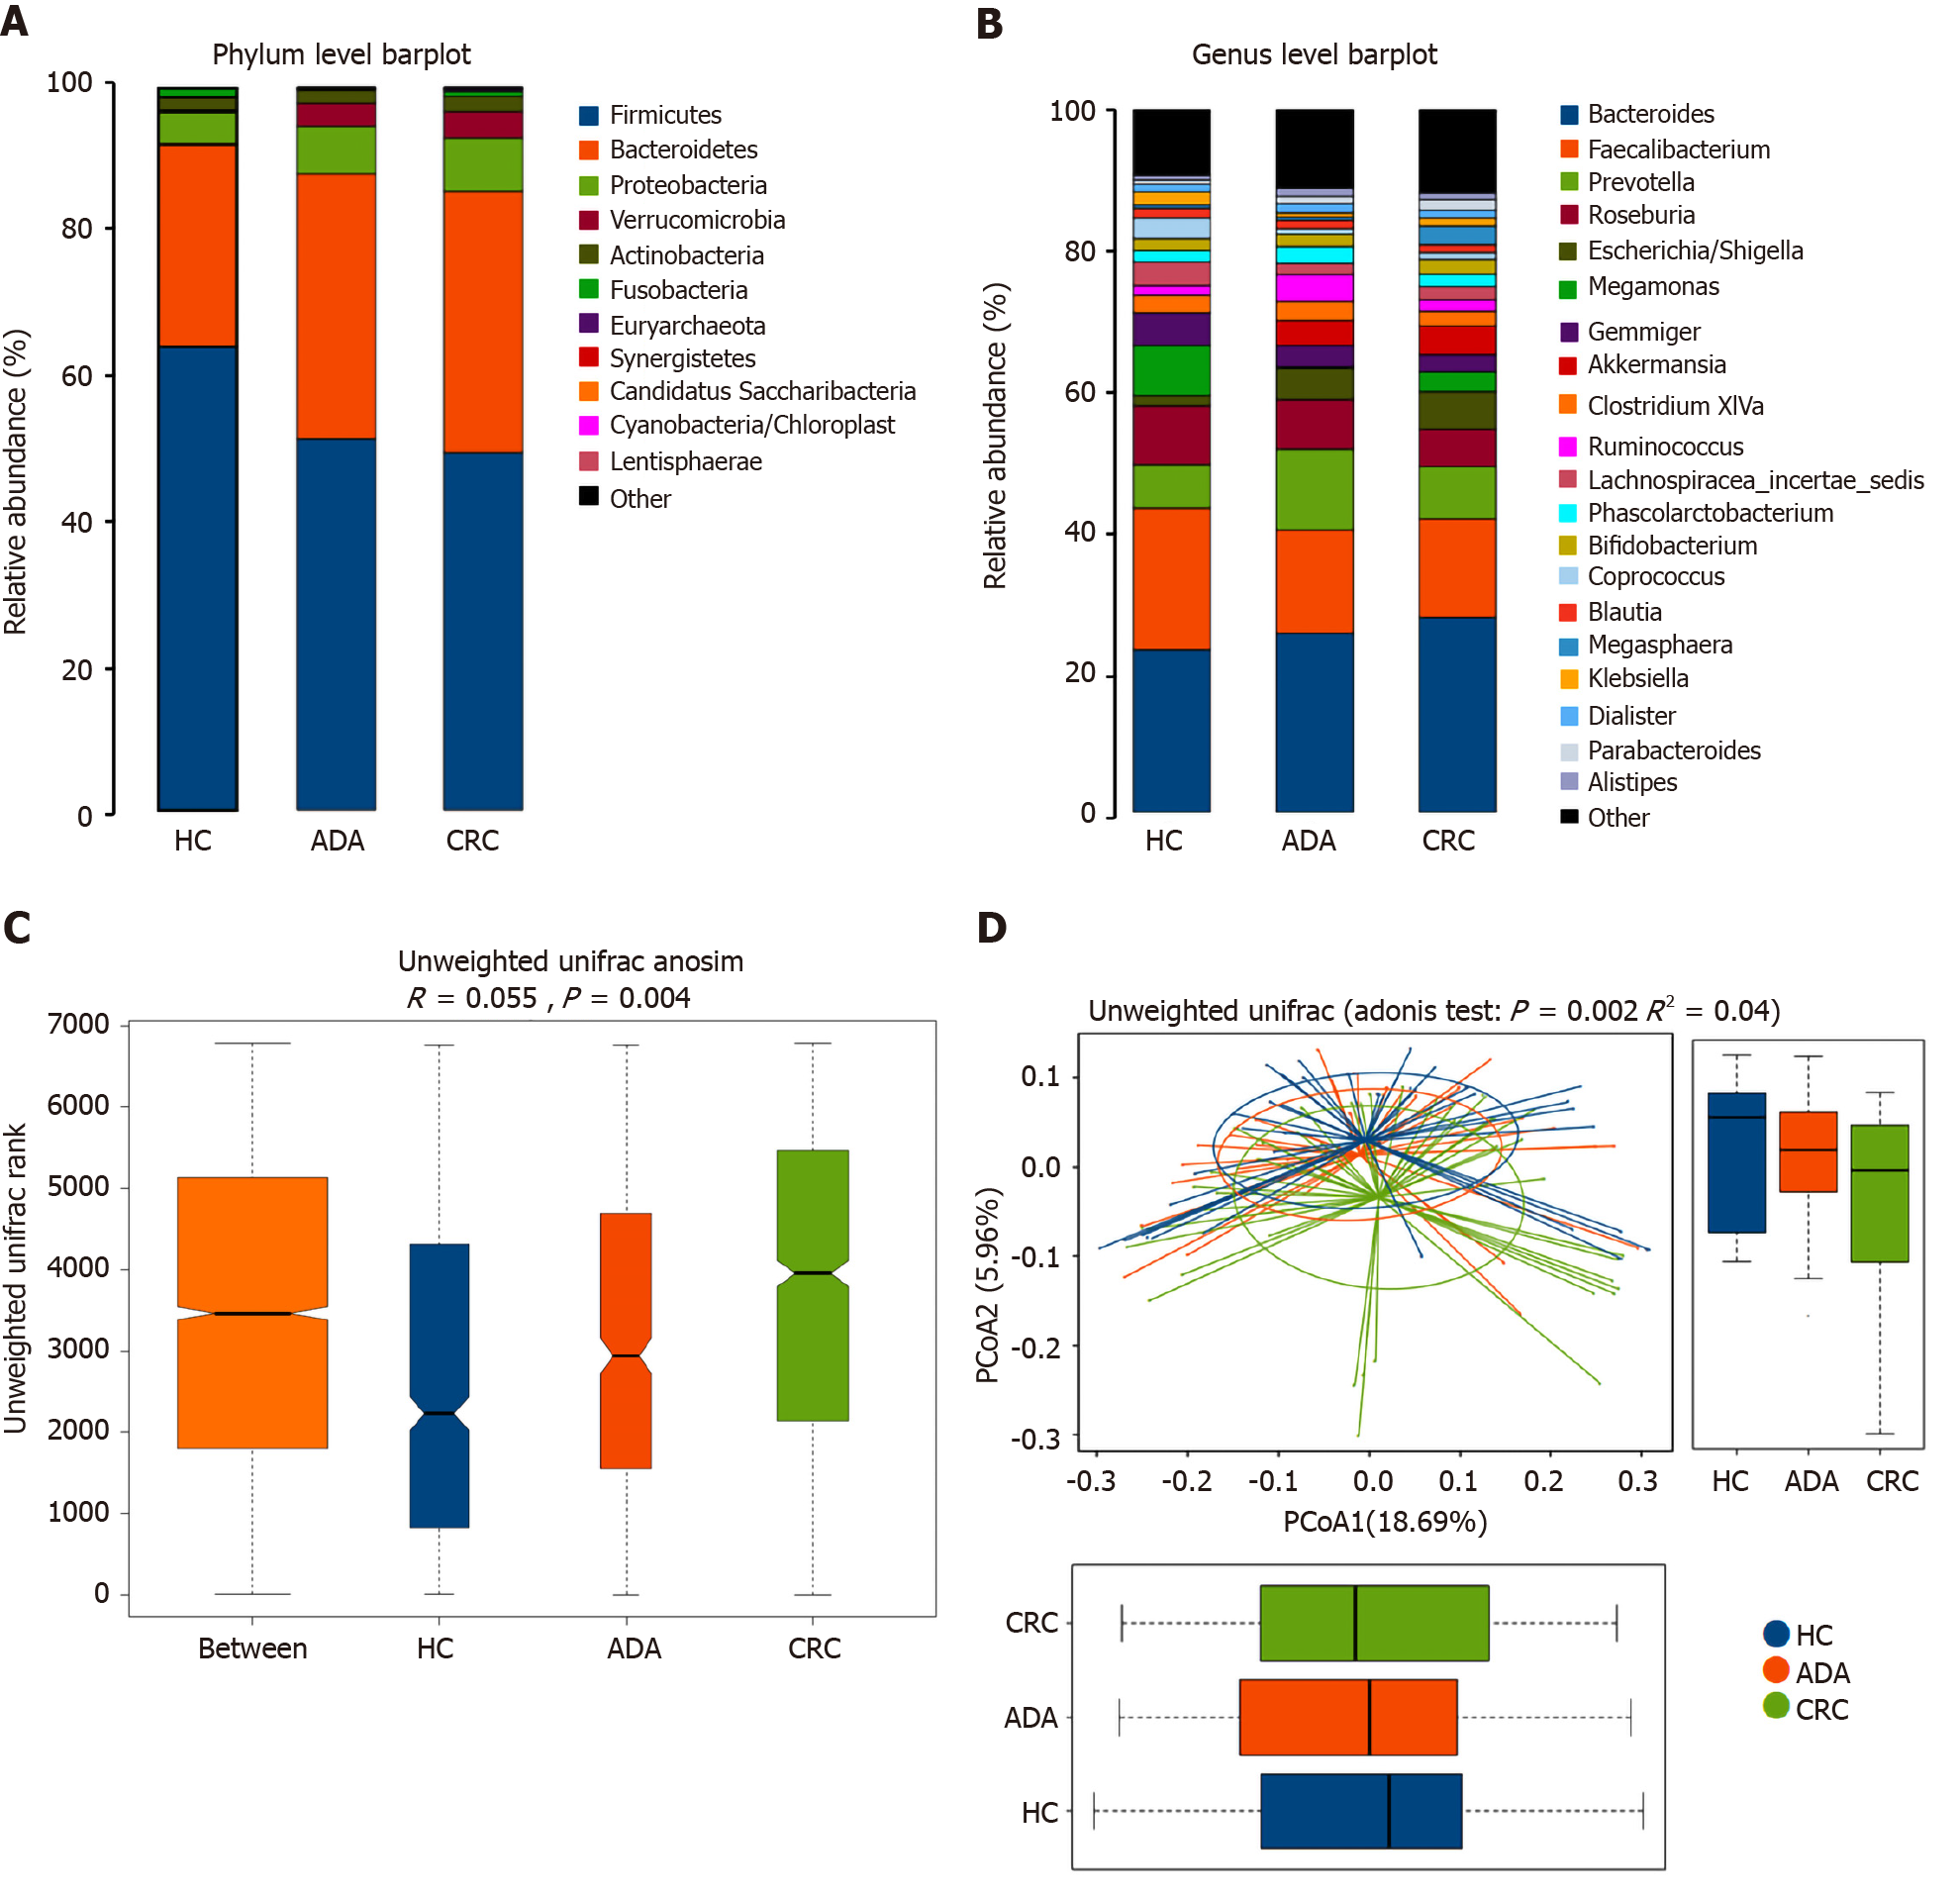
Figure 3 Fecal bacterial structure of patients with colorectal adenoma, colorectal cancer, and healthy controls.
A and B: Relative bacterial abundance of fecal bacterial at the phylum and genus levels in the three groups; C and D: Unweighted Unifrac (Anosim and Adonis) analysis of fecal bacterial in the patients and healthy control group (P < 0.05). Different colors represent different groups, and the distance between points indicates the degree of difference; boxes indicate the interquartile range; lines inside the boxes indicate the medians; the two whiskers indicate the maximum and minimum of the data; the points outside the box indicate outliers. HC: Healthy control; ADA: Colorectal adenoma; CRC: Colorectal cancer.
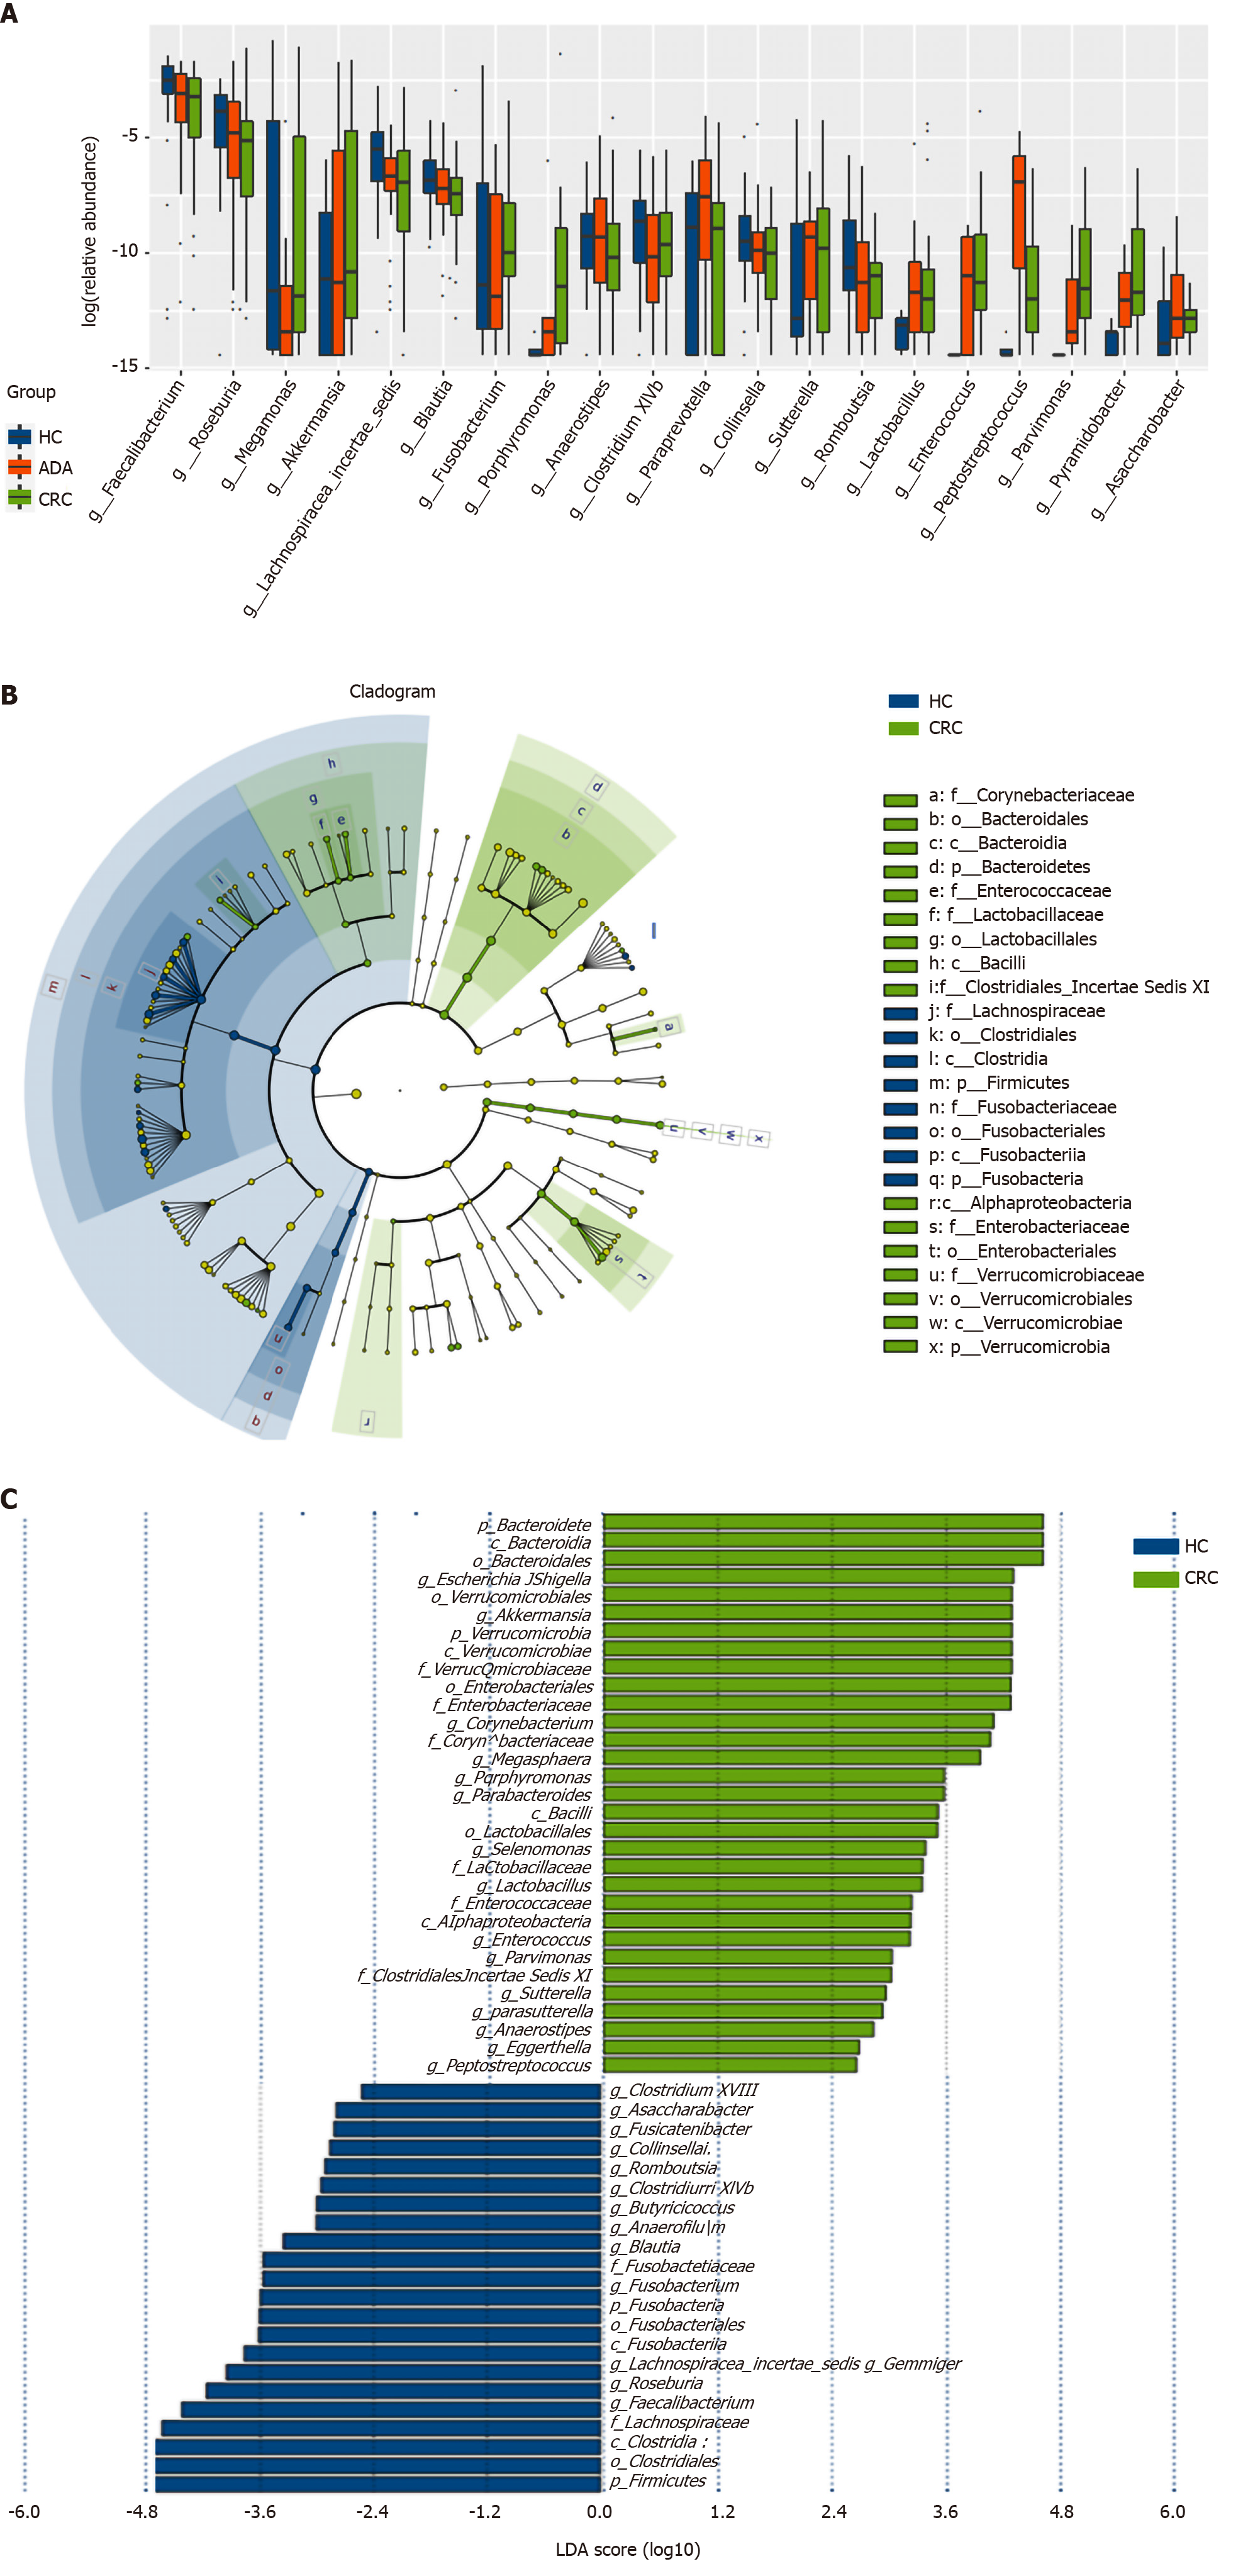
Figure 4 Different genus among the three groups and linear discriminant analysis effect size analysis of fecal bacterial of colorectal cancer patients and healthy controls.
A: Top 20 different genus among the three groups with a Kruskal-Wallis’s P value < 0.05; B: Cladogram showing enriched taxa in the colorectal cancer (CRC) patient and healthy control (HC) groups; the taxa represented by the English letters in the cladogram are shown in the legend on the right; C: Taxa enriched in HCs are indicated with a negative score and the taxa enriched in the CRC group are indicated with a positive linear discriminant analysis (LDA) score; only taxa with an LDA effect size’s P value < 0.05 and an LDA score ≥ 2.0 are showed. LDA: Linear discriminant analysis; HC: Healthy control; CRC: Colorectal cancer.
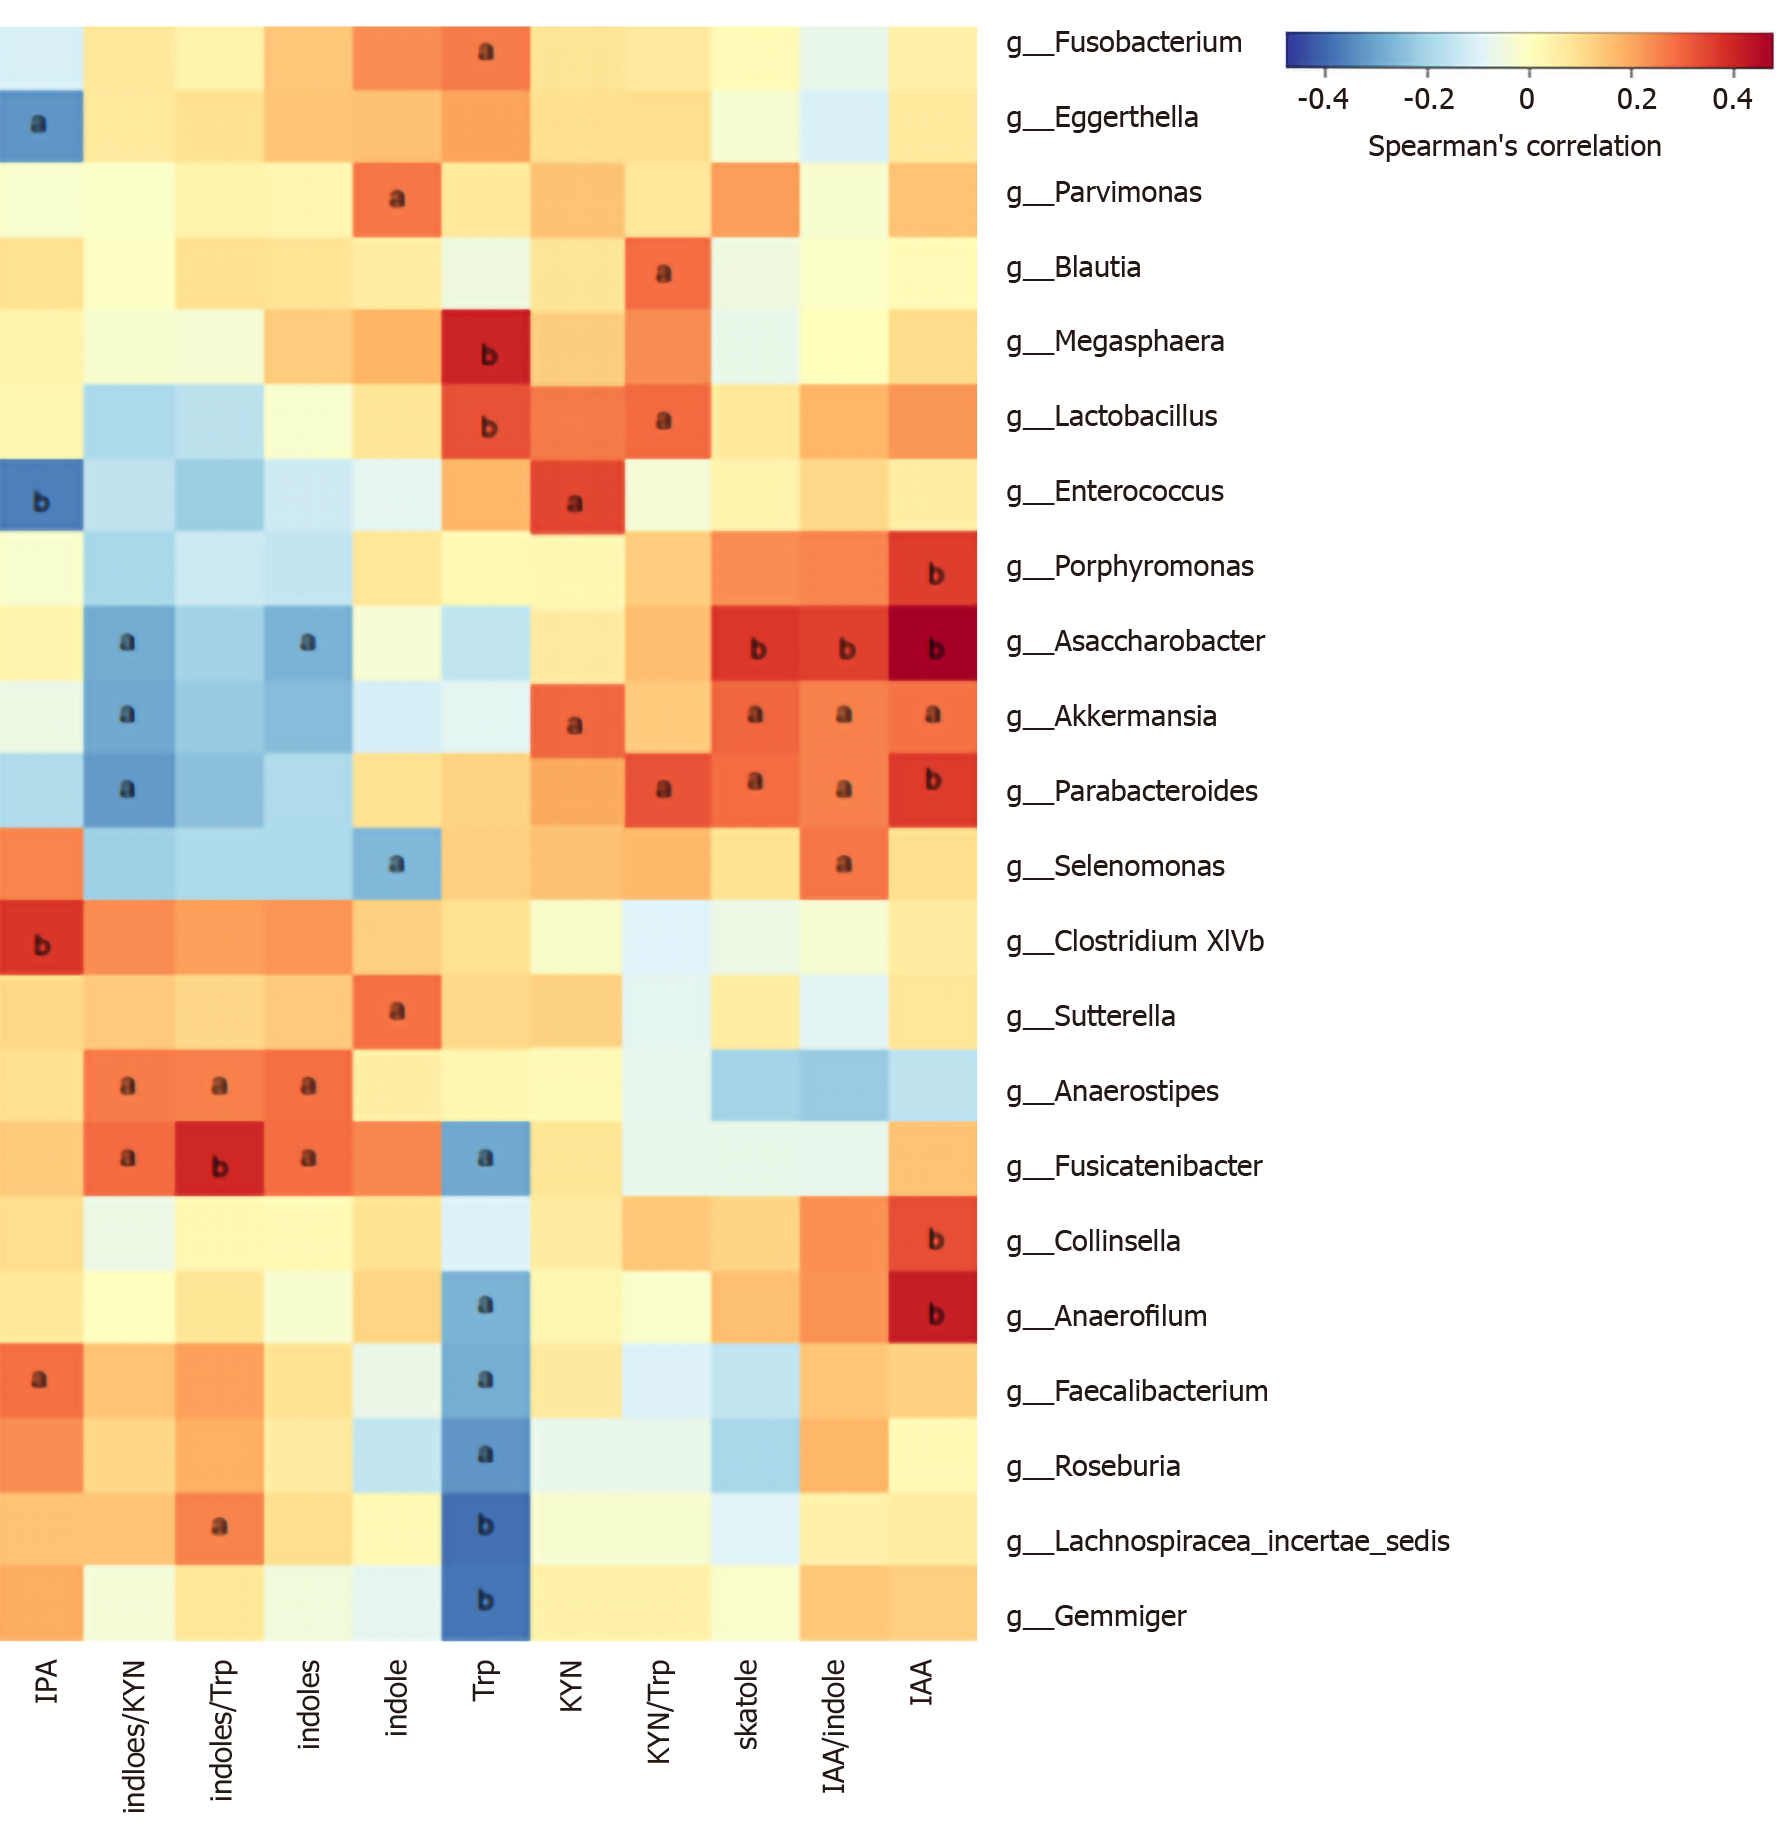
Figure 5 Correlations between differential bacteria at the genus level using linear discriminant analysis effect size analysis and fecal metabolites.
The heatmap presents the Spearman correlation coefficients between fecal metabolites and genera with significantly different relative abundance in the colorectal cancer (CRC) patients and healthy controls (HCs). Indoles were positively related to the genera Asaccharobacter (Actinobacteria) and Parabacteroides (Bacteroidetes), and members of the phylum Firmicutes (such as Clostridium XlVb, Fusicatenibacter, Anaerofilum, and Anaerostipes), whose relative abundances were lower in CRC patients than in HCs in the linear discriminant analysis effect size analysis. aP < 0.05, bP < 0.01. HC: Healthy control; CRC: Colorectal cancer. IPA: Indole-3-propionic acid; IAA: Indole-3-acid-acetic; KYN: Kynurenine; Trp: Tryptophan.
- Citation: Sun XZ, Zhao DY, Zhou YC, Wang QQ, Qin G, Yao SK. Alteration of fecal tryptophan metabolism correlates with shifted microbiota and may be involved in pathogenesis of colorectal cancer. World J Gastroenterol 2020; 26(45): 7173-7190
- URL: https://www.wjgnet.com/1007-9327/full/v26/i45/7173.htm
- DOI: https://dx.doi.org/10.3748/wjg.v26.i45.7173


