Copyright
©The Author(s) 2020.
World J Gastroenterol. Nov 7, 2020; 26(41): 6488-6509
Published online Nov 7, 2020. doi: 10.3748/wjg.v26.i41.6488
Published online Nov 7, 2020. doi: 10.3748/wjg.v26.i41.6488
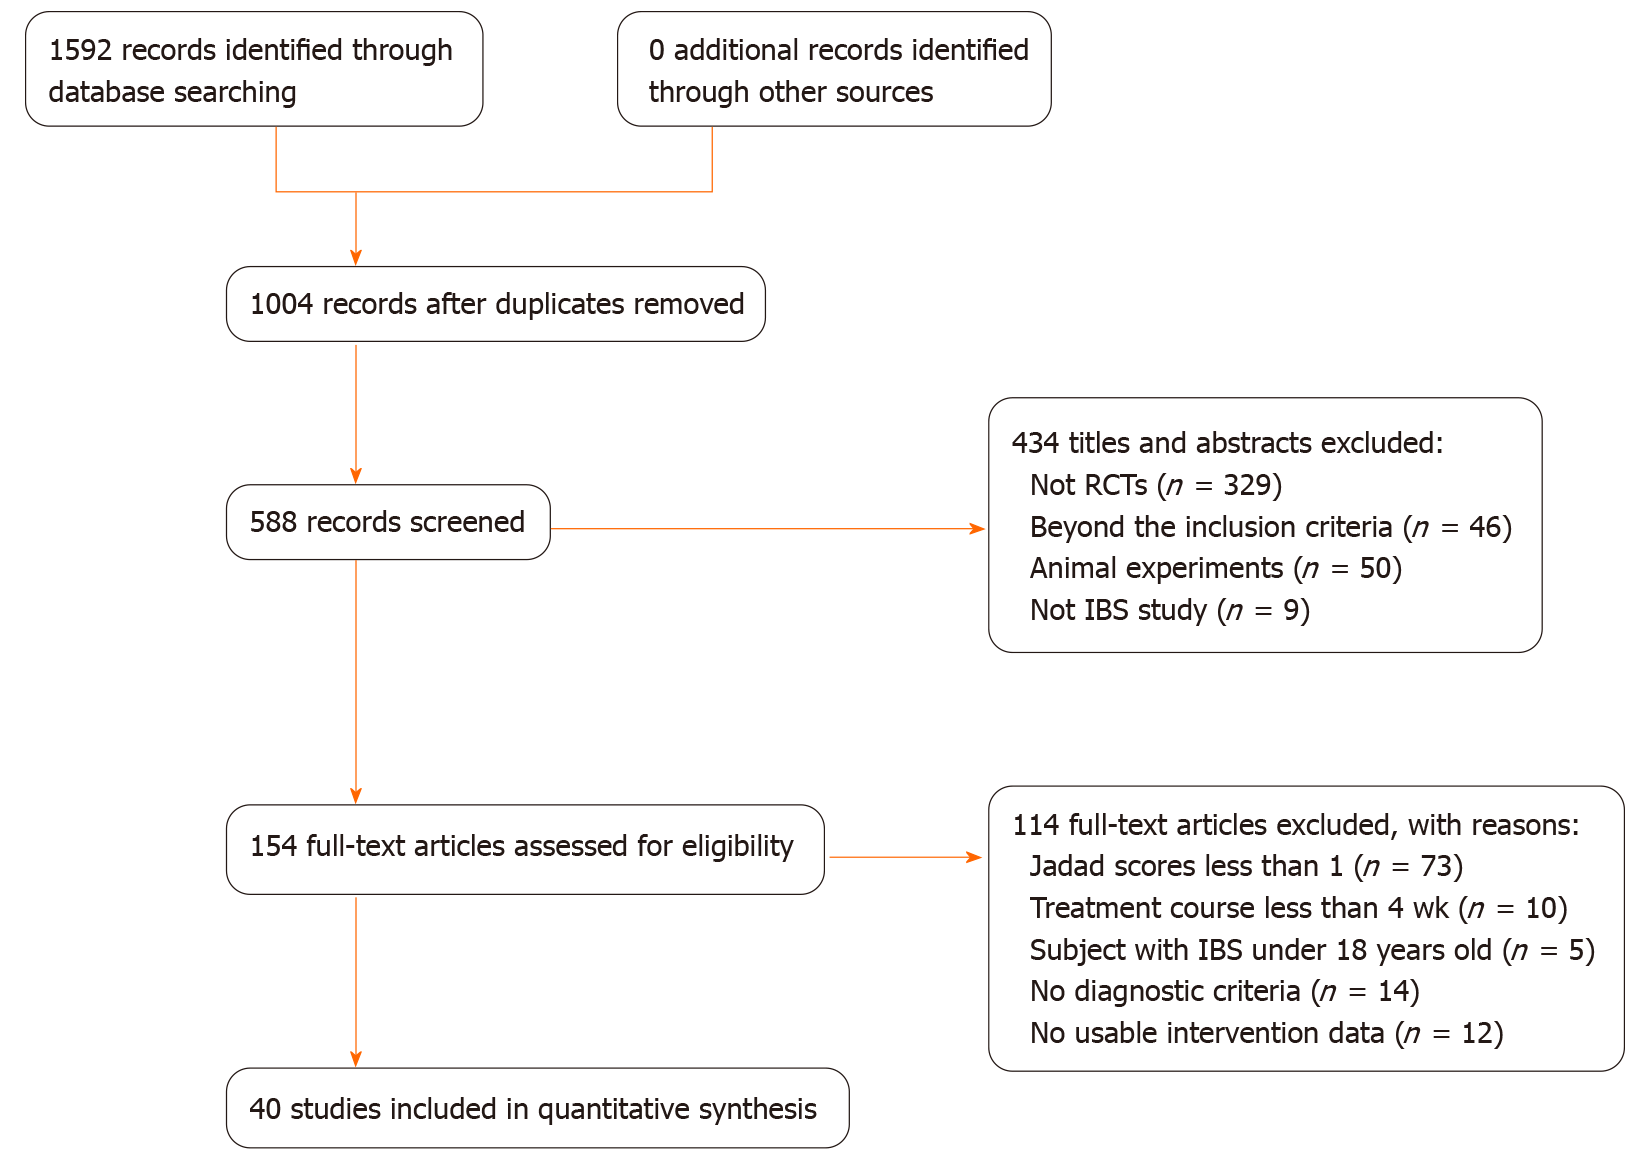
Figure 1 Flow diagram.
IBS: Irritable bowel syndrome; RCTs: Randomized controlled trials.
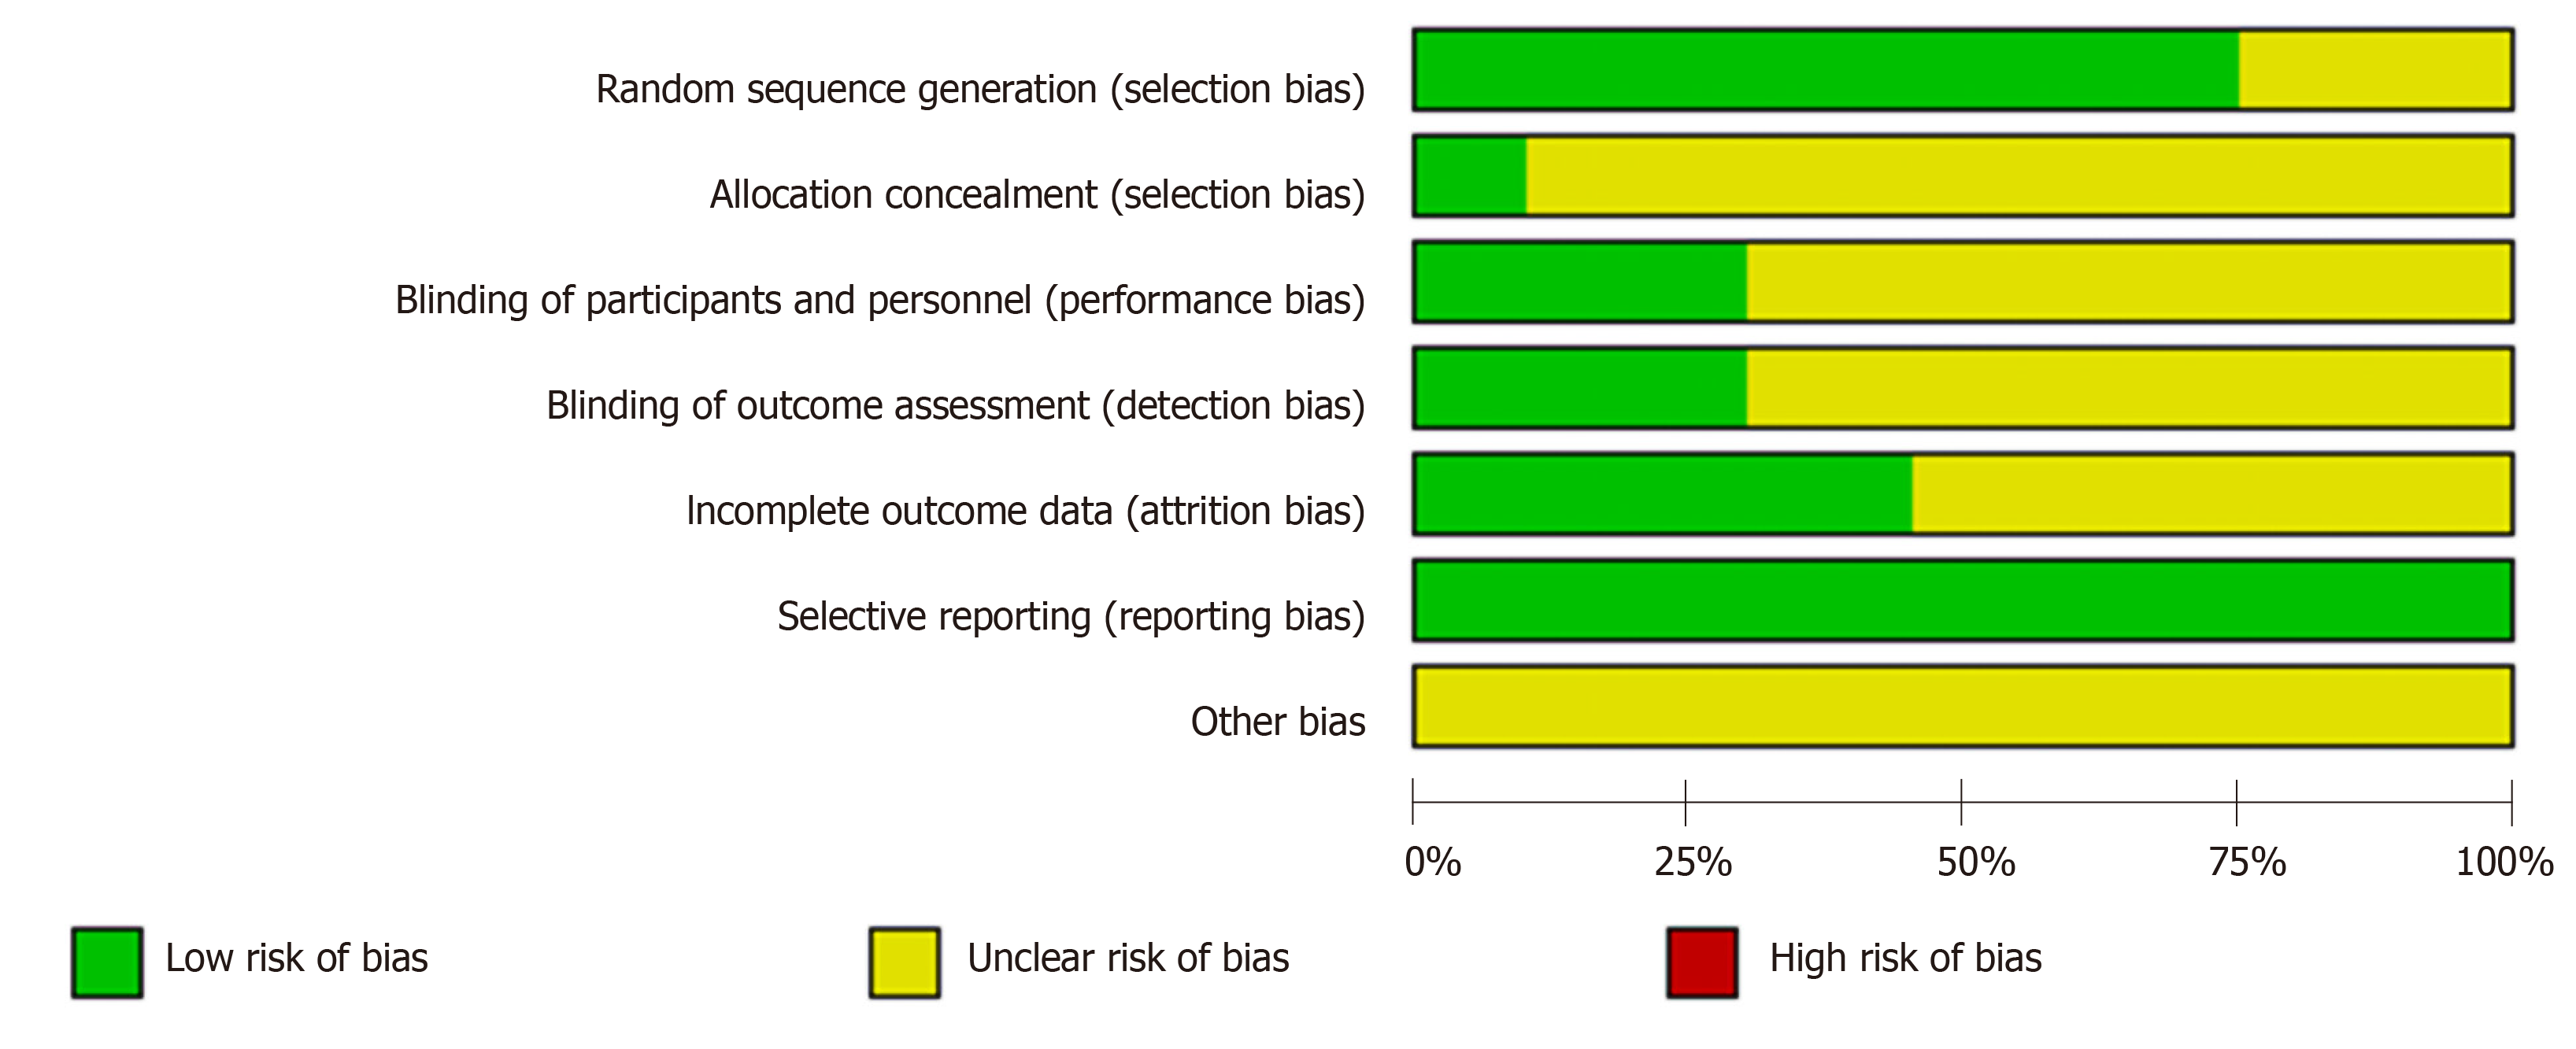
Figure 2 Risk of bias graph.
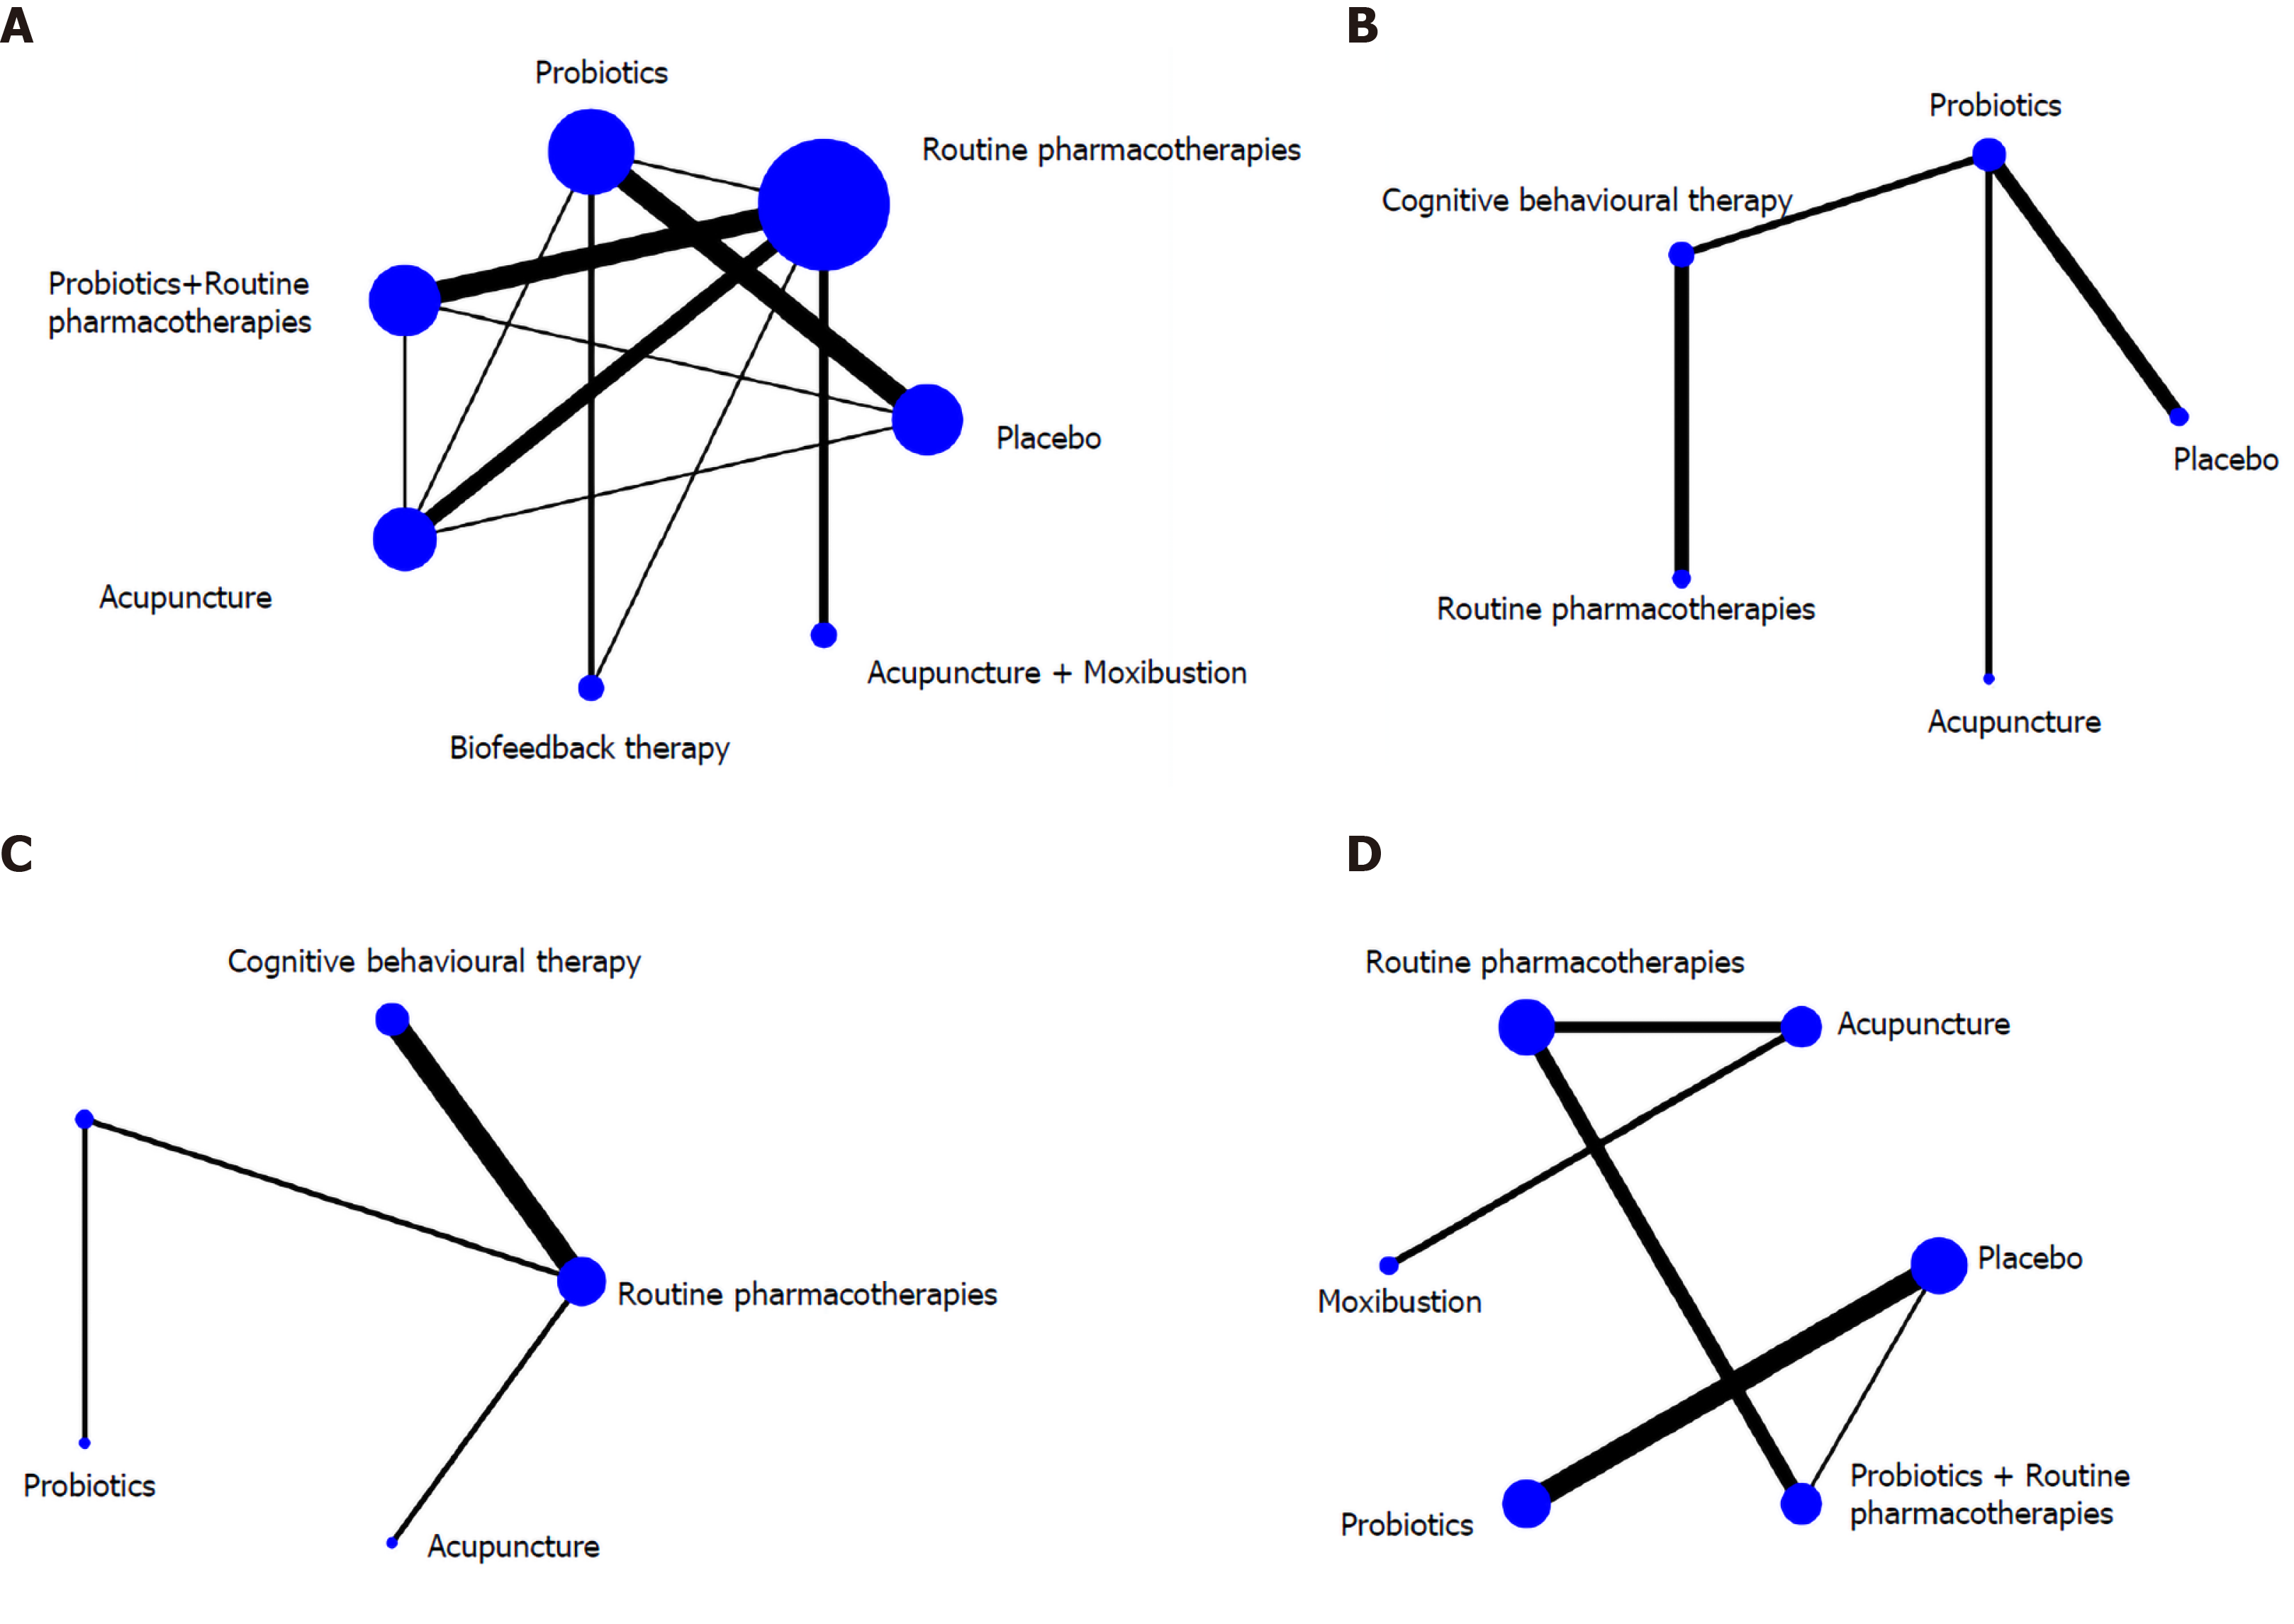
Figure 3 Network evidence of four endpoints.
A: Overall clinical efficacy; B: Irritable bowel syndrome symptom severity scale; C: Self-rating anxiety scale and self-rating depression scale; D: Adverse effects.
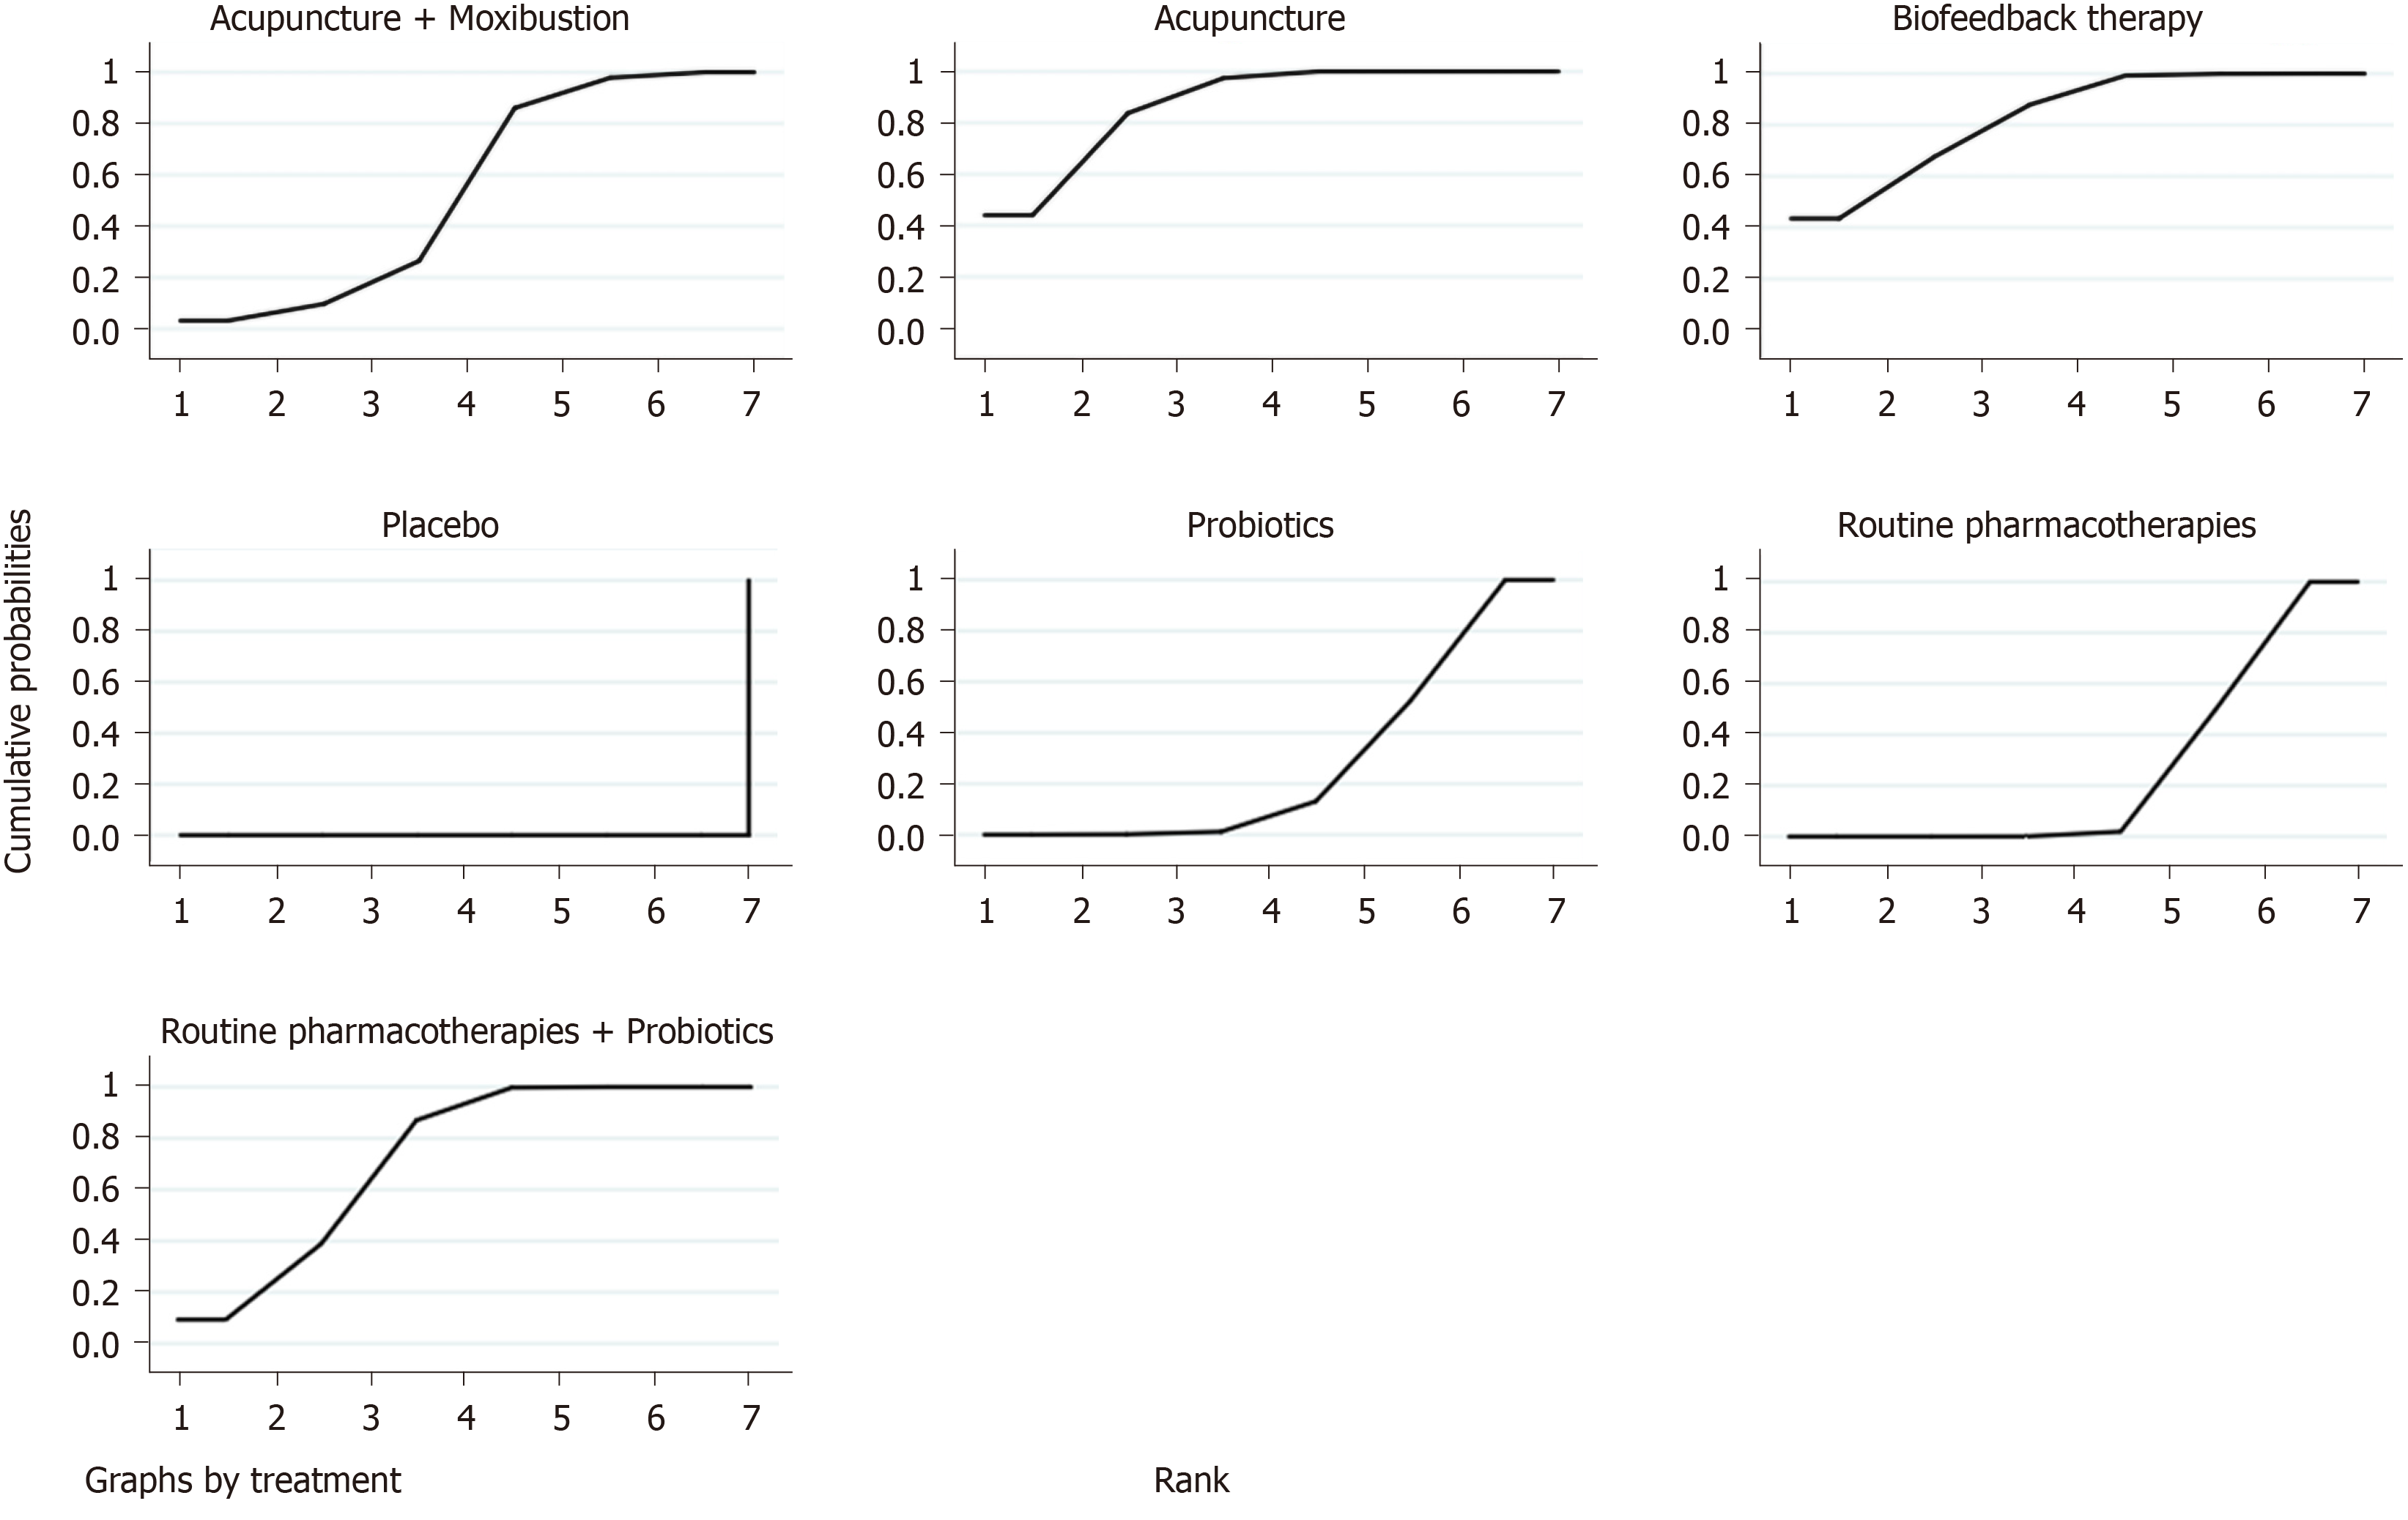
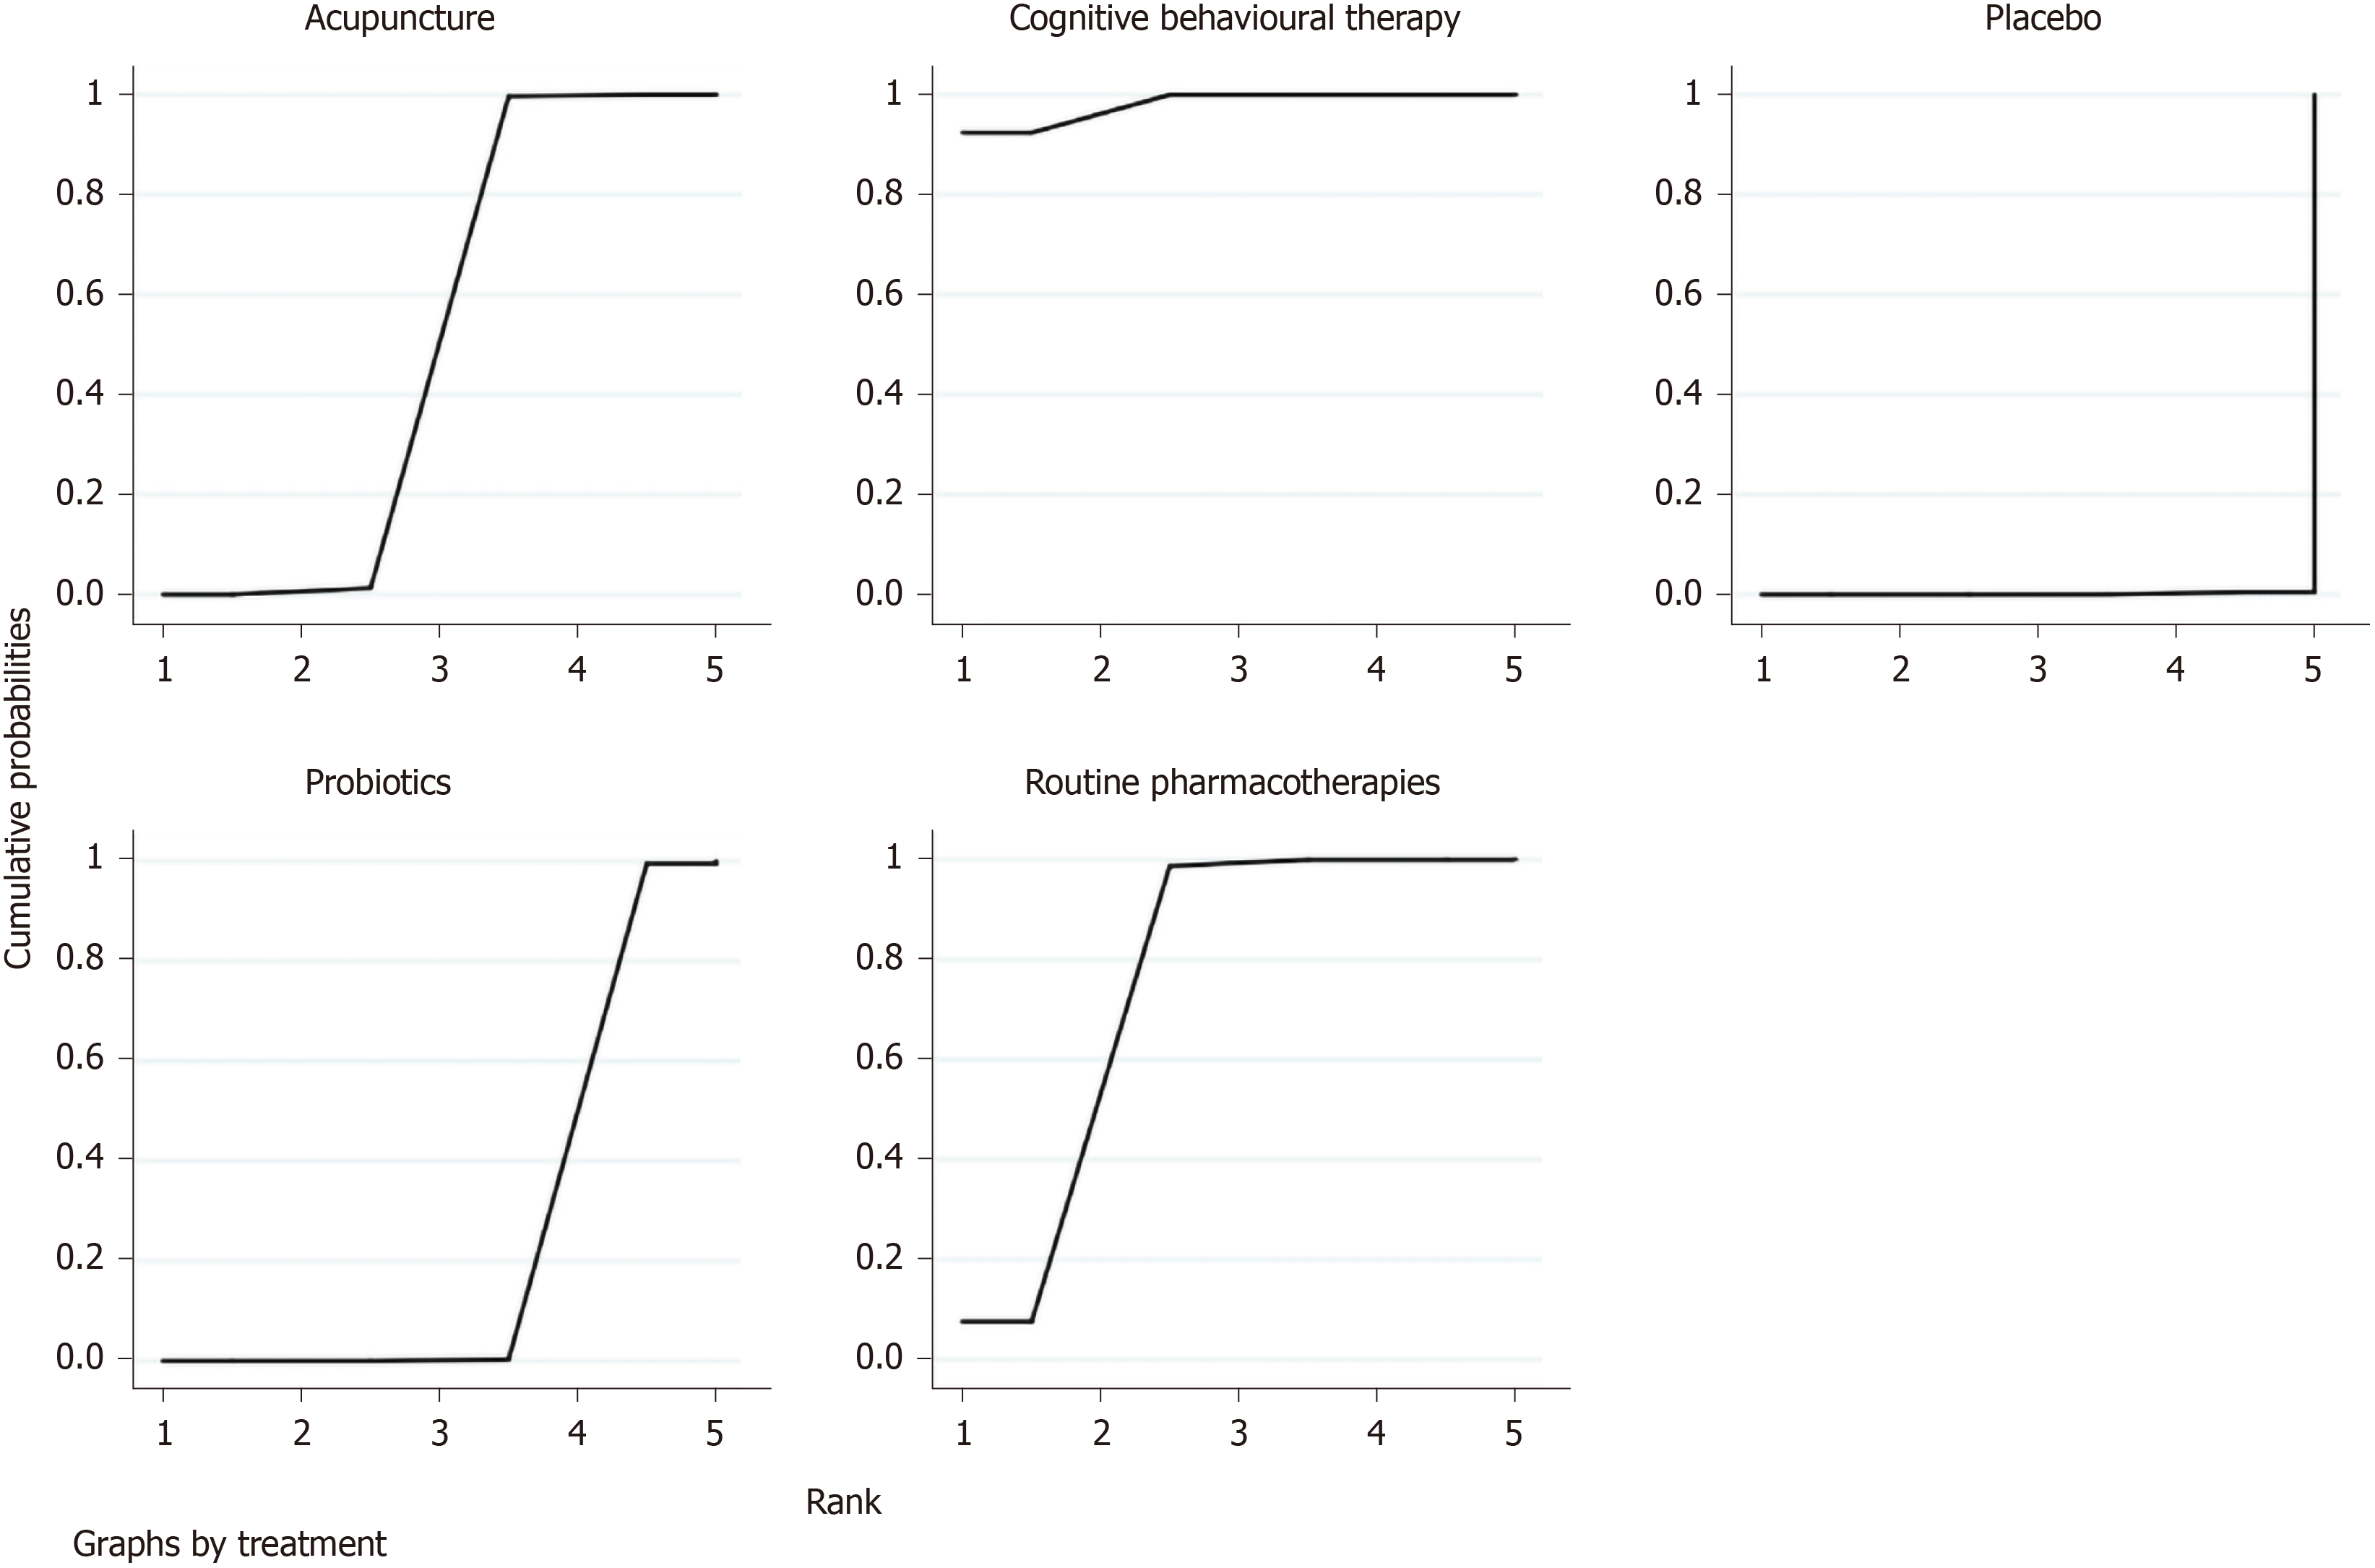
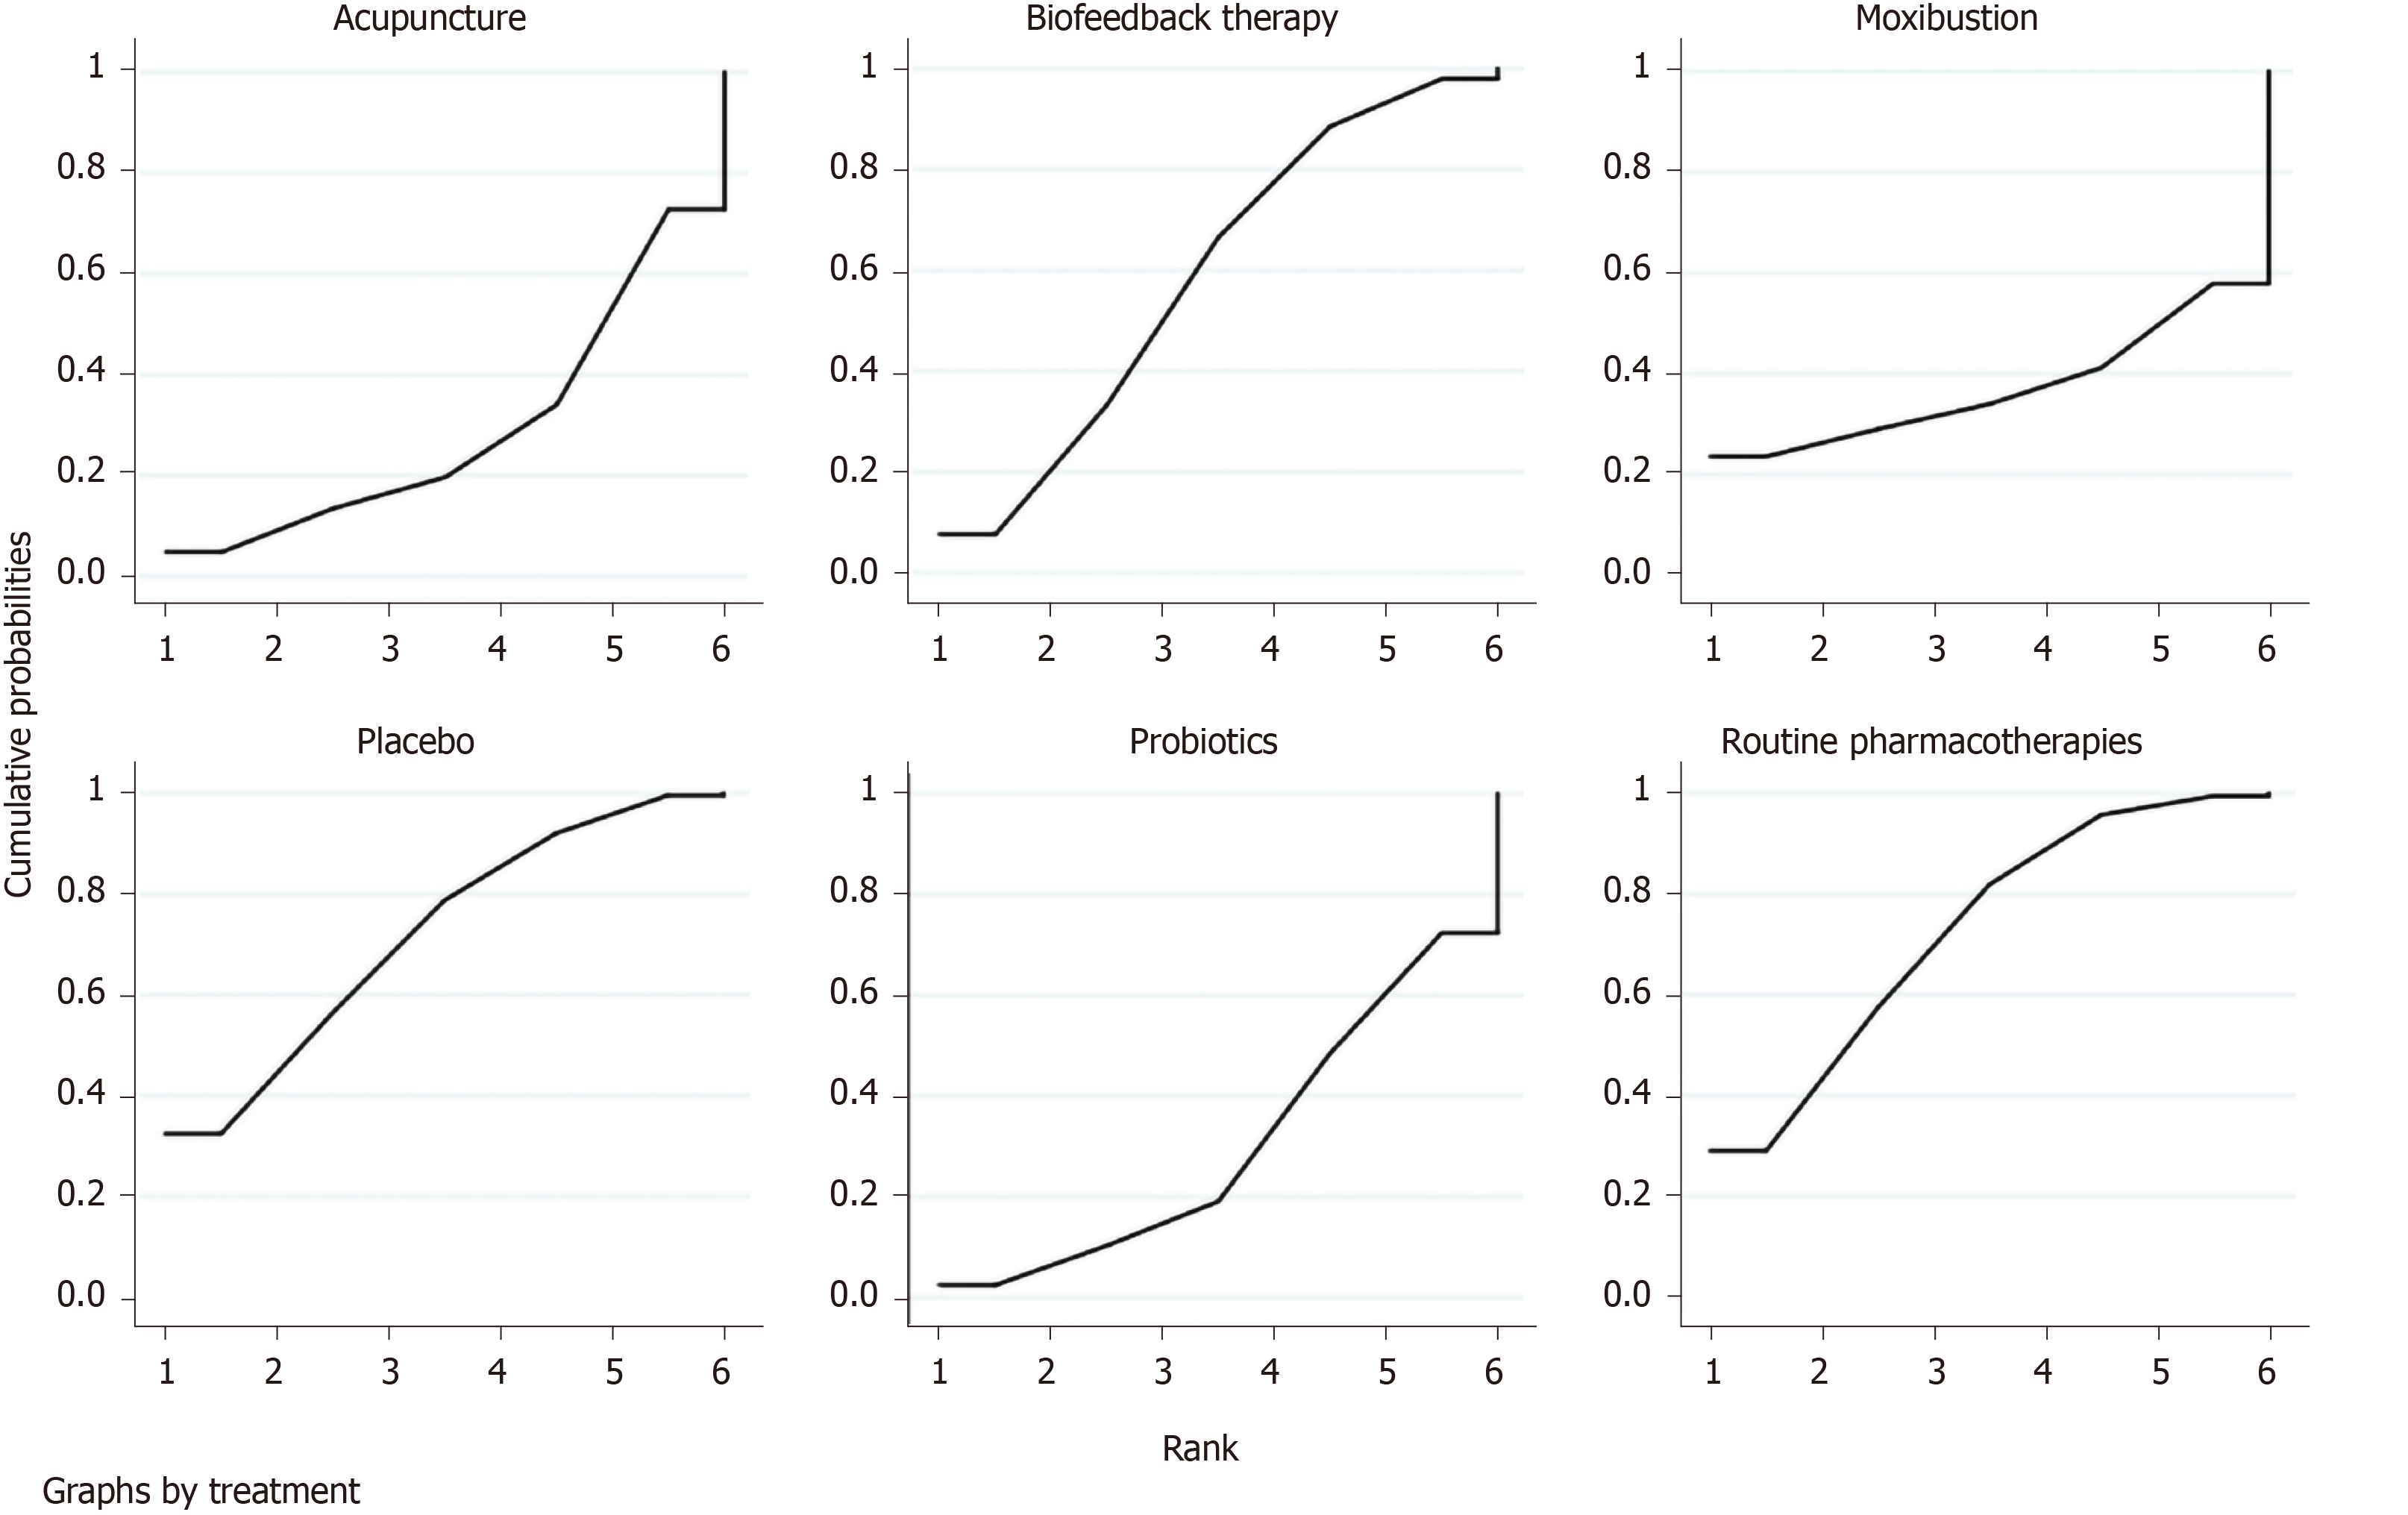
Figure 4 Surface under the cumulative ranking curve plot of overall clinical efficacy.
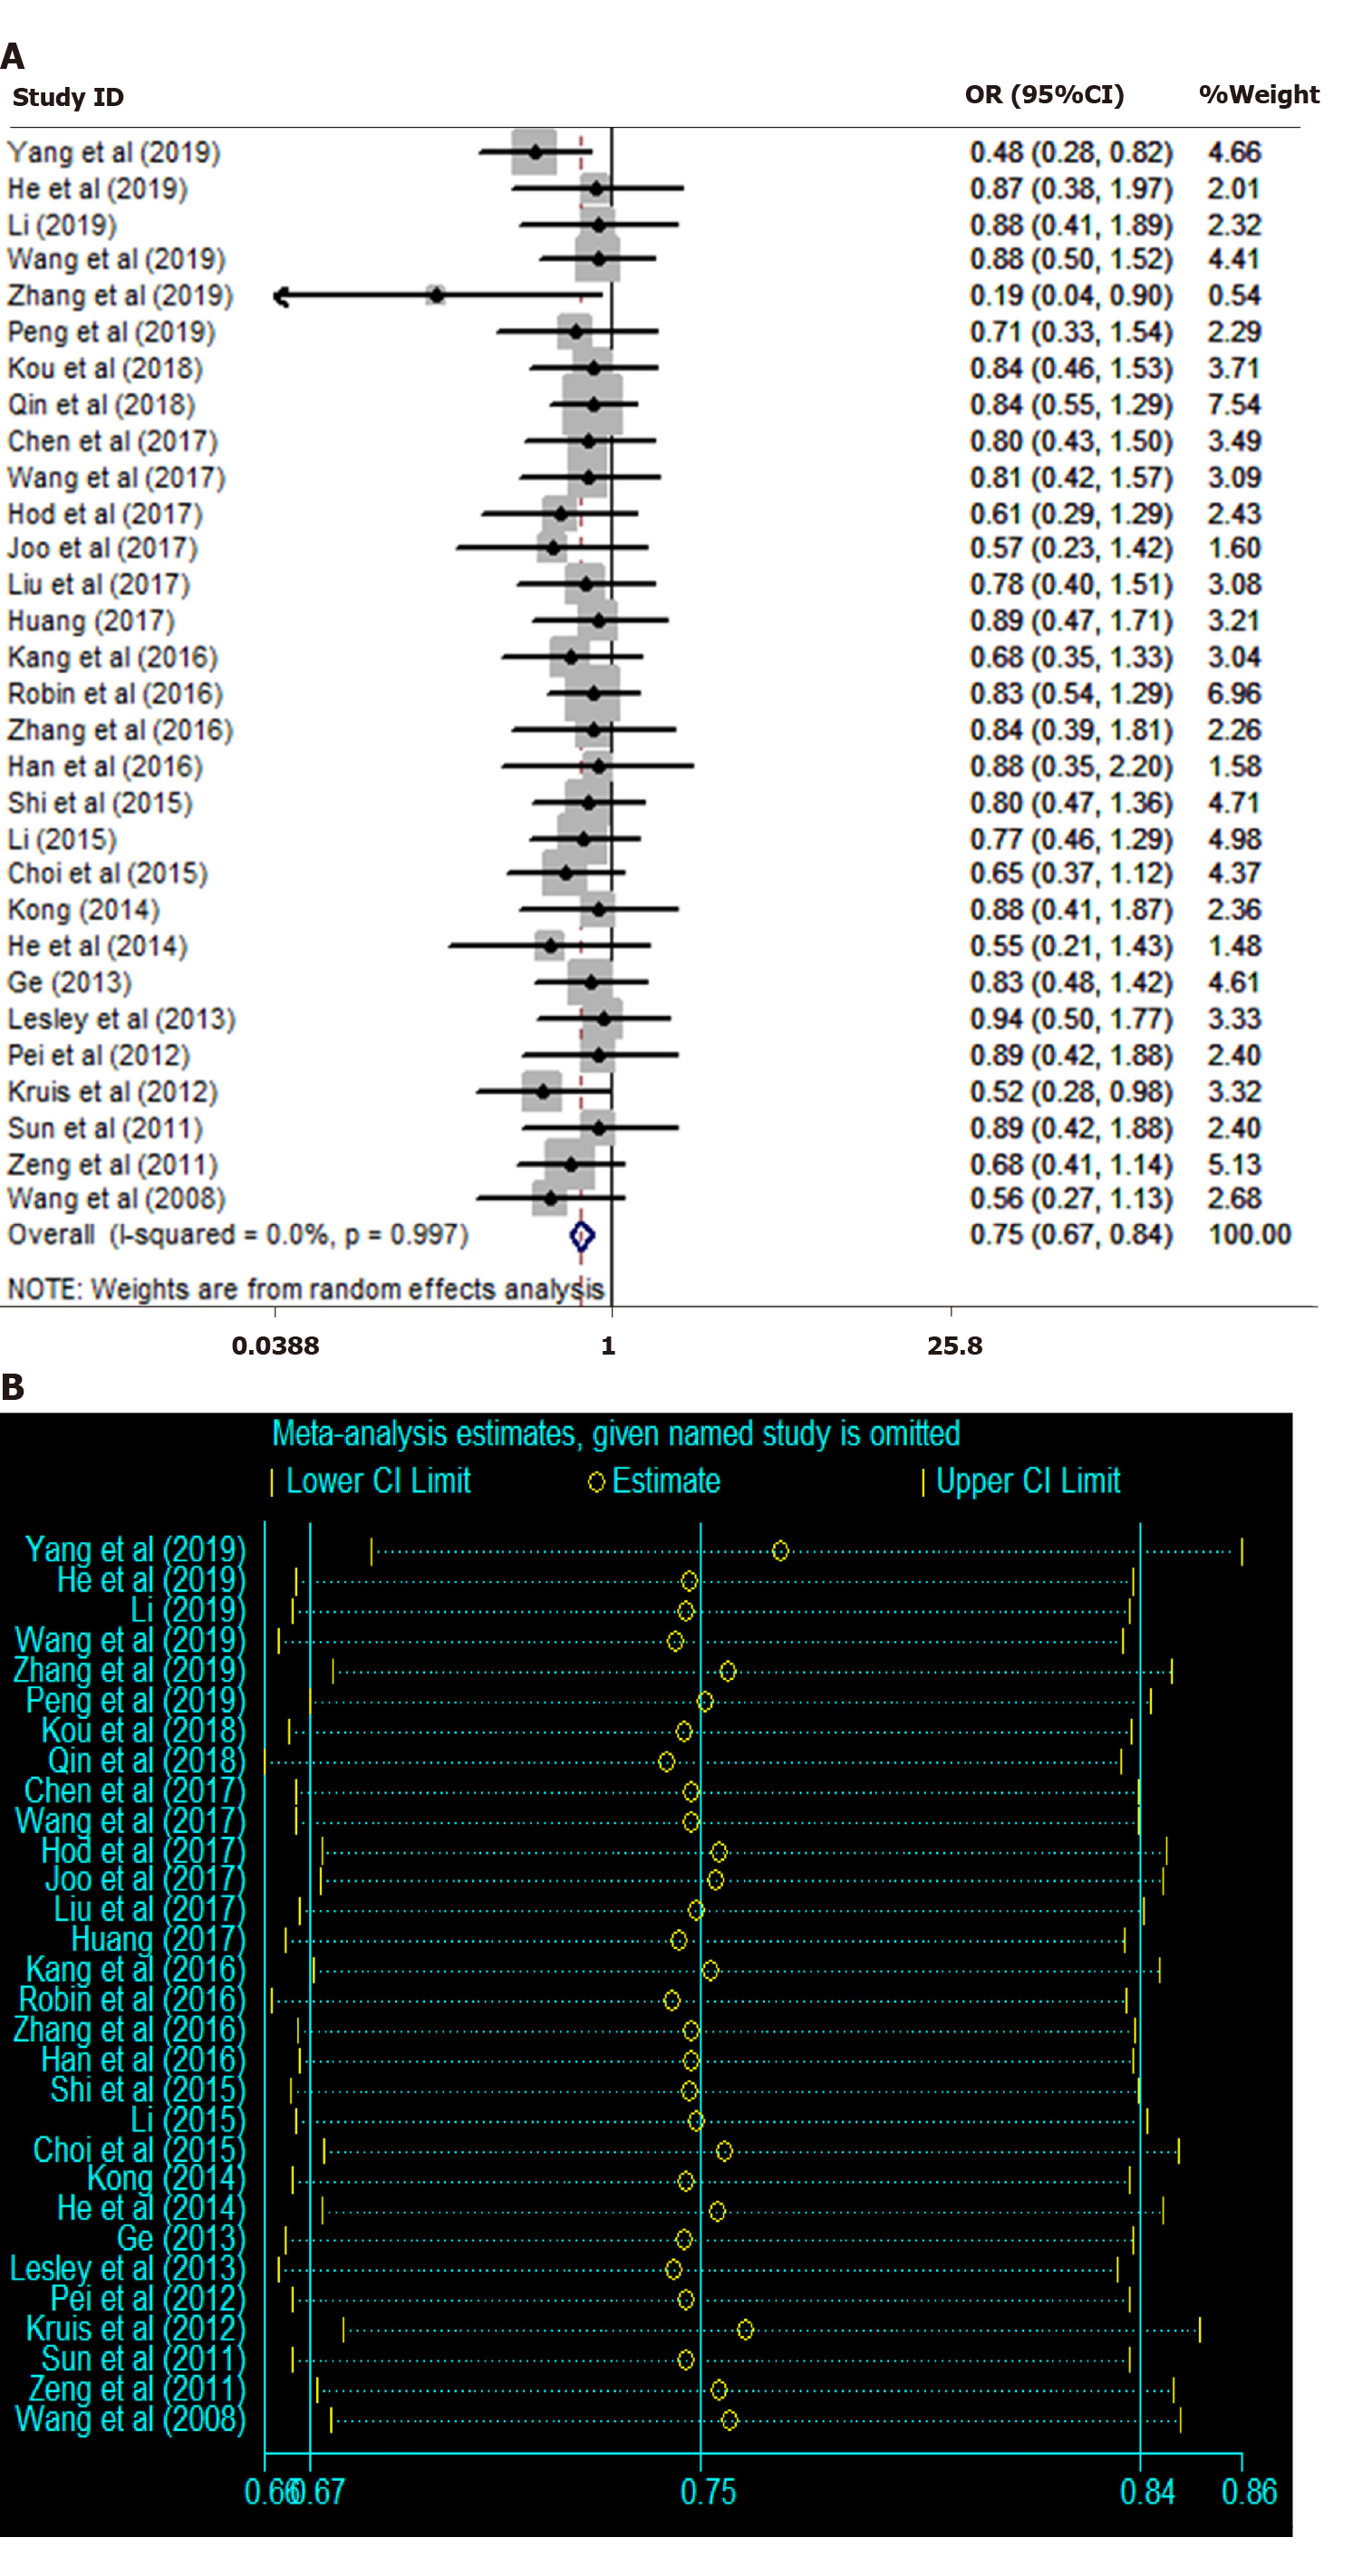
Figure 5 Heterogeneity and sensitivity analysis.
A: Heterogeneity analysis; B: Sensitivity analysis. CI: Confidence interval; OR: Odds ratio.
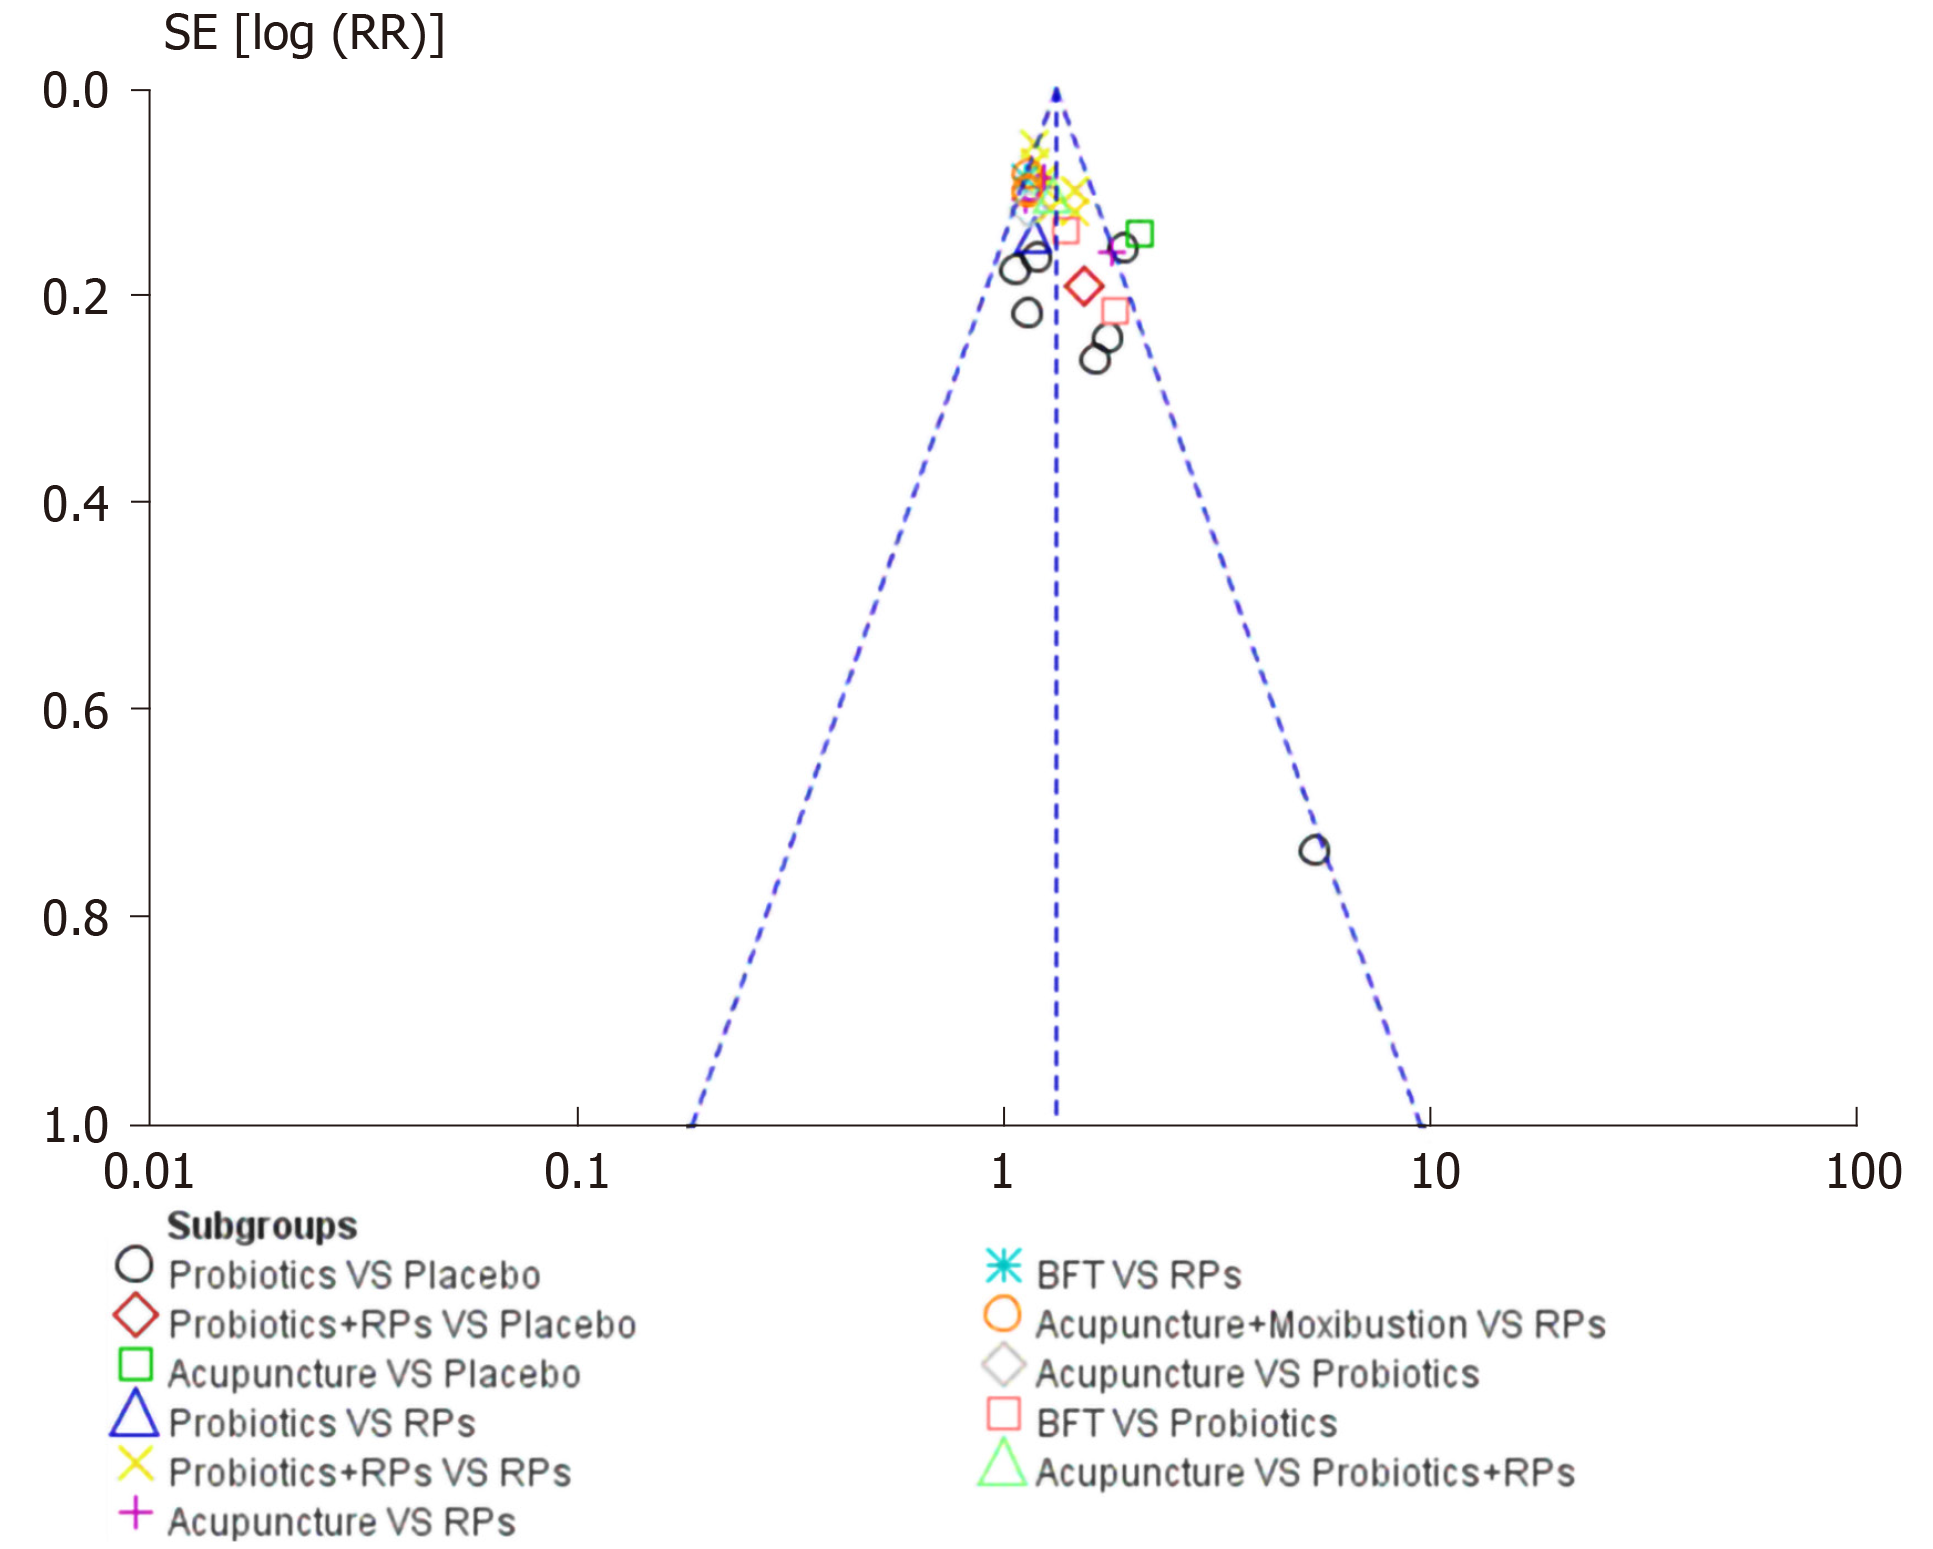
Figure 6 Funnel plot of overall clinical efficacy.
BFT: Biofeedback therapy; RPs: Routine pharmacotherapies.
Figure 7 Surface under the cumulative ranking curve plot of irritable bowel syndrome symptom severity scale.
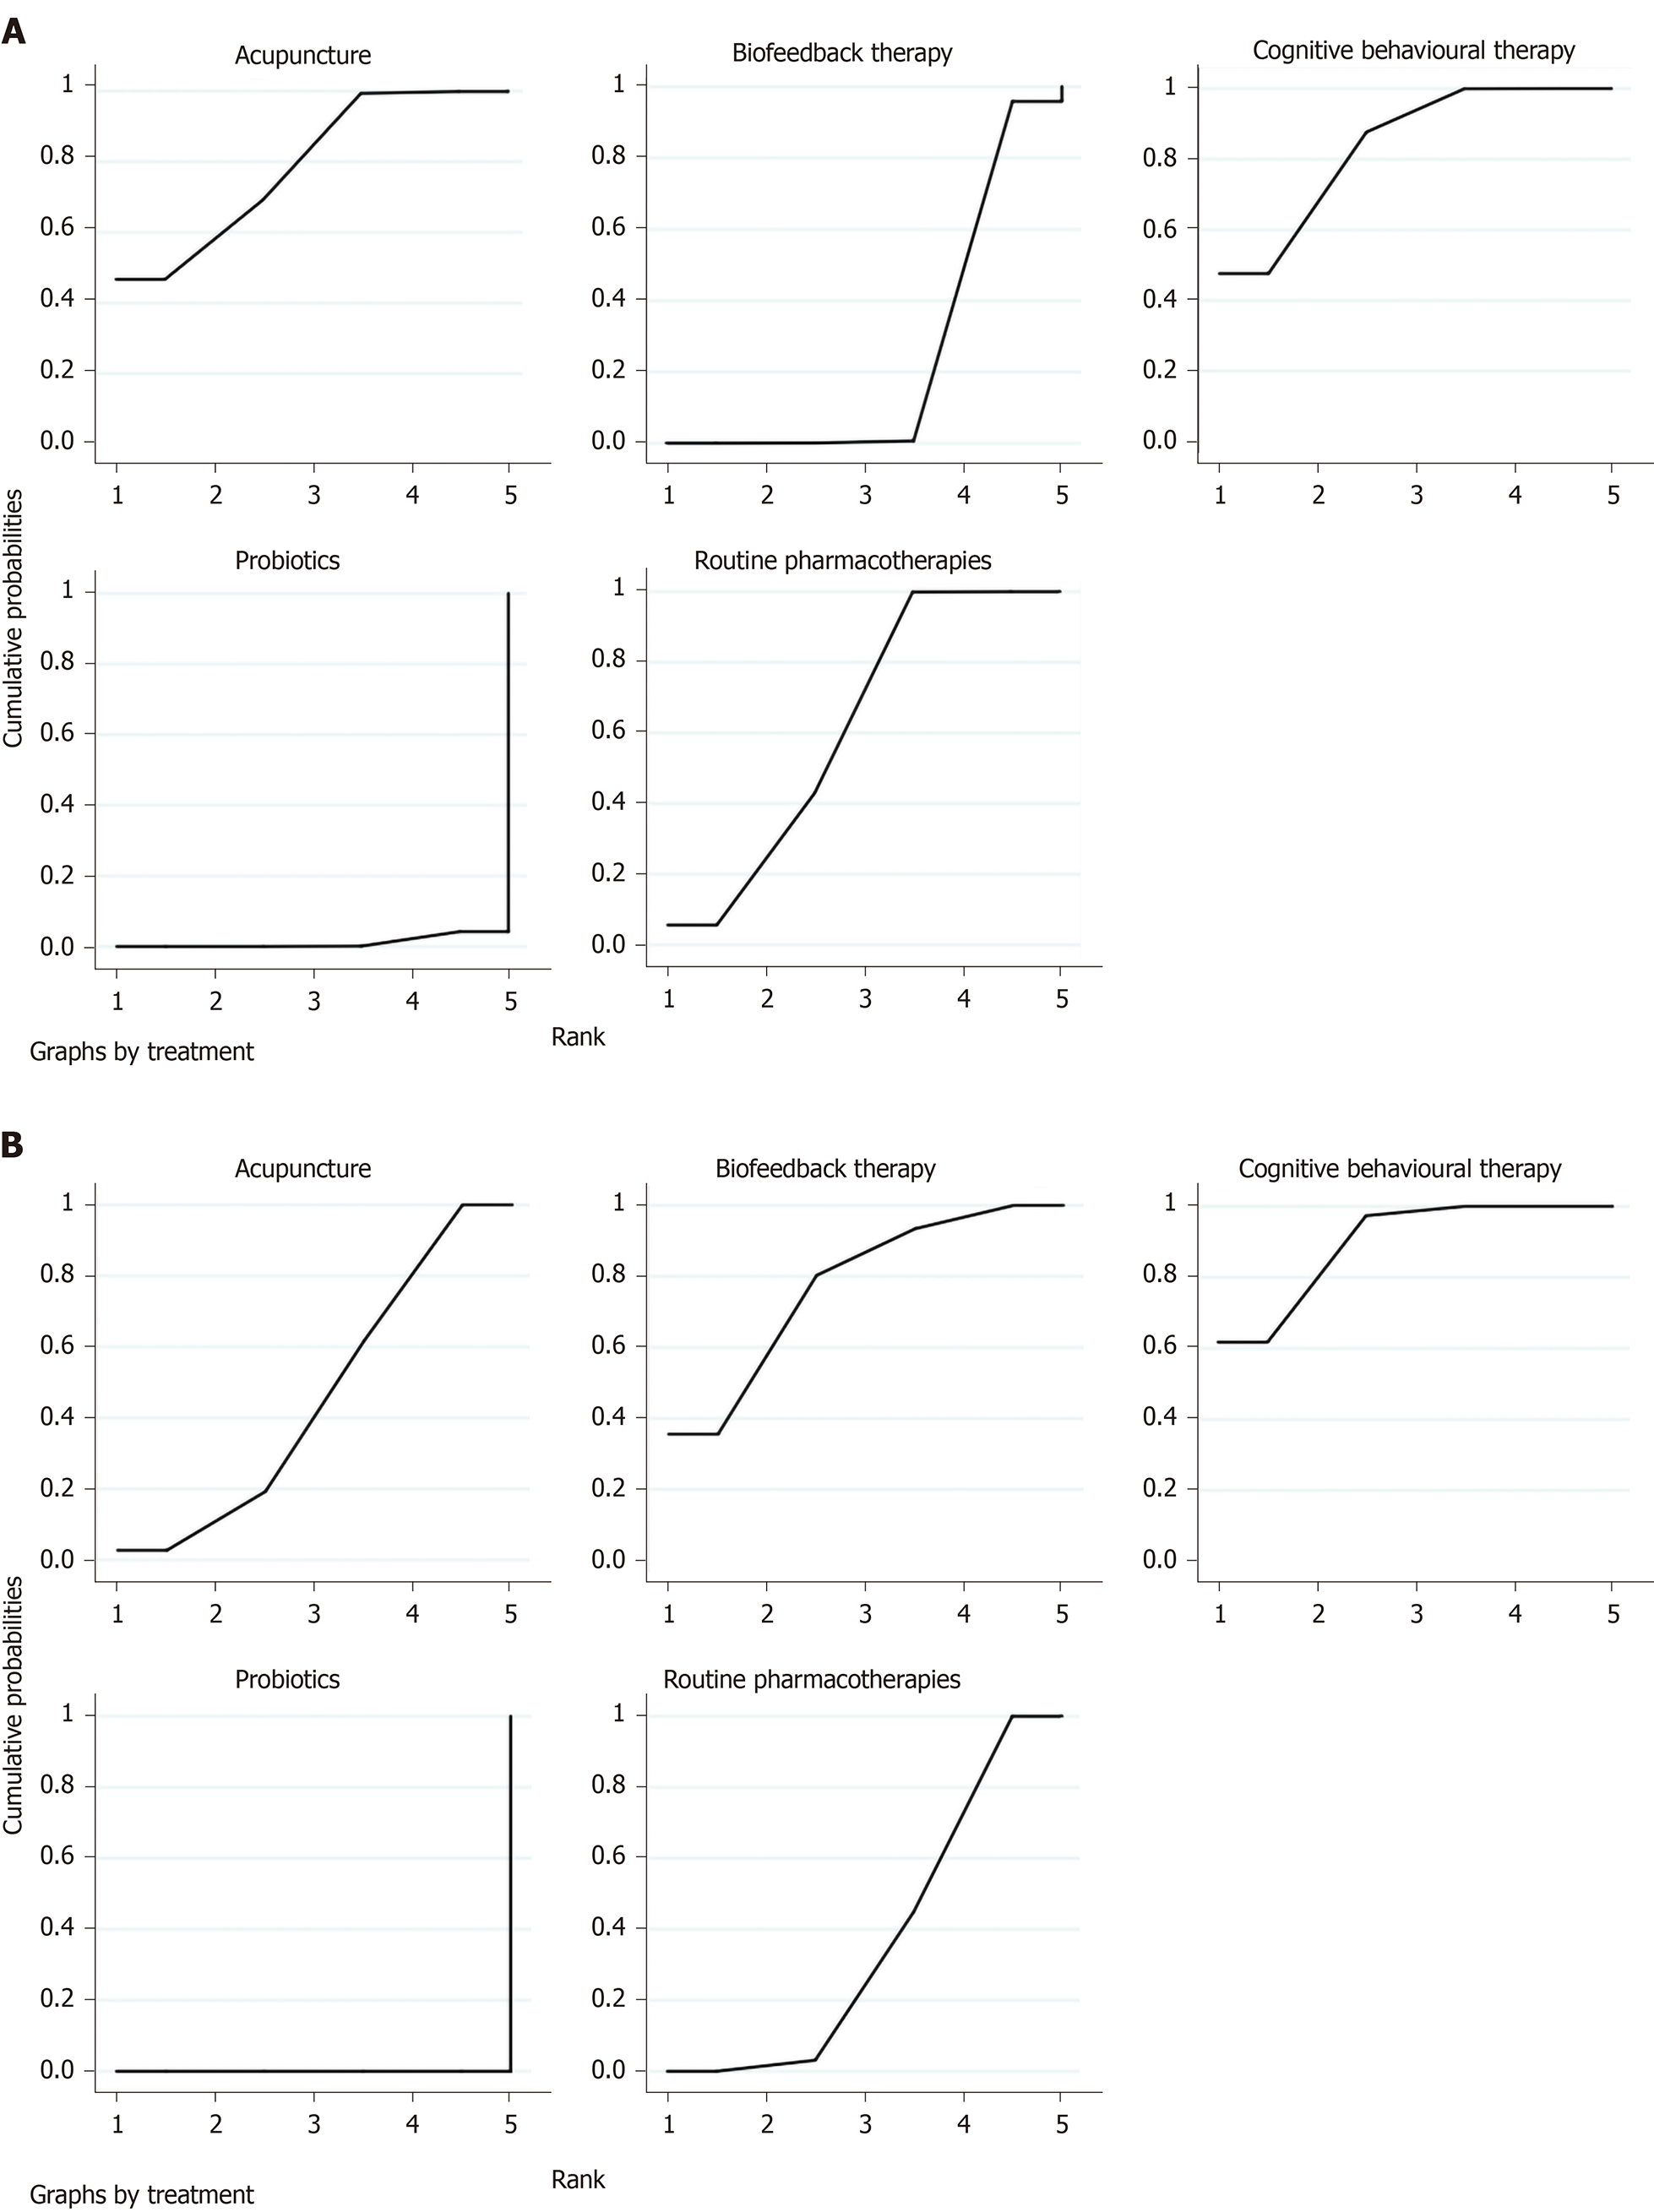
Figure 8 Surface under the cumulative ranking curve plot of self-rating anxiety scale and self-rating depression scale.
A: Self-rating anxiety scale; B: Self-rating depression scale.
Figure 9 Surface under the cumulative ranking curve plot of adverse effects.
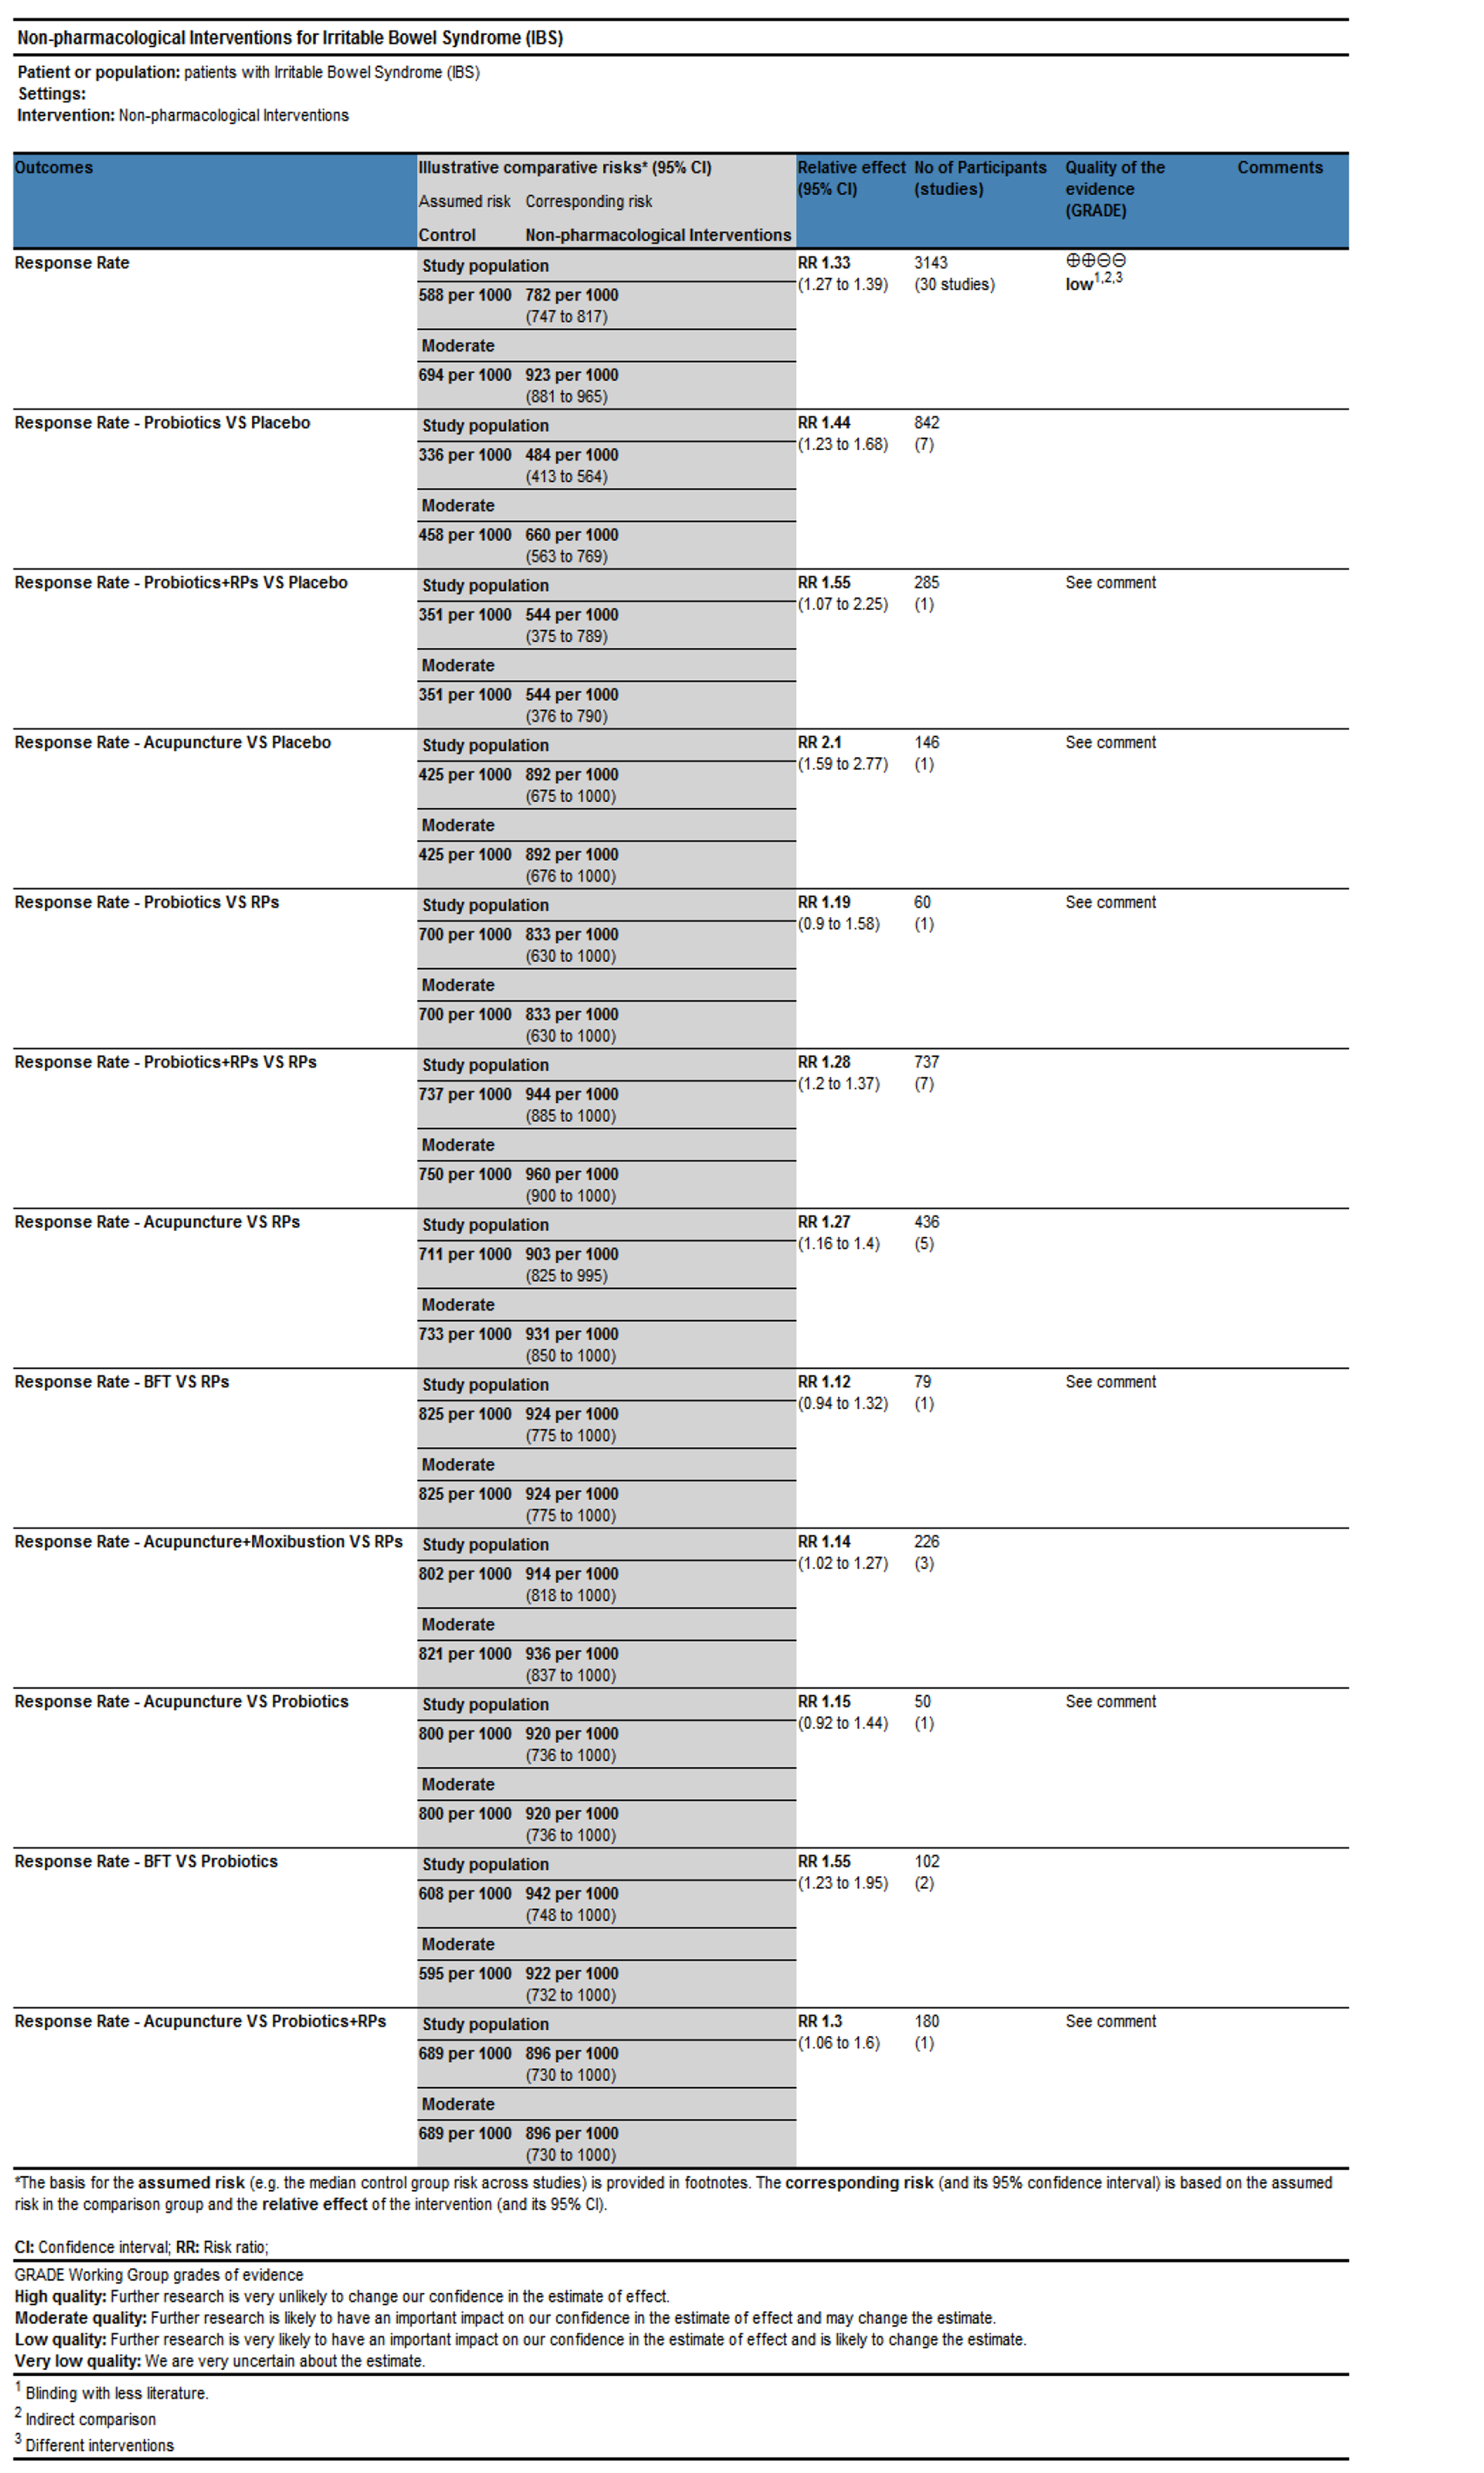
Figure 10 Grading of Recommendations Assessment, Development and Evaluation quality grading assessment.
- Citation: Dai YK, Wu YB, Li RL, Chen WJ, Tang CZ, Lu LM, Hu L. Efficacy and safety of non-pharmacological interventions for irritable bowel syndrome in adults. World J Gastroenterol 2020; 26(41): 6488-6509
- URL: https://www.wjgnet.com/1007-9327/full/v26/i41/6488.htm
- DOI: https://dx.doi.org/10.3748/wjg.v26.i41.6488


