Copyright
©The Author(s) 2020.
World J Gastroenterol. Nov 7, 2020; 26(41): 6414-6430
Published online Nov 7, 2020. doi: 10.3748/wjg.v26.i41.6414
Published online Nov 7, 2020. doi: 10.3748/wjg.v26.i41.6414
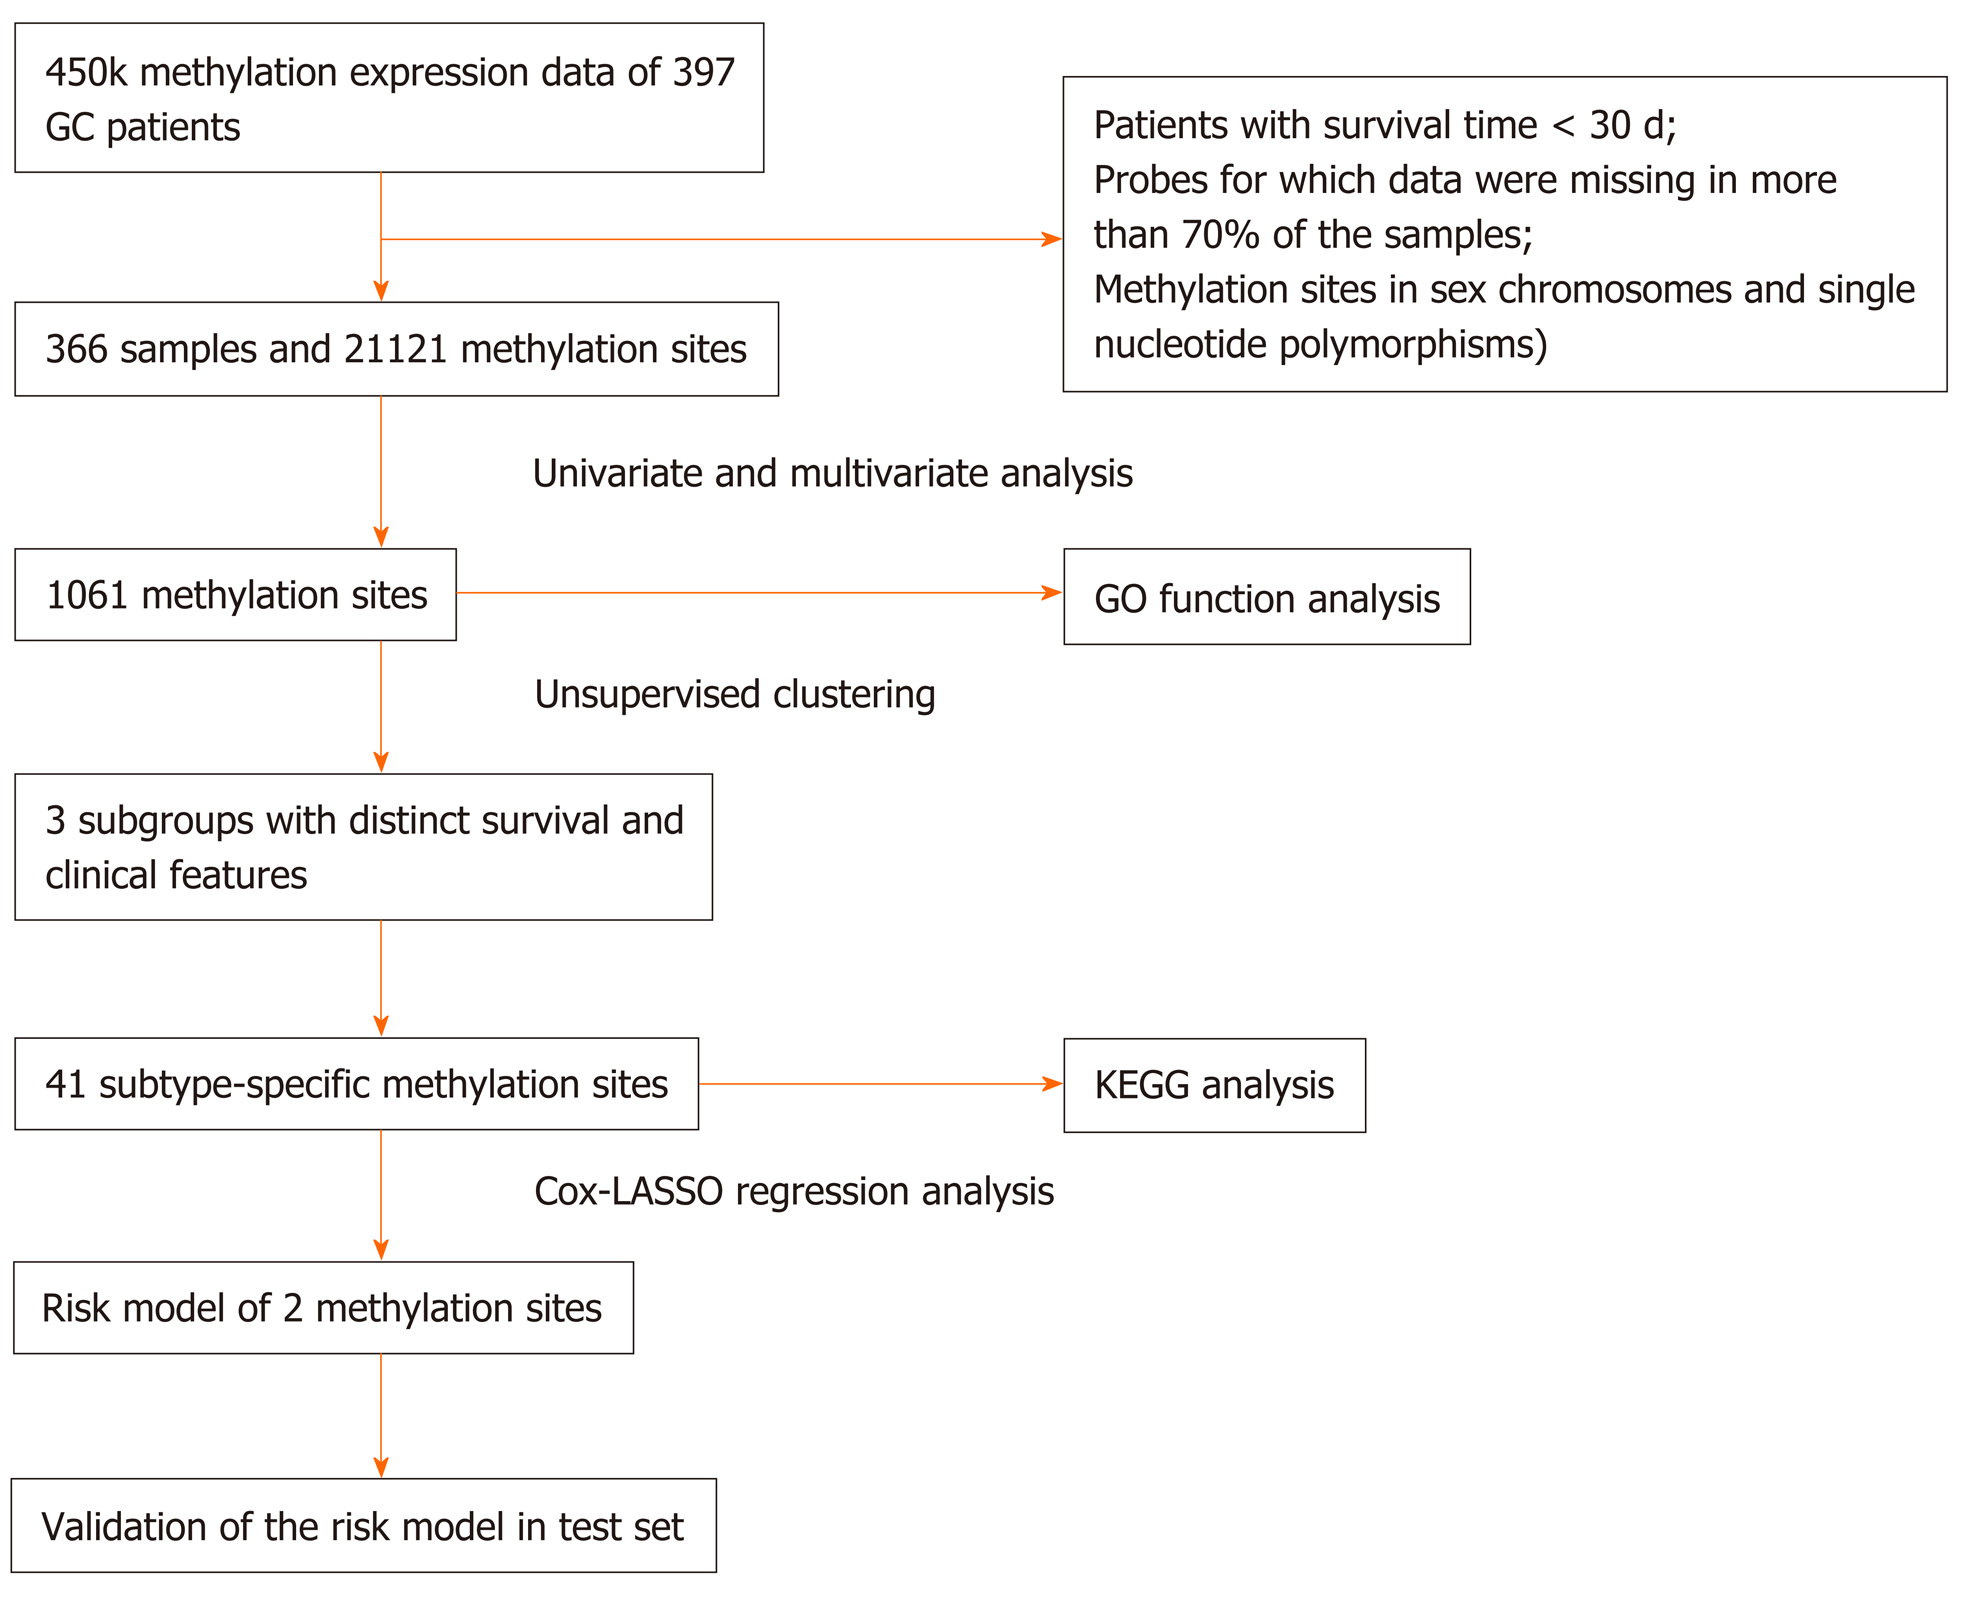
Figure 1 Flow chart of the study.
GC: Gastric cancer; LASSO: Least absolute shrinkage and selector operation; GO: Gene ontology; KEGG: Kyoto encyclopedia of genes and genomes.
Figure 2 Cluster analysis for Deoxyribonucleic acid methylation classification and the corresponding heatmap.
A: Delta area curve obtained from unsupervised clustering using 1061 Deoxyribonucleic acid methylation sites, which indicates the relative change in the area under the CDF curve for each category number k compared with k-1; B: Heatmap corresponding to the 1061 Deoxyribonucleic acid methylation sites in three clusters.
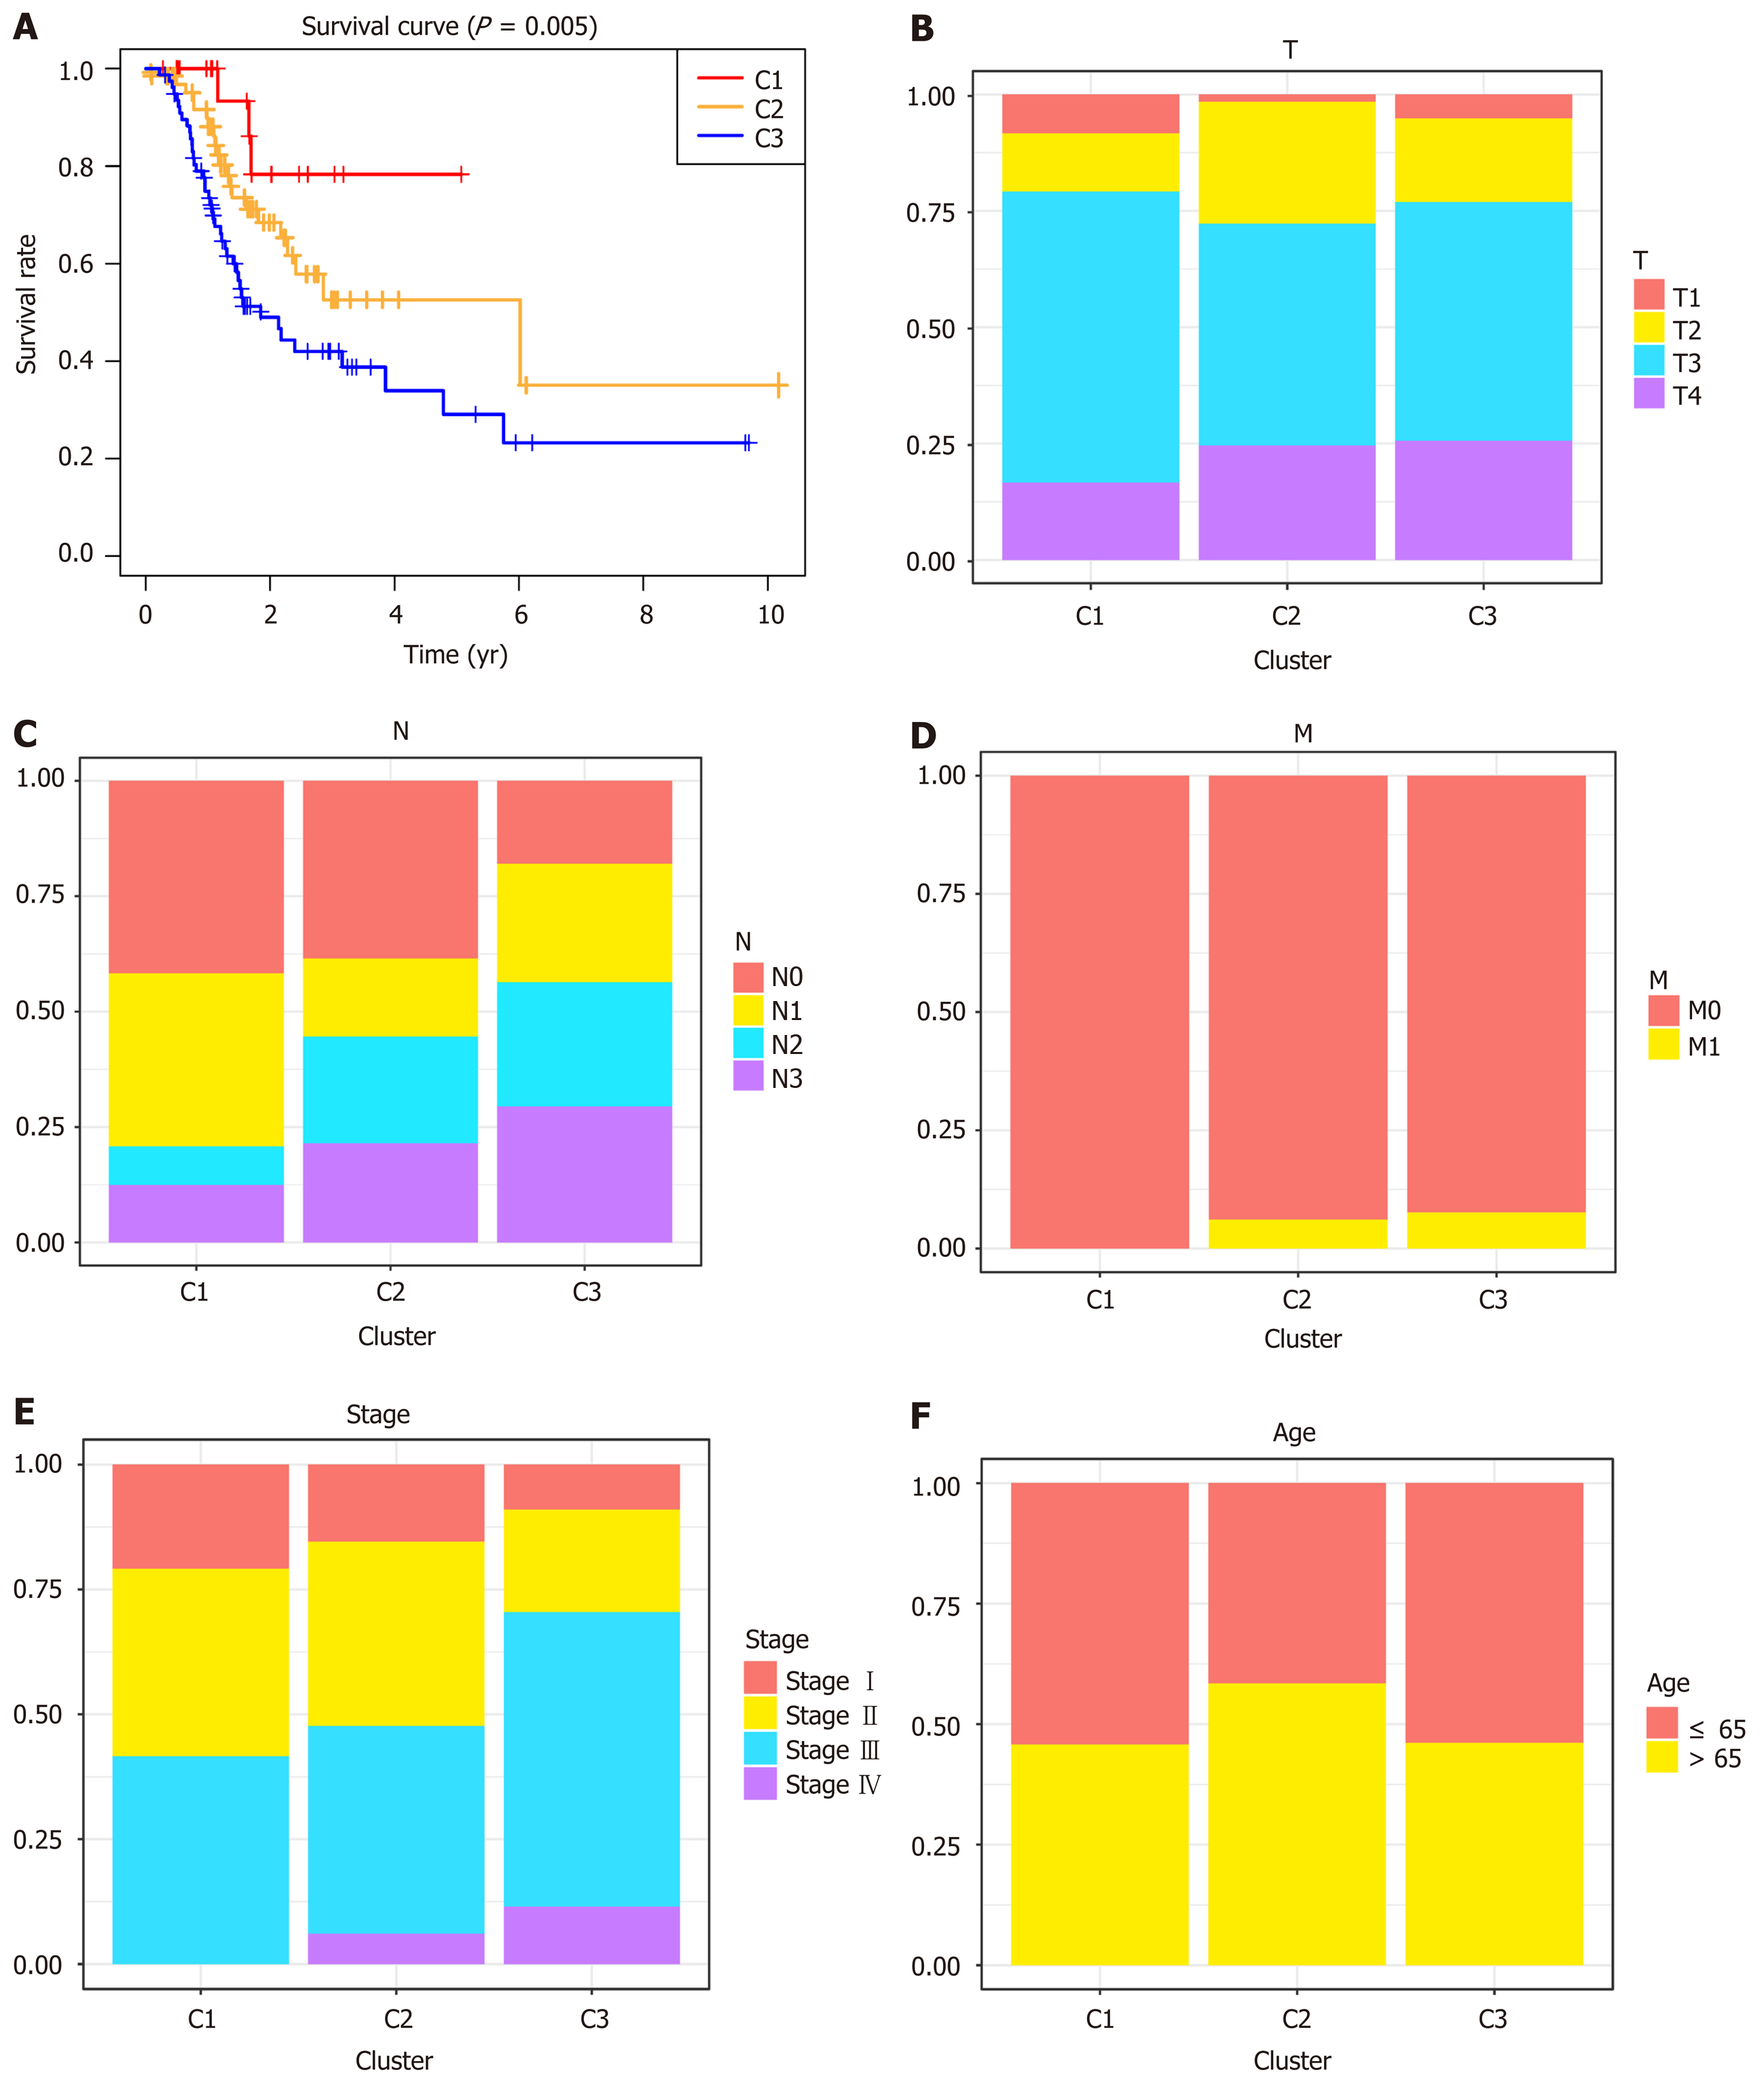
Figure 3 Survival curves of deoxyribonucleic acid methylation subtypes and comparison of TNM stage, grade, and age between clusters.
A: Survival curves of deoxyribonucleic acid (DNA) methylation subtypes in the training set; B: The size and extent of the main tumor; C: Lymph nodes invasion; D: Metastasis; E: TNM stage score; F: Age distributions for each DNA methylation subtype in the training set. The horizontal axis indicates the DNA methylation clusters.
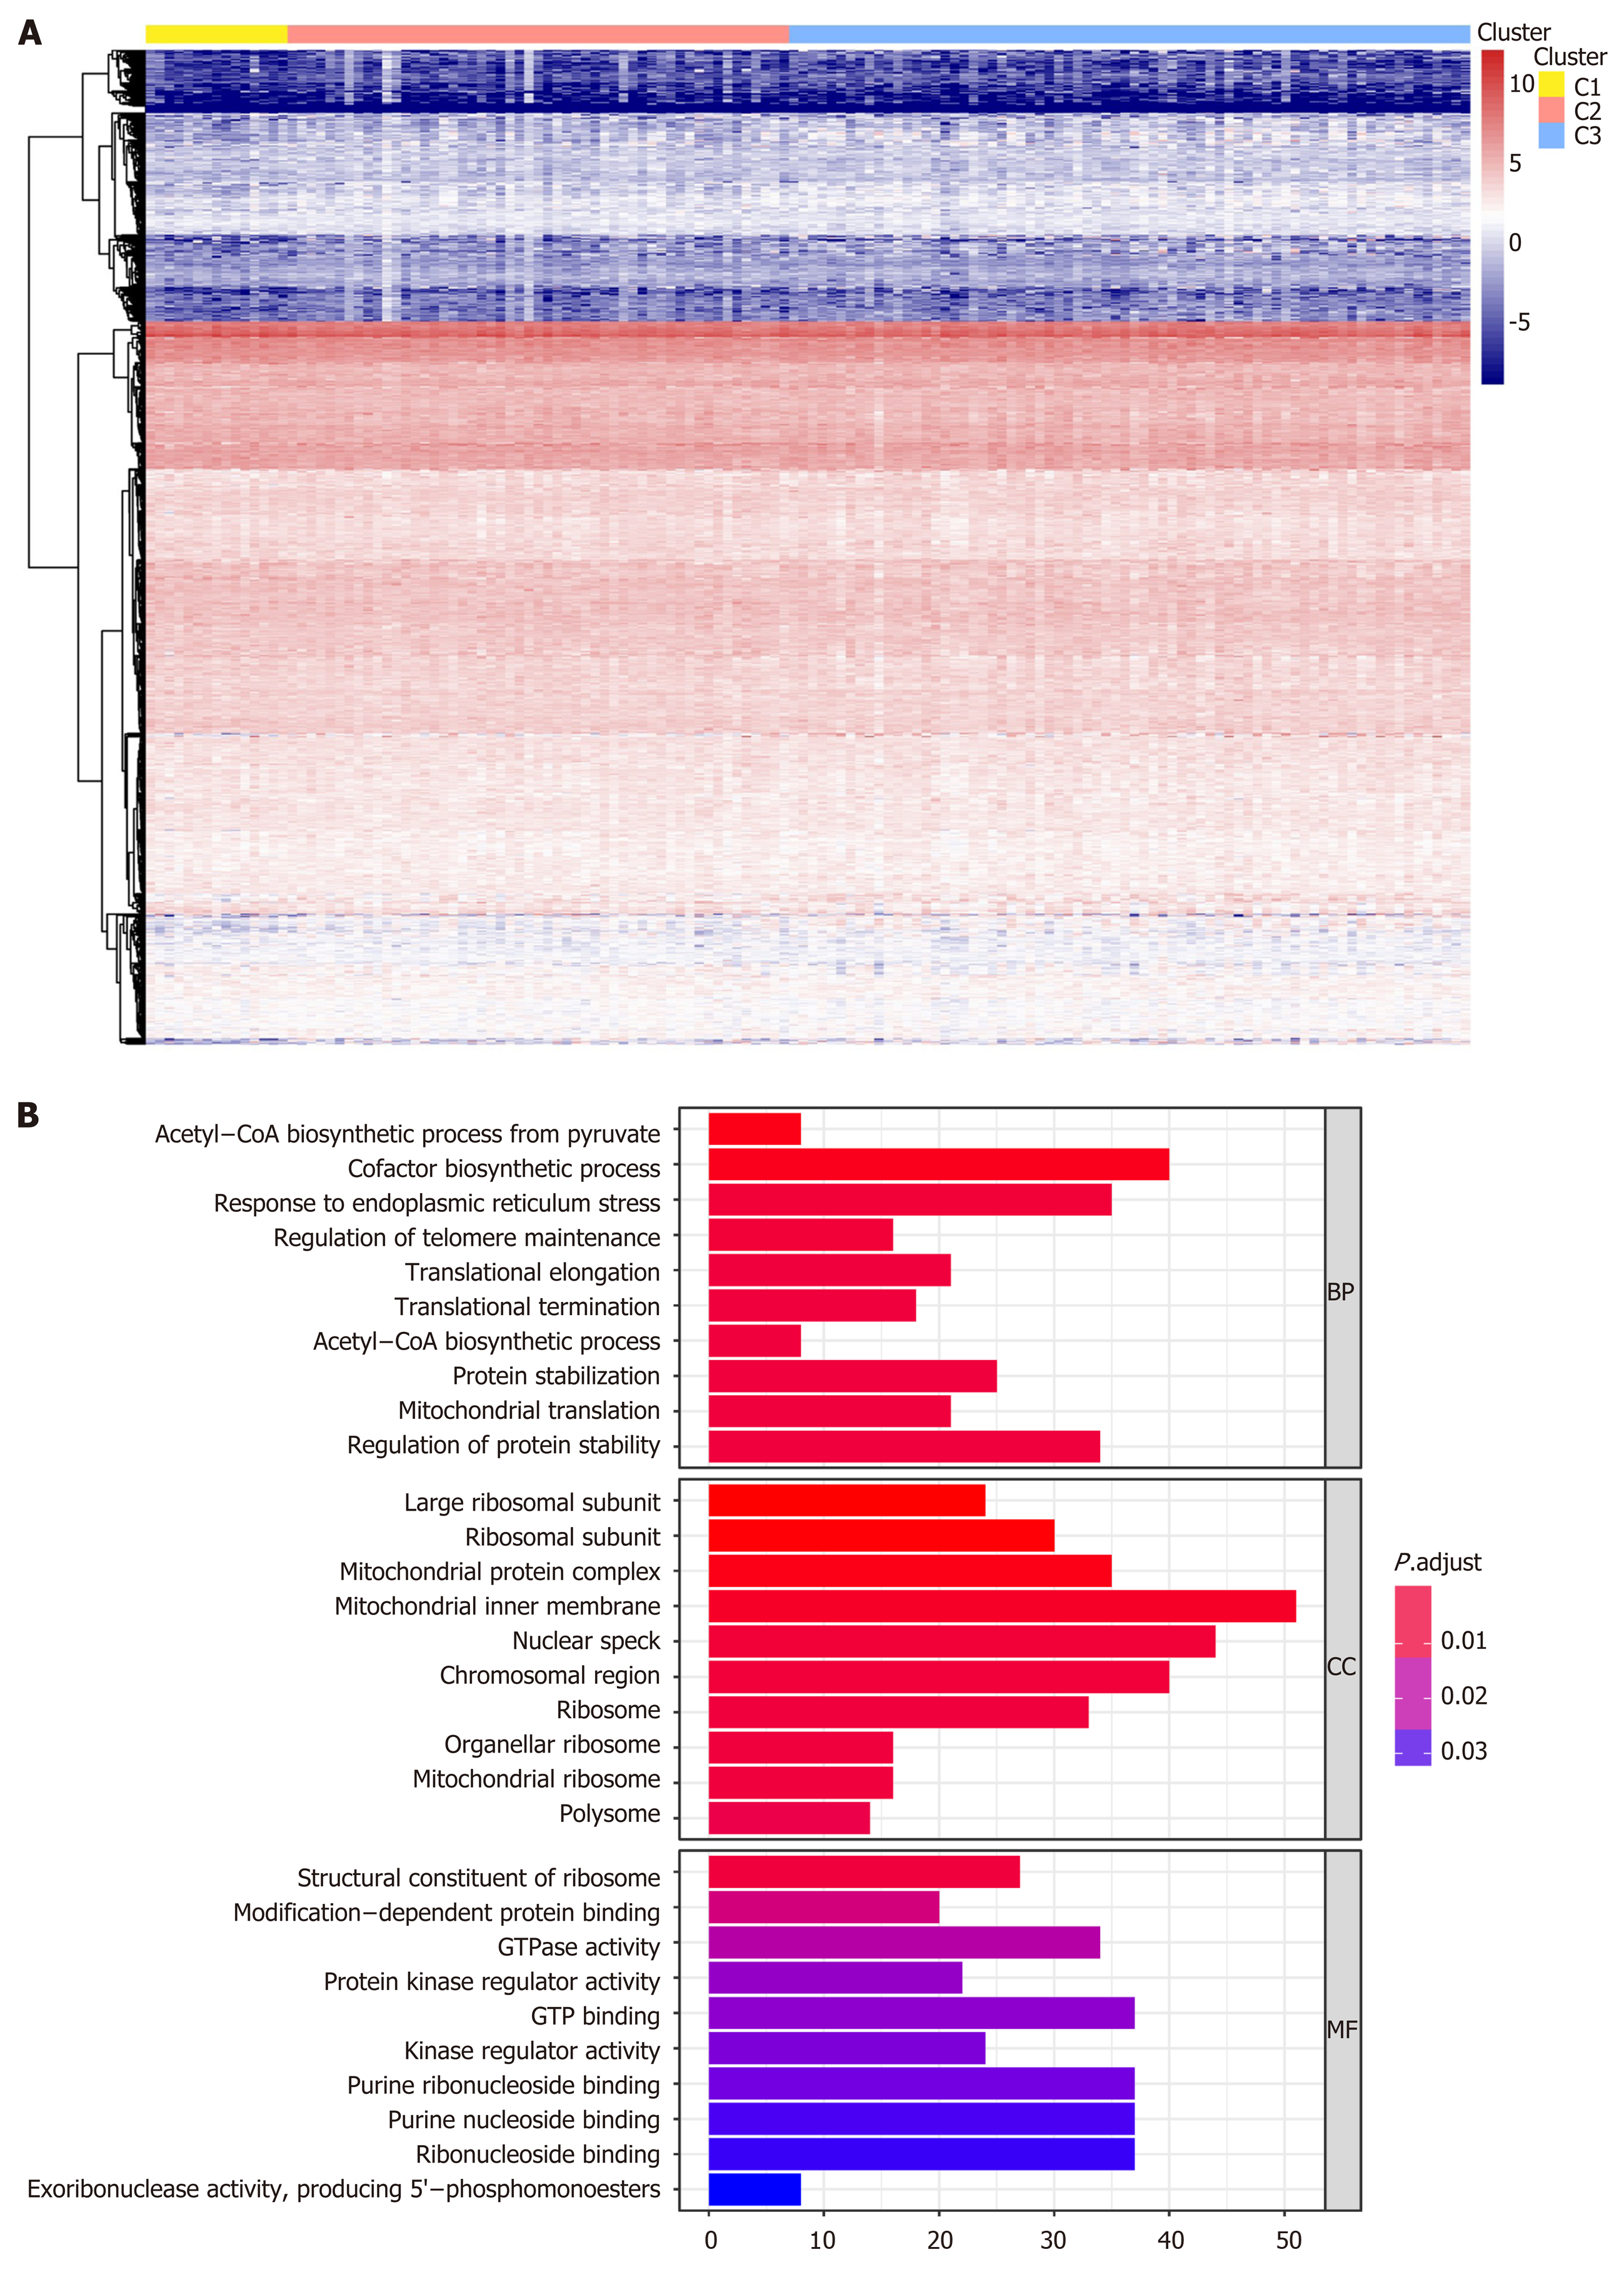
Figure 4 Gene annotations of 1061 methylated sites.
A: Cluster analysis heatmap for annotated genes associated with the 1061 CpG sites; B: Gene ontology enrichment analysis of the annotated genes.
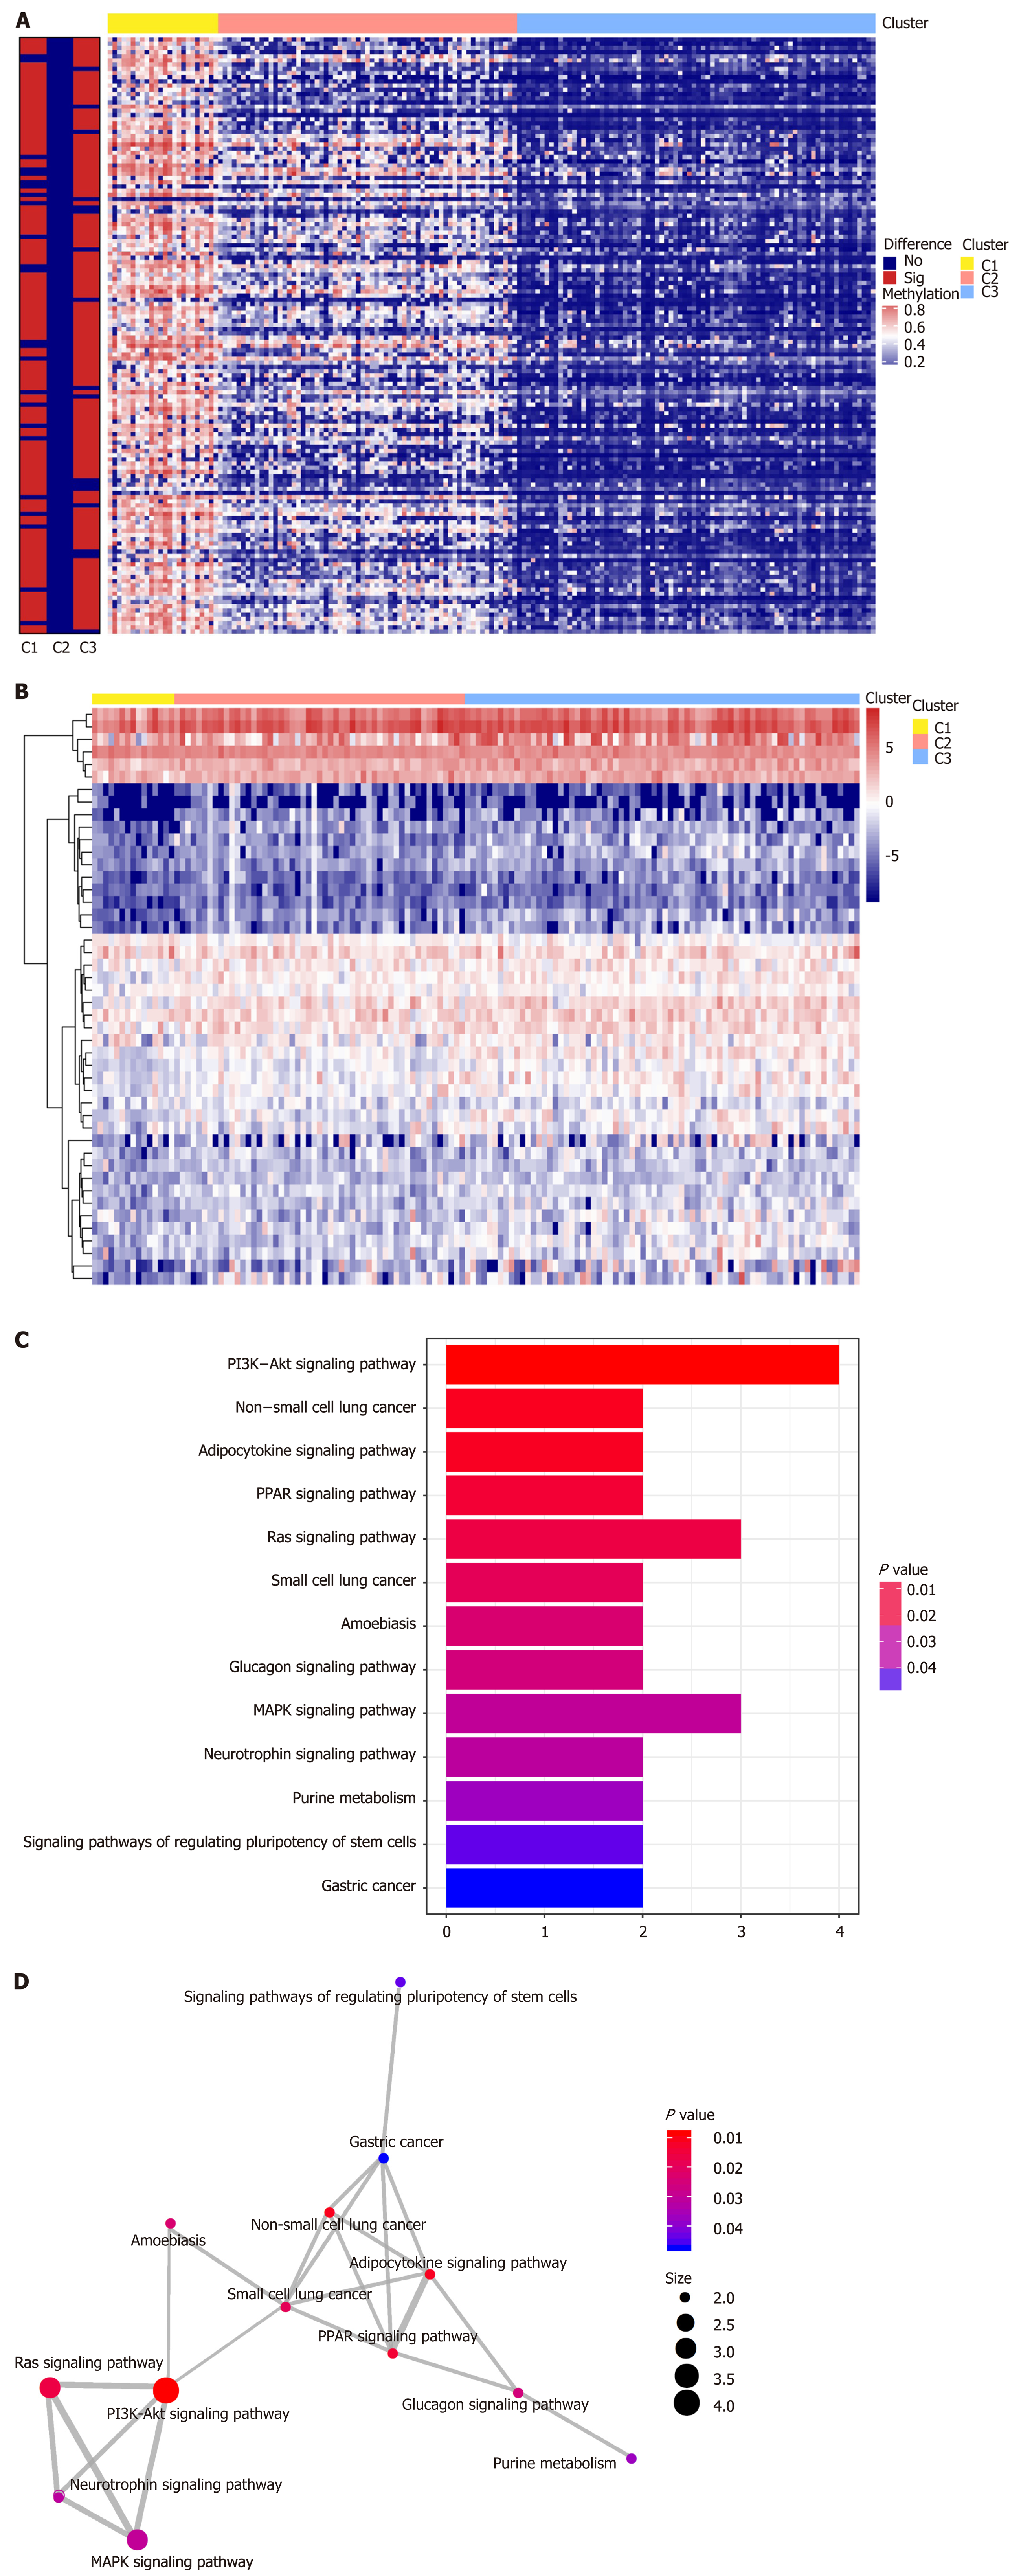
Figure 5 Differential analysis of CpG sites for each deoxyribonucleic acid methylation subtype.
A: The red and blue bars represent hypermethylated CpG sites and hypomethylated CpG sites, respectively (FDR < 0.05 and |log2 (fold change [FC])| > 1). The vertical bar to the left of the heatmap indicates the significance of methylation sites in each cluster, with the red and blue bars representing significance and insignificance, respectively; B: Heatmap for the annotated genes of specific sites among three Deoxyribonucleic acid methylation clusters; C: Kyoto encyclopedia of genes and genomes pathway enrichment analysis of the specific methylation sites; D: Crosstalk analysis of the enriched Kyoto encyclopedia of genes and genomes pathways shown in the enrichment map.
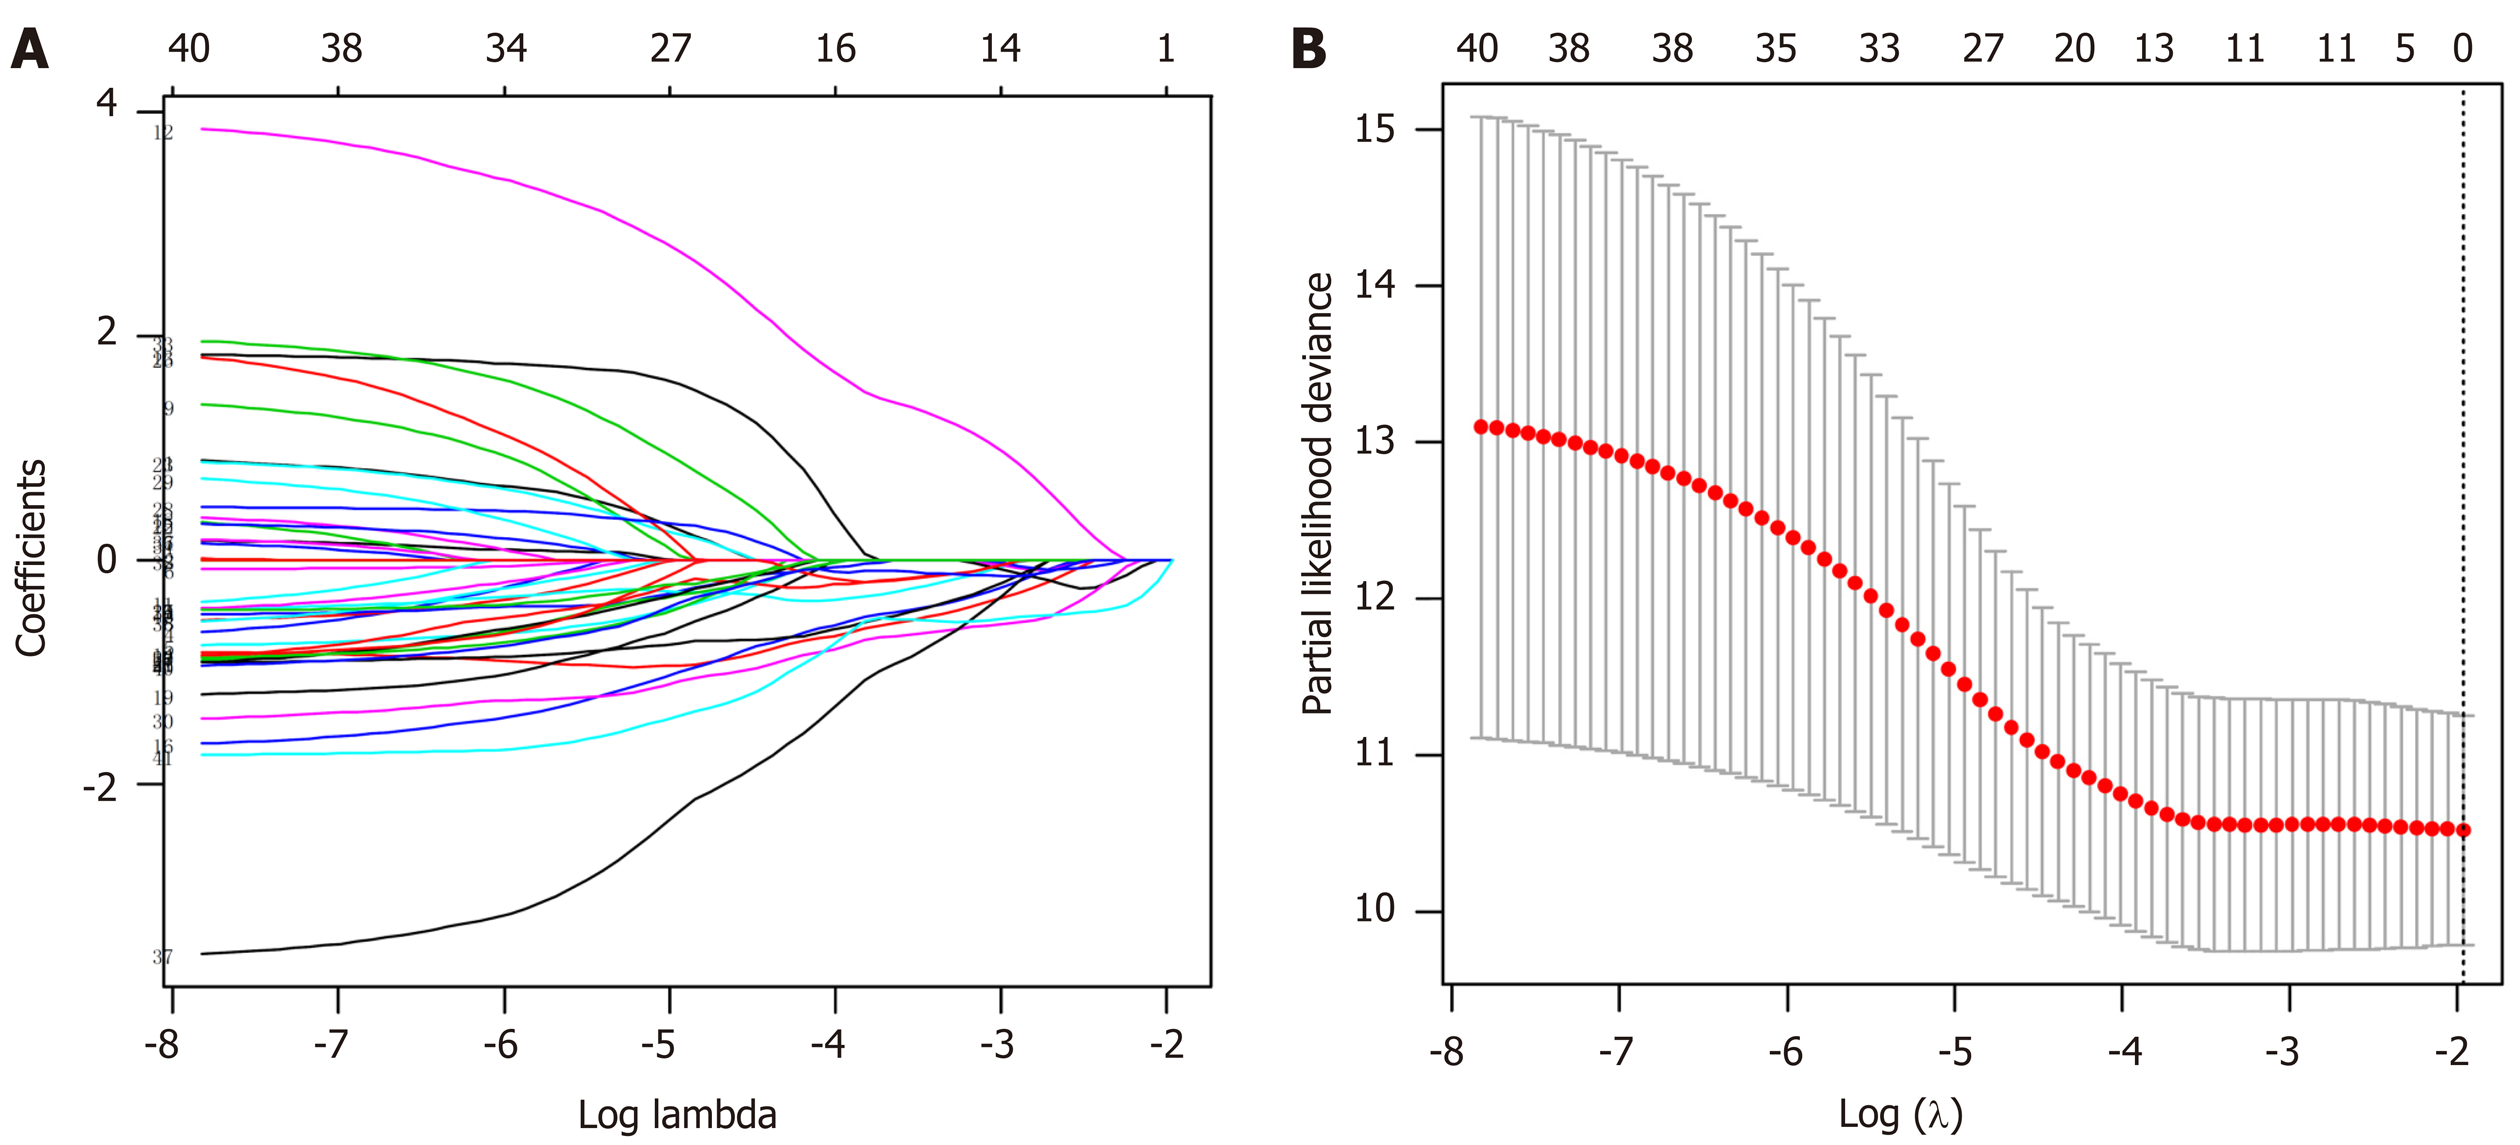
Figure 6 Selection of the prognostic methylation sites for gastric cancer patients by least absolute shrinkage and selection operator analysis.
A: The changing trajectory of each independent variable. The horizontal axis represents the log value of the independent variable lambda and the vertical axis represents the coefficient of the independent variable; B: Confidence intervals for each lambda. The optimal values of the penalty parameter lambda were determined by ten-fold cross-validation.
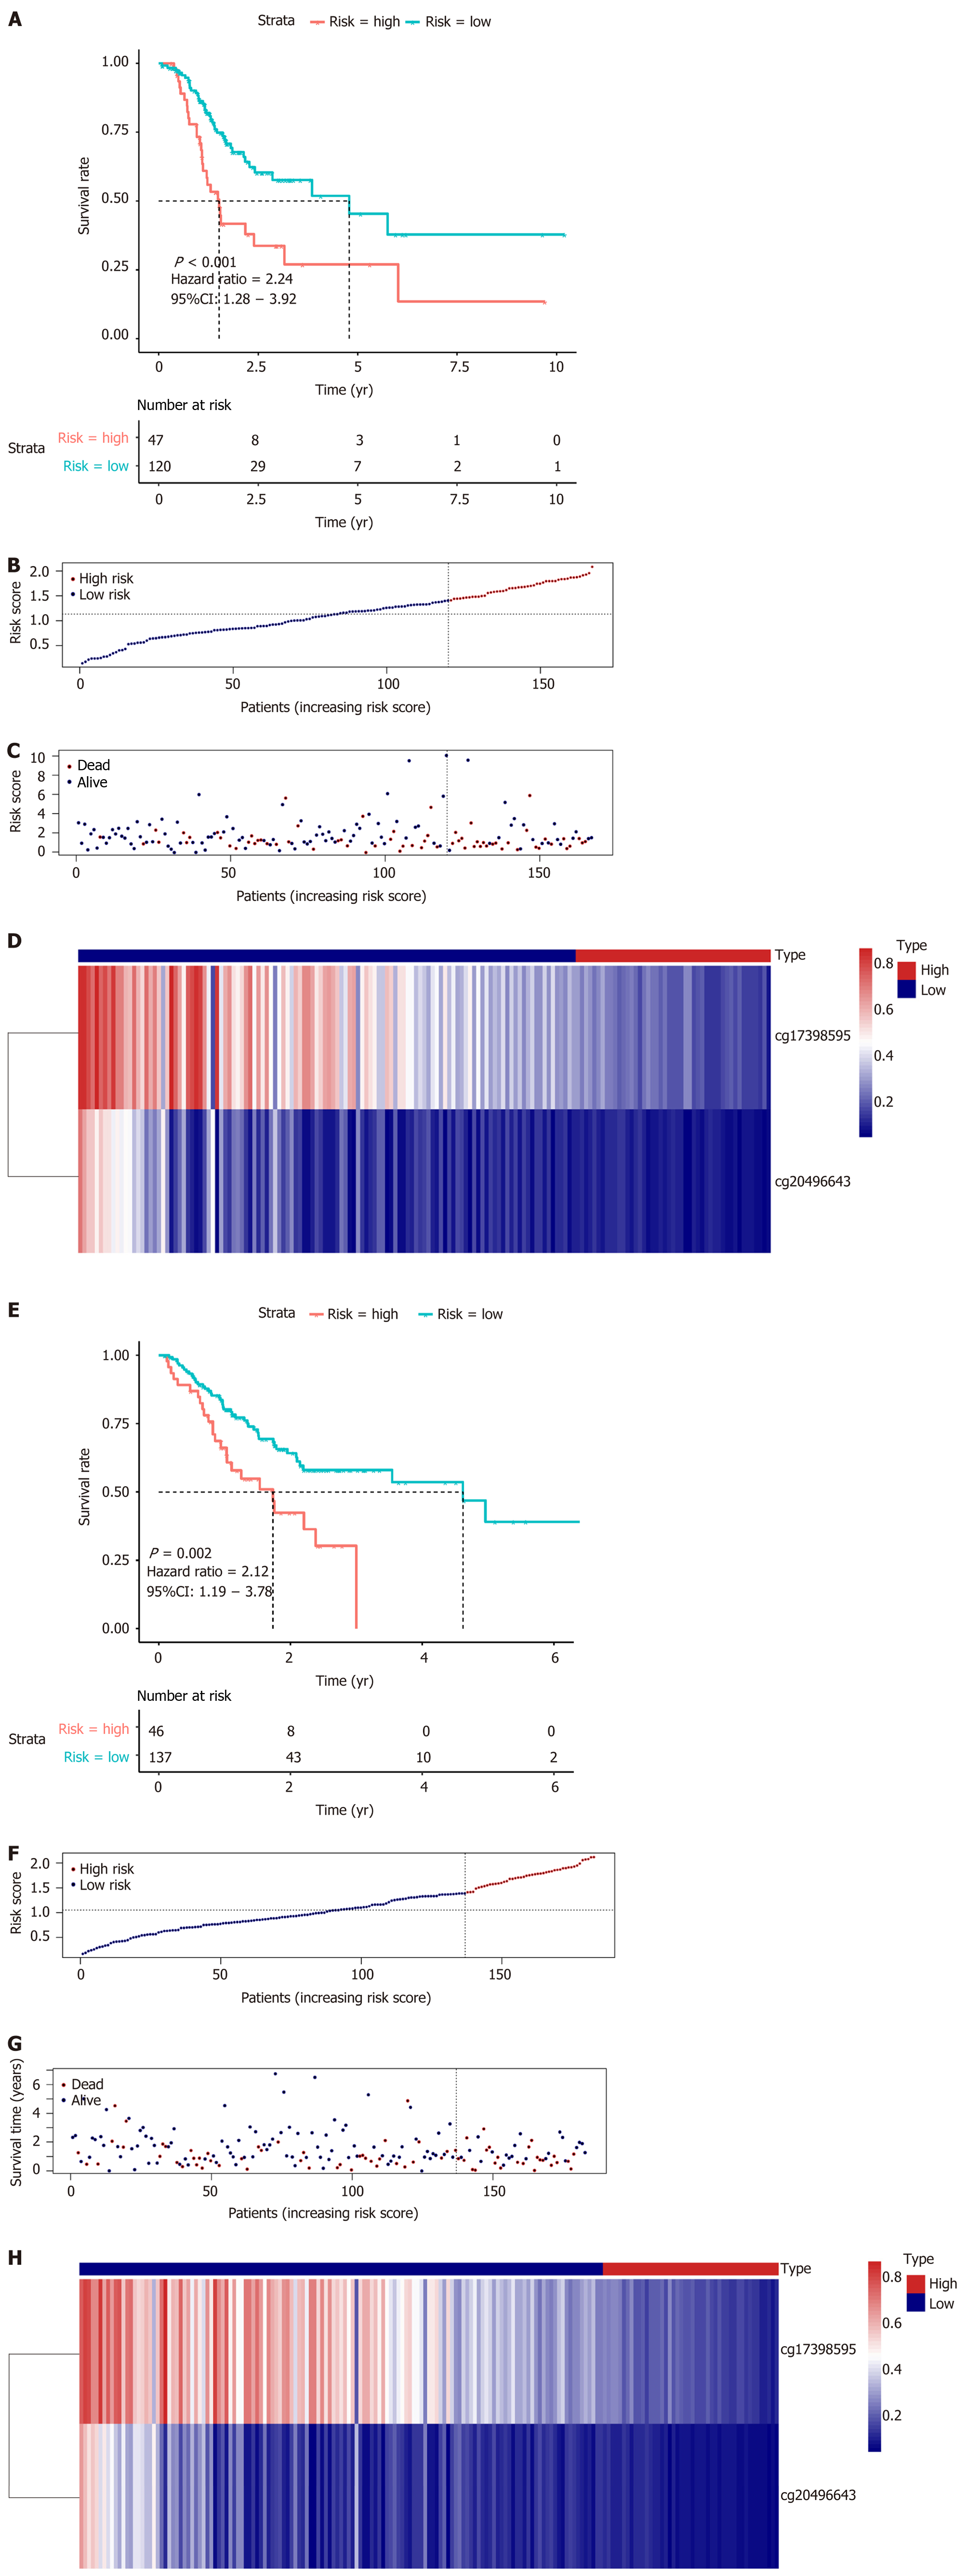
Figure 7 Survival analysis and risk score distribution of the prognostic model for the training and test sets.
A and E: K-M curves of the prognostic model in the training set and test set, respectively; B-D: The risk score distribution and heatmap of the methylation site profiles in the training set; F-H: The risk score distribution and heatmap of the methylation site profiles in the test set.
- Citation: Bian J, Long JY, Yang X, Yang XB, Xu YY, Lu X, Sang XT, Zhao HT. Signature based on molecular subtypes of deoxyribonucleic acid methylation predicts overall survival in gastric cancer. World J Gastroenterol 2020; 26(41): 6414-6430
- URL: https://www.wjgnet.com/1007-9327/full/v26/i41/6414.htm
- DOI: https://dx.doi.org/10.3748/wjg.v26.i41.6414


