Copyright
©The Author(s) 2020.
World J Gastroenterol. Nov 7, 2020; 26(41): 6378-6390
Published online Nov 7, 2020. doi: 10.3748/wjg.v26.i41.6378
Published online Nov 7, 2020. doi: 10.3748/wjg.v26.i41.6378
Figure 1 Sequencing map of macrophage inhibitory factor-1 gene polymorphic loci.
Figure 2 Comparison of the macrophage inhibitory factor-1 level among different genotypes at rs1059519 locus.
The macrophage inhibitory factor-1 (MIC-1) levels of various genotypes at rs1059519 locus were as follows: For genotype CC, n = 33, M = 265.10, P5 = 117.45, P95 = 1271.05; for genotype CG, n = 99, M = 344.40, P5 = 146.40, P95 = 1373.30; and for genotype GG, n = 128, M = 401.65, P5 = 175.41, P95 = 1170.86. The rank-sum tests of various independent samples showed that statistically significant difference was observed in the MIC-1 level for different genotypes (χ2 = 10.183, P = 0.006), and GG genotype was significantly higher than CC genotype (bP = 0.009).
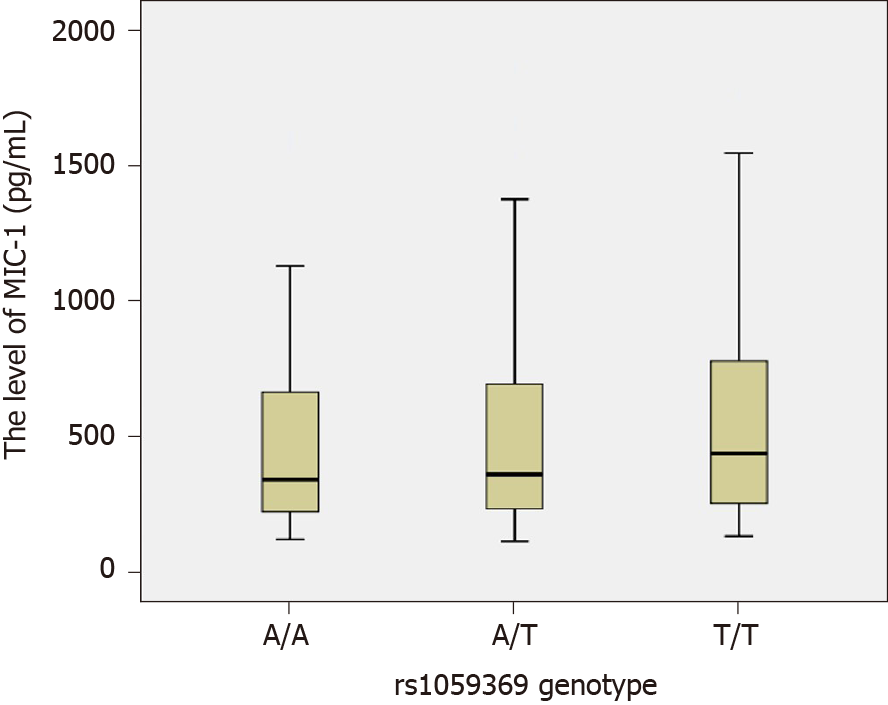
Figure 3 Comparison of the macrophage inhibitory factor-1 level among different genotypes at rs1059369 locus.
The macrophage inhibitory factor-1 (MIC-1) levels of various genotypes at rs1059369 locus were as follows: for genotype AA, n = 90, M = 342.50, P5 = 158.09, P95 = 1096.12; for genotype AT, n = 127, M = 362.20, P5 = 146.76, P95 = 1194.38; and for genotype TT, n = 43, M = 438.80, P5 = 172.38, P95 = 1520.06. The rank-sum tests of various independent samples showed that no statistically significant difference was observed in the MIC-1 level for different genotypes (χ2 = 1.707, P = 0.426).
- Citation: Yang XJ, Wang XO, Chen Y, Ye SD. Associations of content and gene polymorphism of macrophage inhibitory factor-1 and chronic hepatitis C virus infection. World J Gastroenterol 2020; 26(41): 6378-6390
- URL: https://www.wjgnet.com/1007-9327/full/v26/i41/6378.htm
- DOI: https://dx.doi.org/10.3748/wjg.v26.i41.6378


