Copyright
©The Author(s) 2020.
World J Gastroenterol. Oct 21, 2020; 26(39): 5983-5996
Published online Oct 21, 2020. doi: 10.3748/wjg.v26.i39.5983
Published online Oct 21, 2020. doi: 10.3748/wjg.v26.i39.5983
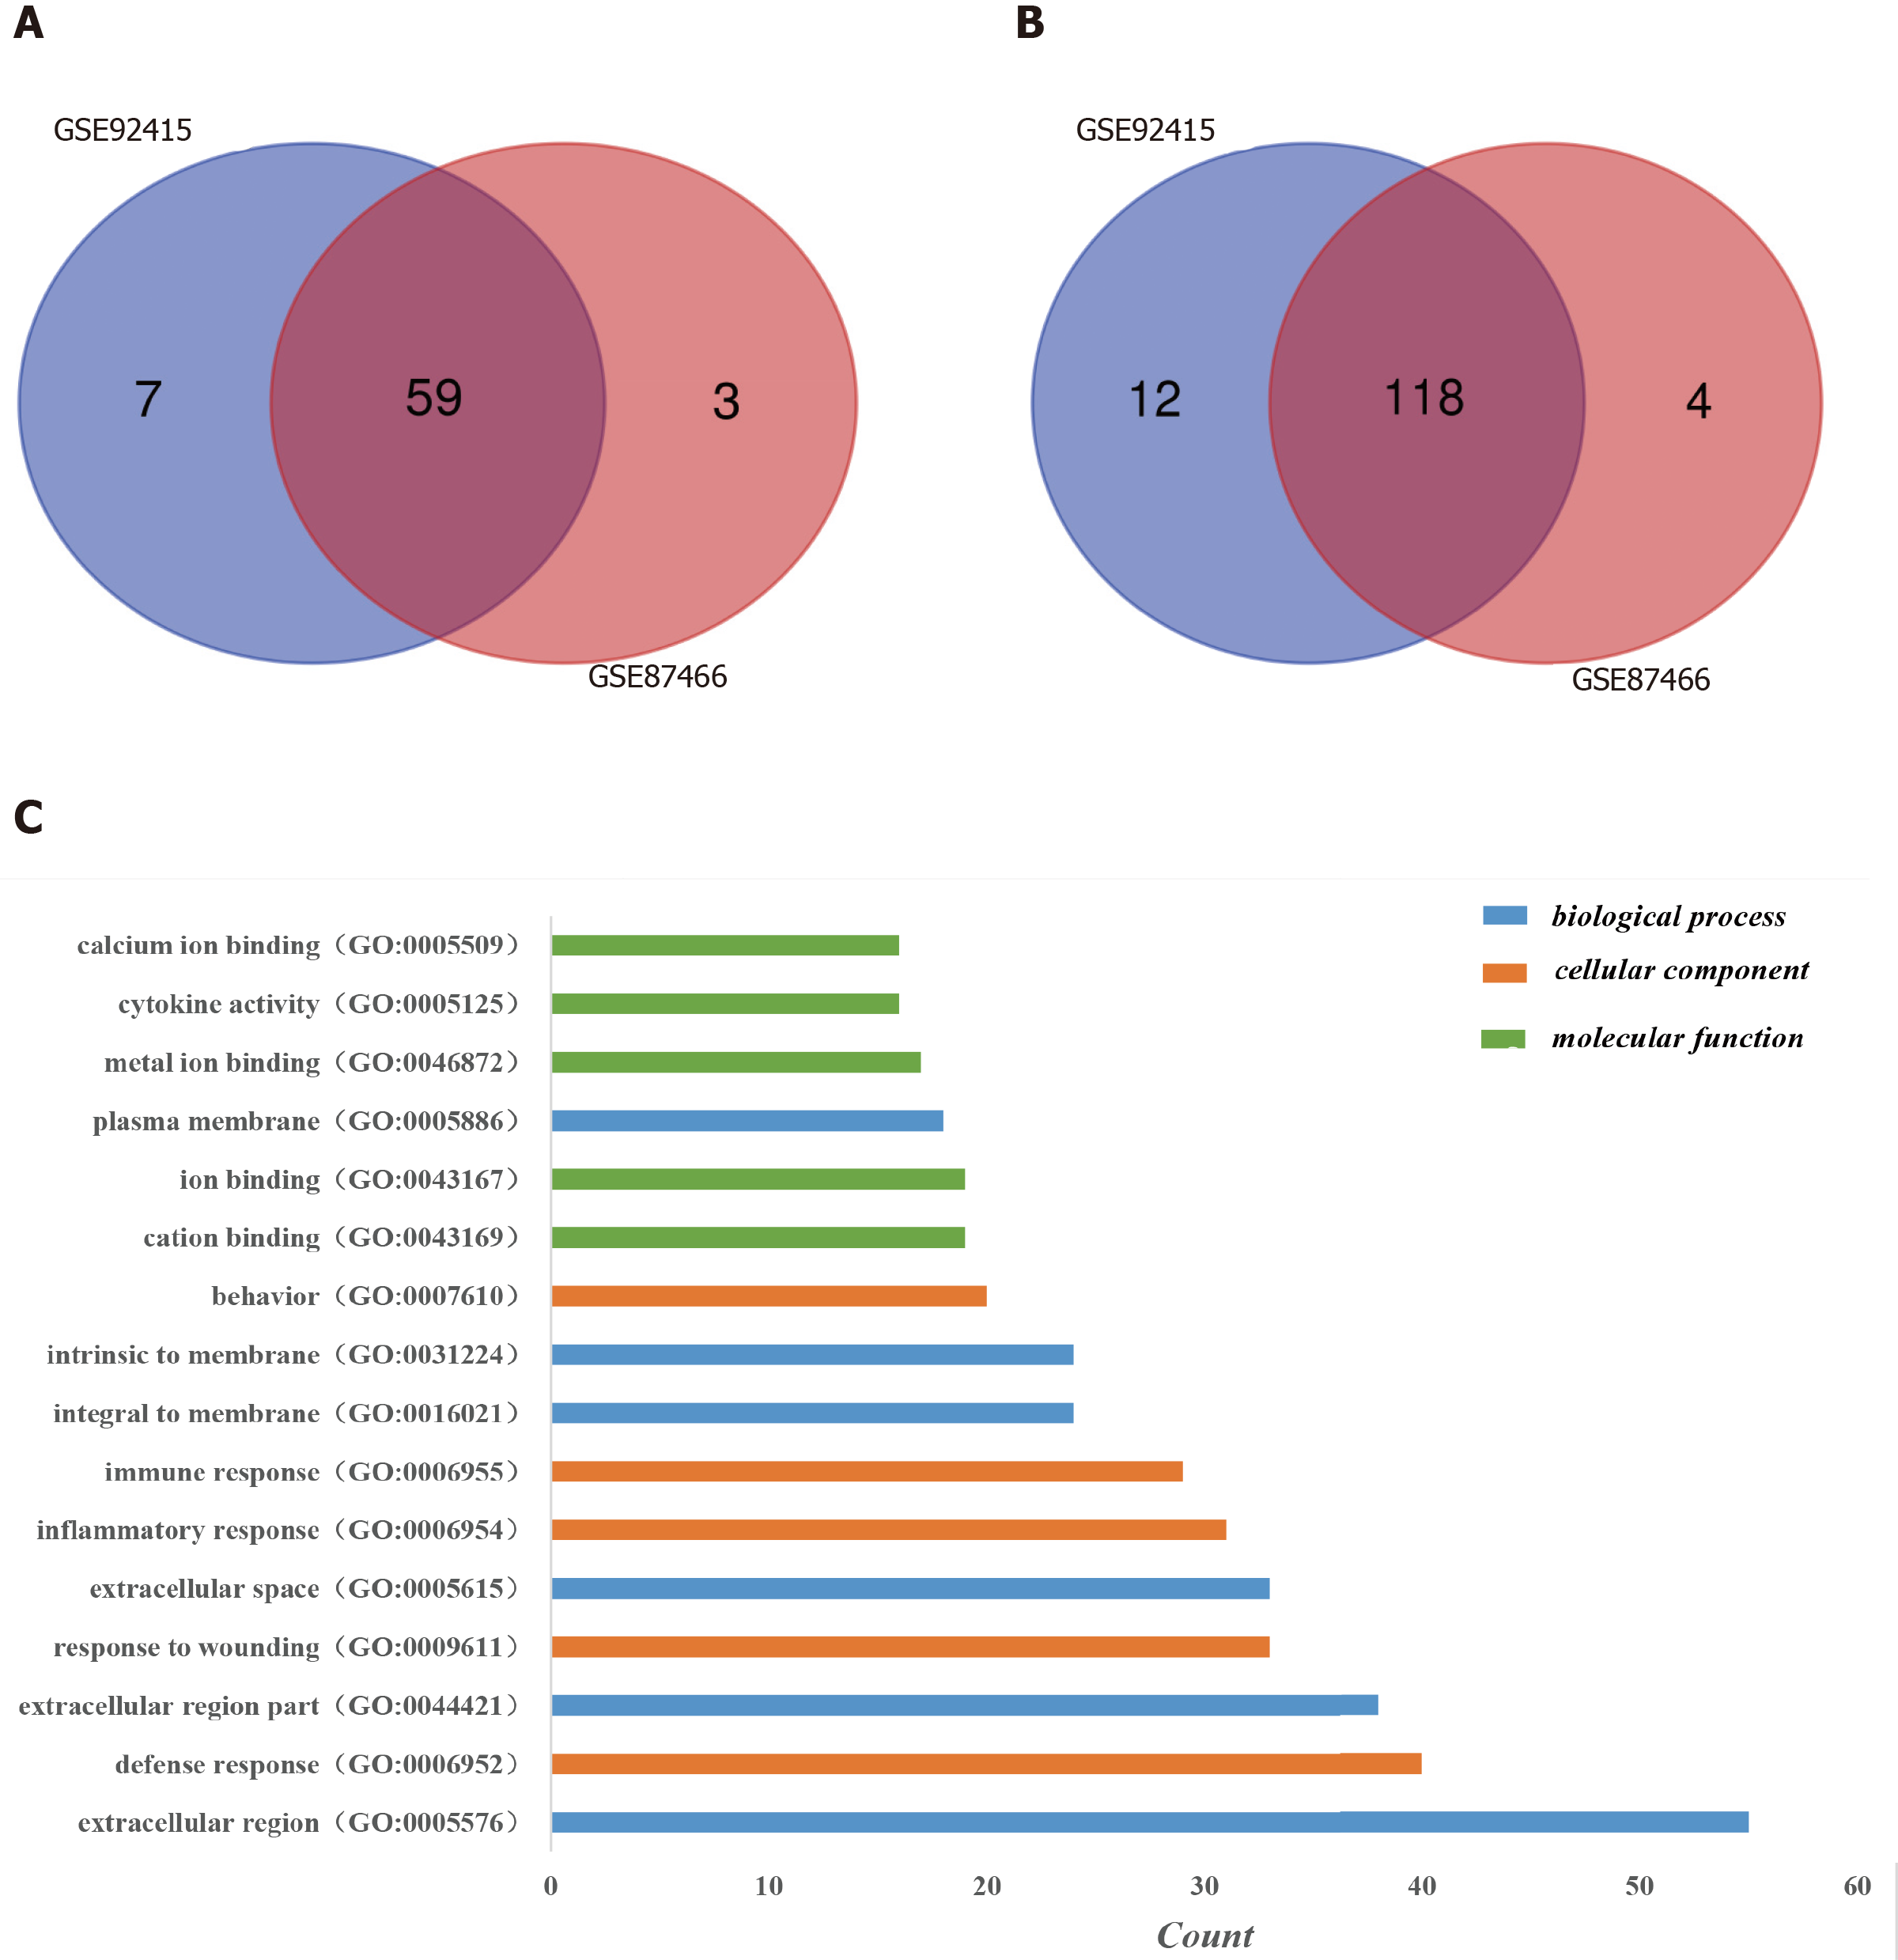
Figure 1 Identification of differentially expressed genes in the two databases (GSE92415 and GSE87466) and Gene Ontology analysis of differentially expressed genes in ulcerative colitis.
A: Upregulated differentially expressed genes (DEGs); B: Downregulated DEGs. DEGs were identified with a t-test, and statistically significant DEGs were defined by the GEO2R online tool with a |logFC| > 2 and adjusted P value < 0.05; C: The Gene Ontology analysis classified the DEGs into three groups: Molecular function, biological process and cellular component. Terms were selected with > 15 genes and arrayed in ascending order from top to bottom according to the count. GO: Gene Ontology.
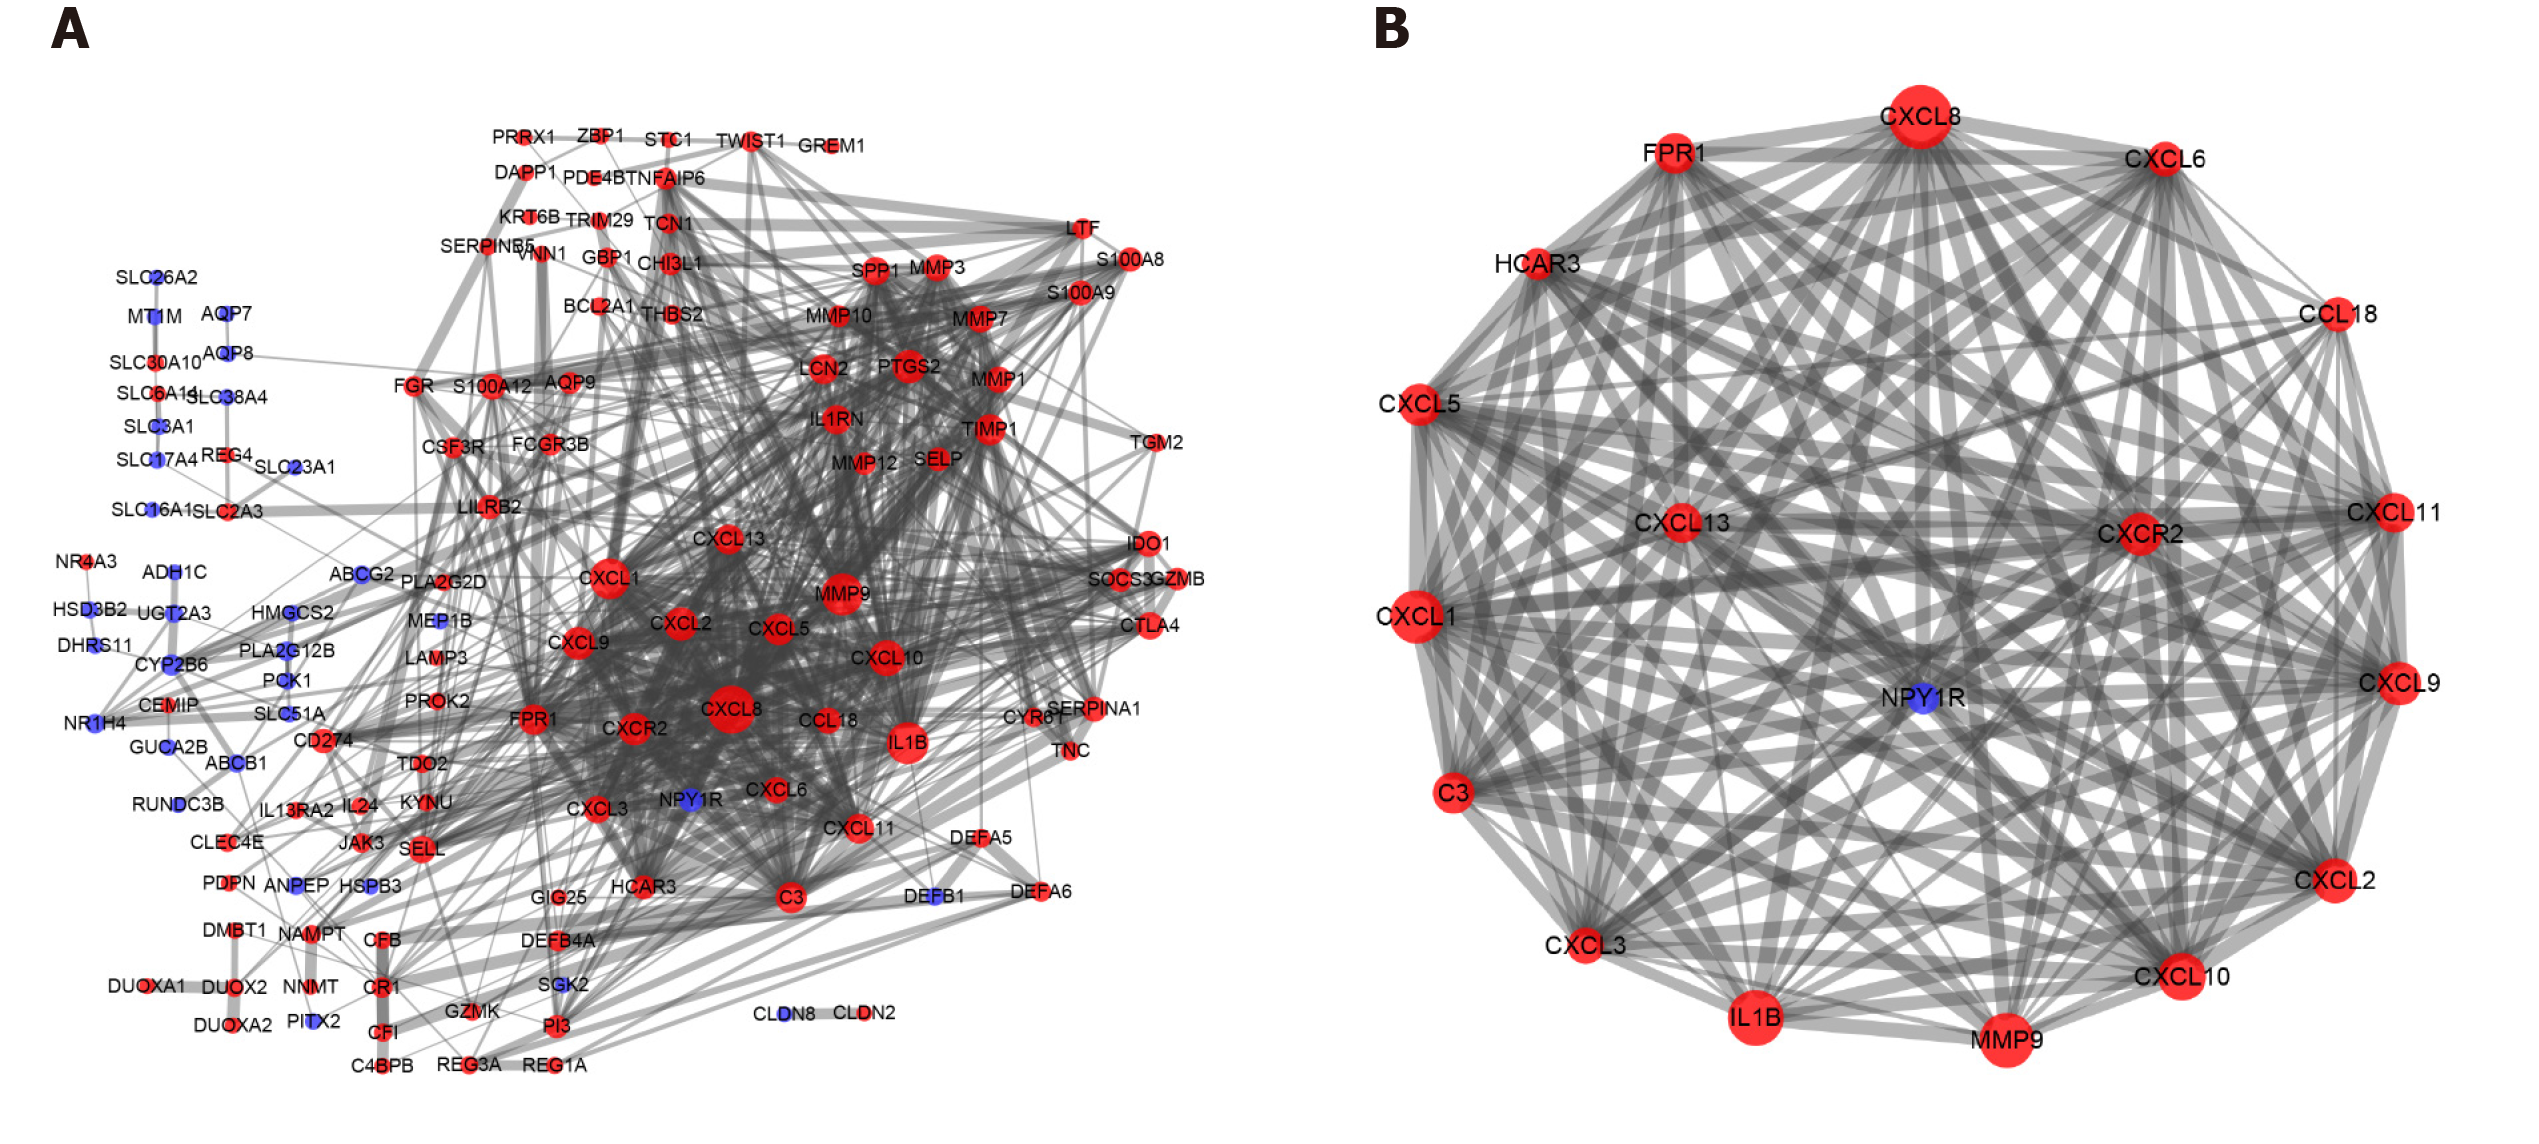
Figure 2 Protein-protein interactions of differentially expressed genes and the most significant module cluster identified by Molecular Complex Detection in the protein-protein interaction network of ulcerative colitis.
A: Protein-protein interaction network of differentially expressed genes determined using Cytoscape. One hundred and seventy-seven differentially expressed genes from the Search Tool for the Retrieval of Interacting Genes online database were screened using Cytoscape, including 130 nodes and 639 edges. Upregulated genes were shown in red, and downregulated genes were shown in blue; B: The most significant cluster was analyzed with the Molecular Complex Detection app in Cytoscape. Seventeen core genes were upregulated, and one gene was downregulated; a larger node indicated more interactions with a gene or a protein.
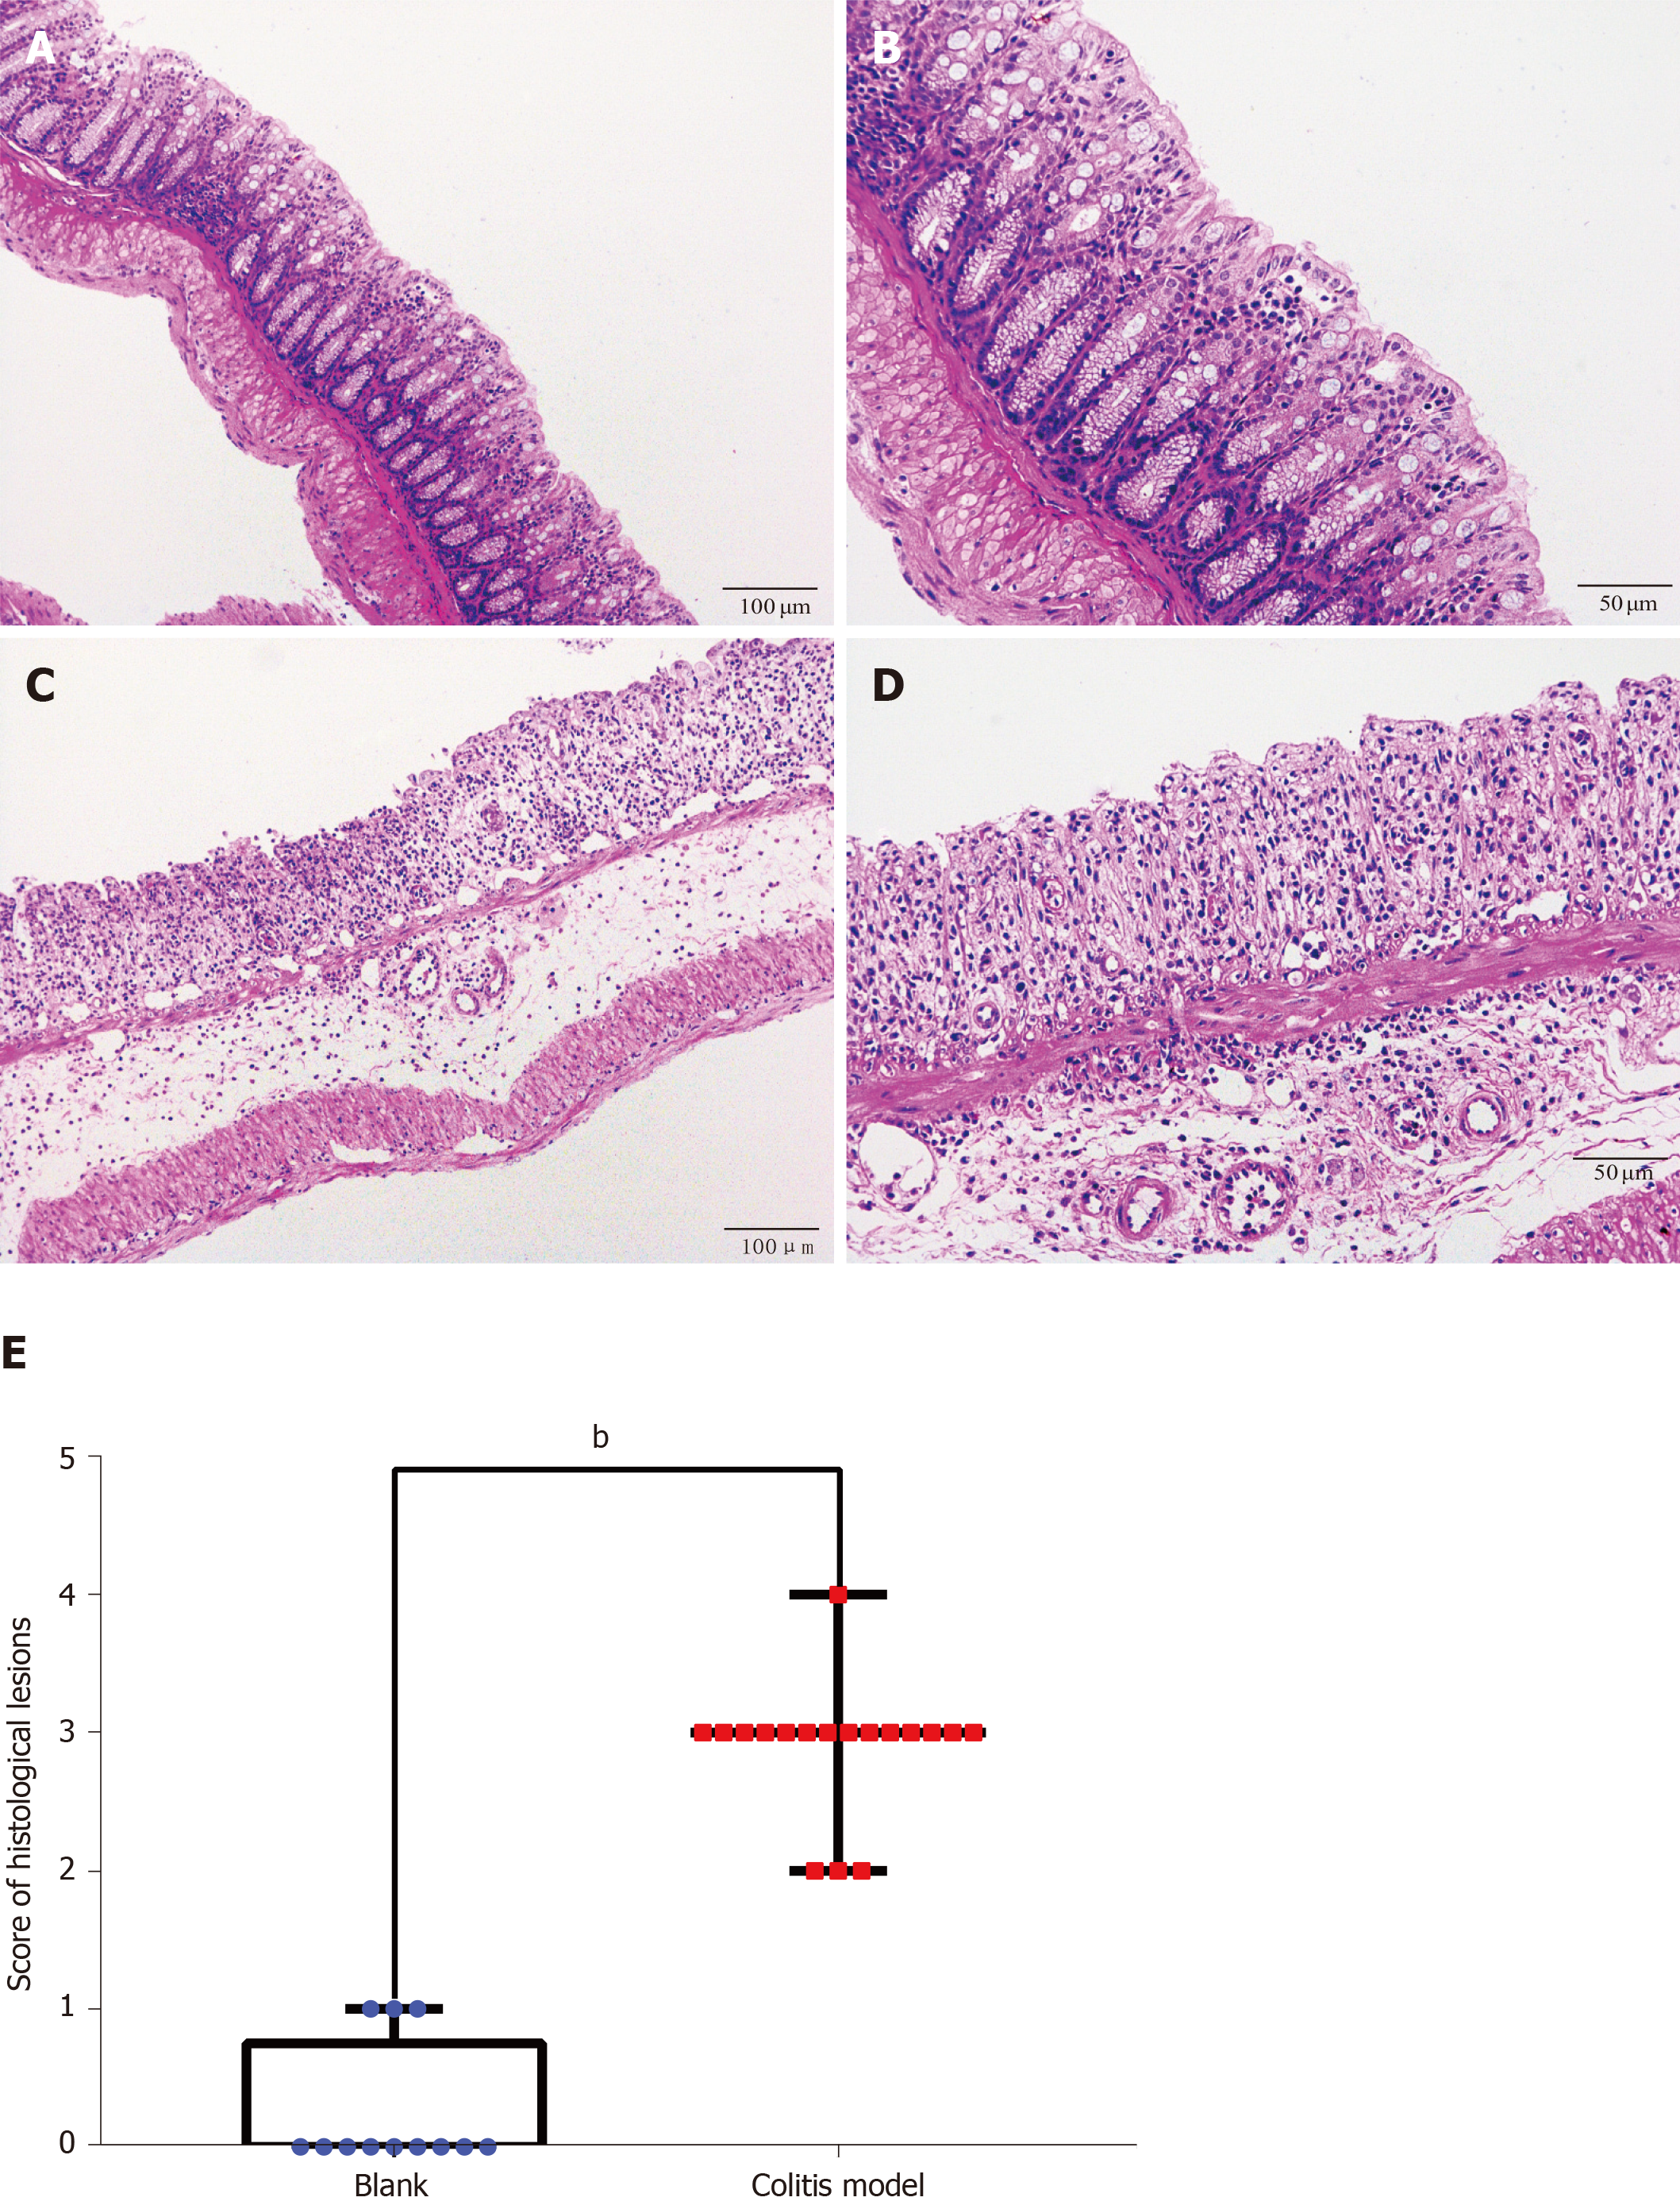
Figure 3 Hematoxylin-eosin staining and histological lesion score of colon tissues.
Hematoxylin-eosin staining of colon tissues from the control and dextran sulfate sodium-induced colitis model mice. A: Control mice (× 100); B: Control mice (× 200); C: Colitis mice (× 100); D: Colitis mice (× 200); E: Histological lesion scores of colon tissues. Numerous neutrophils infiltrated and the crypts, goblet cells and normal four-layer structure of colon disappeared in the colitis model mice. Compared to the score of the control group (n = 4, 12 pieces), the score of the model group (n = 6, 18 pieces) increased significantly (P < 0.01).
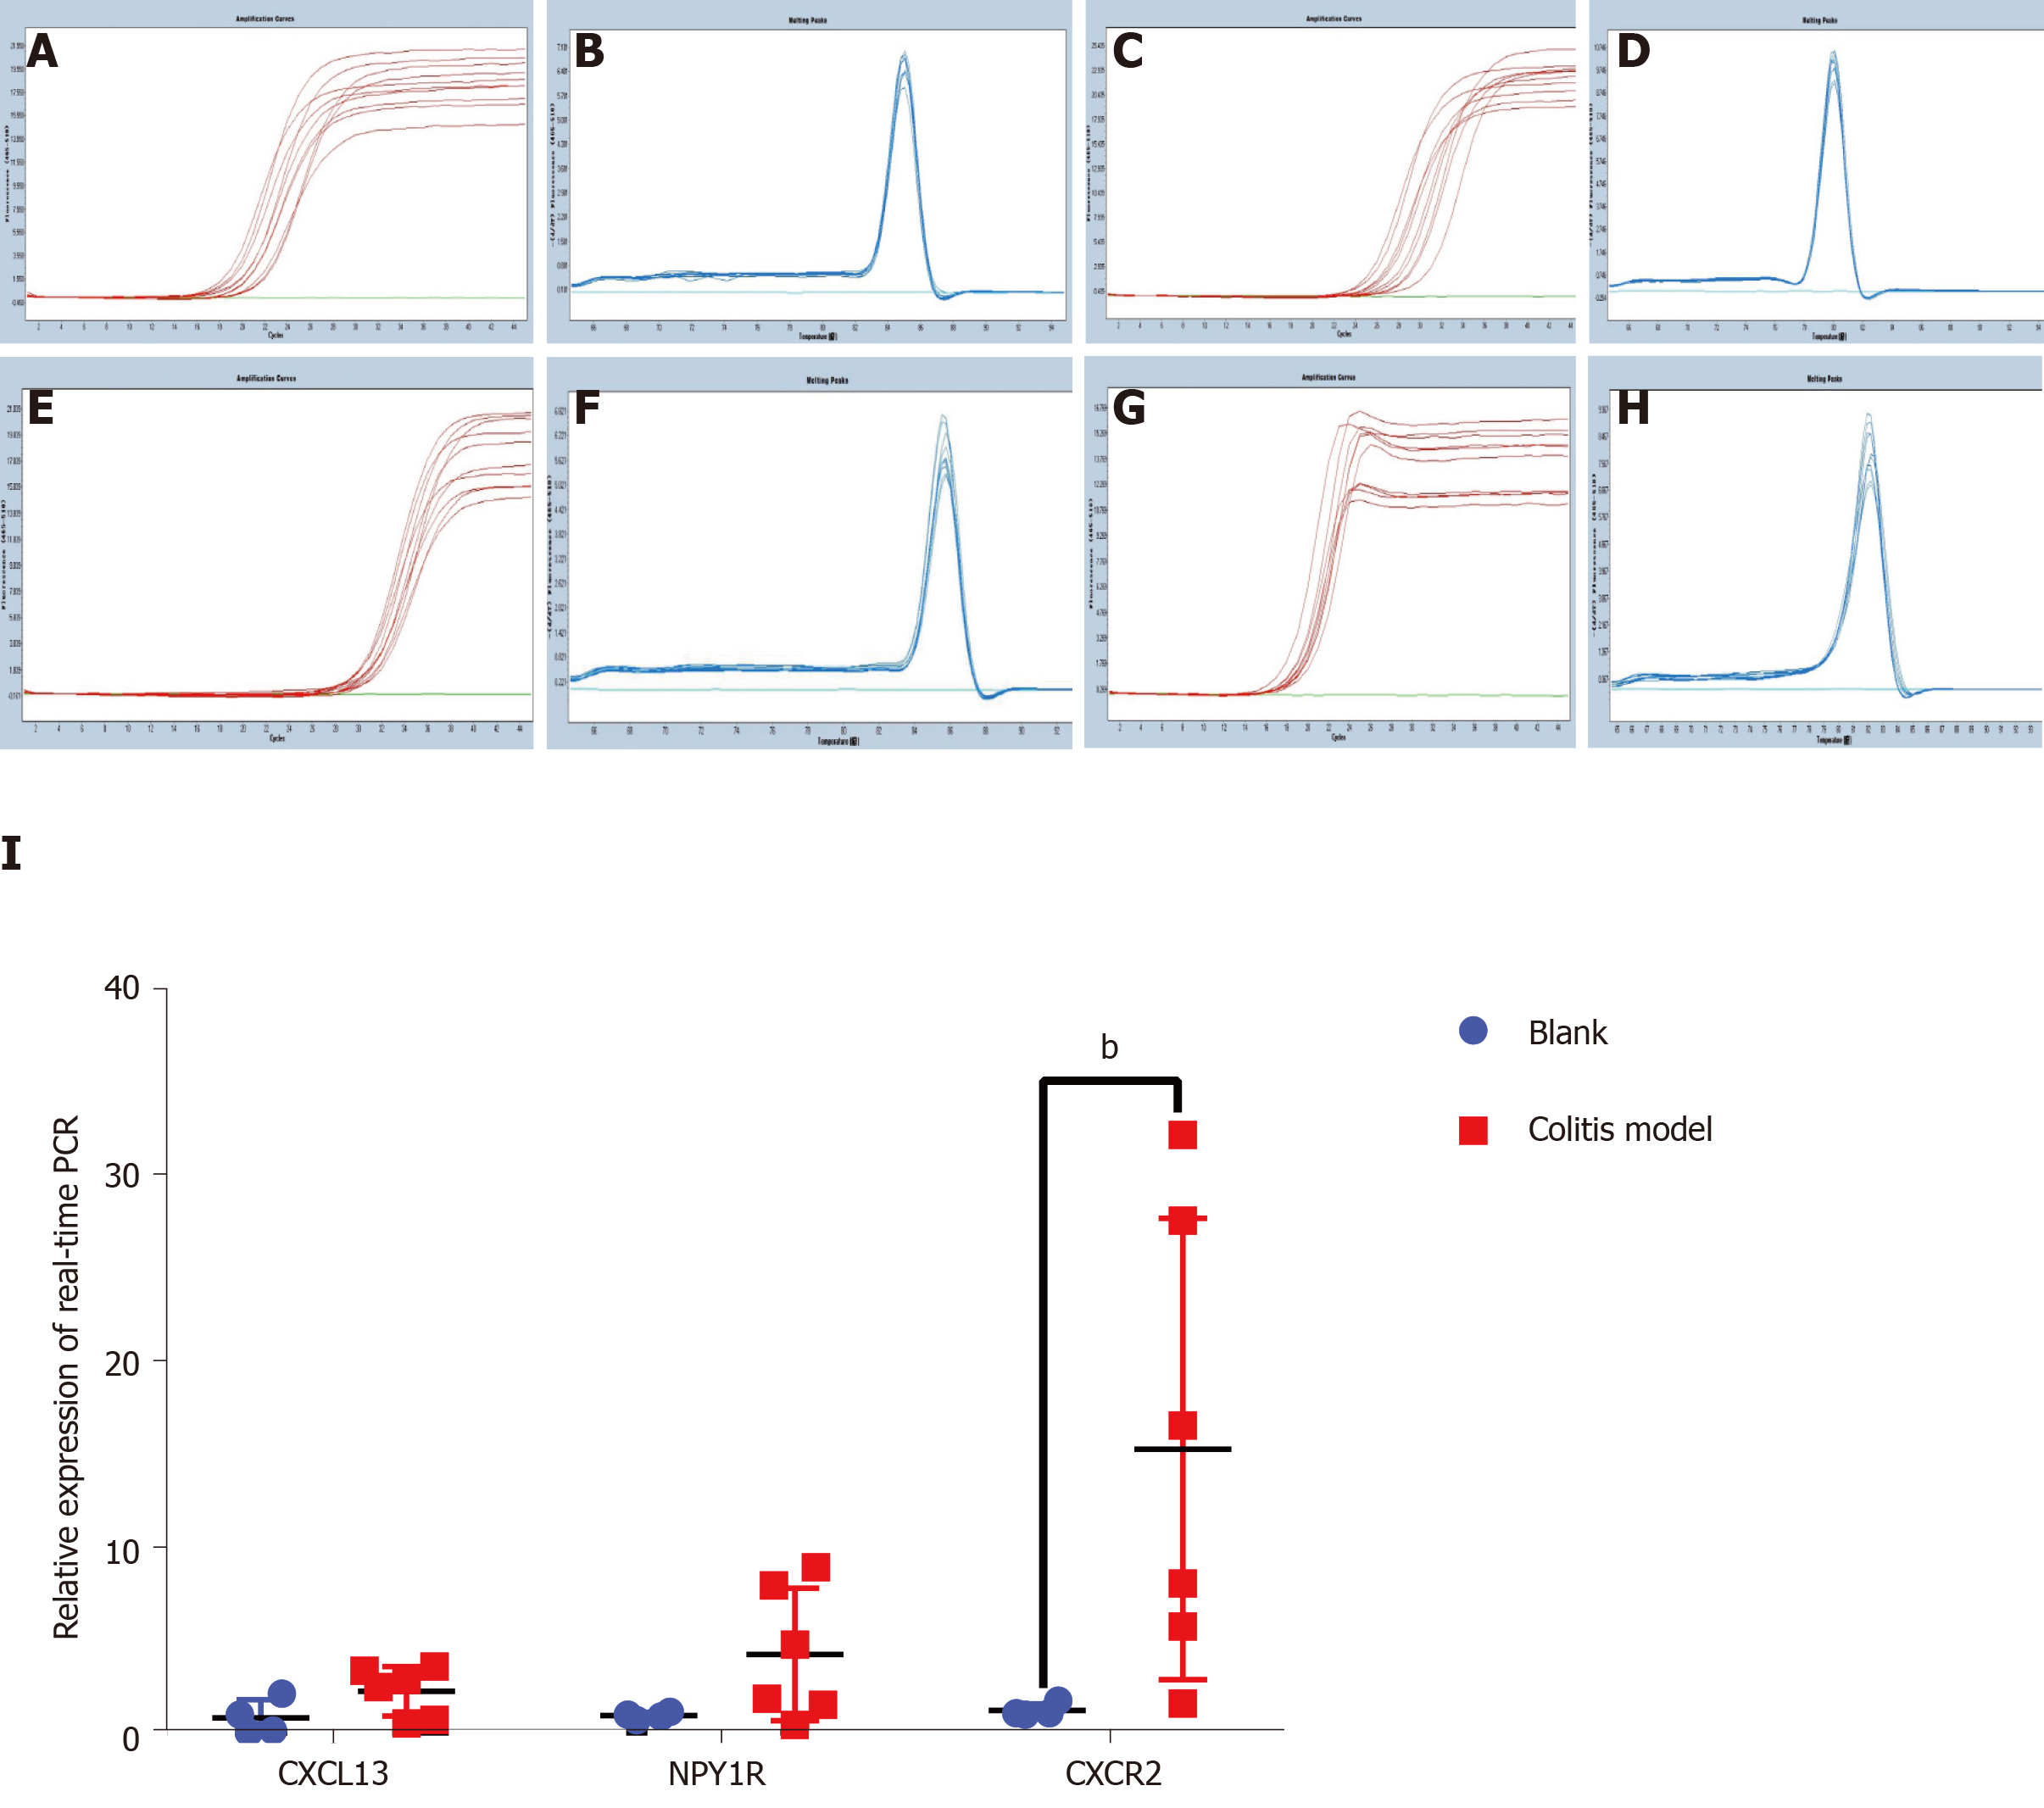
Figure 4 Real-time polymerase chain reaction of the top three core genes from the first cluster in colon tissues from the colitis model and control mice.
A, C, E, and G: Amplification curves for β-actin, C-X-C motif chemokine ligand 13, neuropeptide Y receptor Y1 and C-X-C motif chemokine receptor 2 (CXCR2); B, D, F and H: Melting peaks for β-actin, C-X-C motif chemokine ligand 13, neuropeptide Y receptor Y1 and CXCR2; I: Relative expression obtained using real-time polymerase chain reaction. C-X-C motif chemokine ligand 13, neuropeptide Y receptor Y1 and CXCR2 expression, particularly CXCR2 expression (P < 0.01), increased in the colitis model mice. The other two genes were expressed at higher levels in the colitis mice than in the control mice, but the difference was not significant. CXCL13: C-X-C motif chemokine ligand 13; NPY1R: Neuropeptide Y receptor Y1; CXCR2: C-X-C motif chemokine receptor 2.
- Citation: Shi L, Han X, Li JX, Liao YT, Kou FS, Wang ZB, Shi R, Zhao XJ, Sun ZM, Hao Y. Identification of differentially expressed genes in ulcerative colitis and verification in a colitis mouse model by bioinformatics analyses. World J Gastroenterol 2020; 26(39): 5983-5996
- URL: https://www.wjgnet.com/1007-9327/full/v26/i39/5983.htm
- DOI: https://dx.doi.org/10.3748/wjg.v26.i39.5983


