Copyright
©The Author(s) 2020.
World J Gastroenterol. Oct 7, 2020; 26(37): 5646-5660
Published online Oct 7, 2020. doi: 10.3748/wjg.v26.i37.5646
Published online Oct 7, 2020. doi: 10.3748/wjg.v26.i37.5646
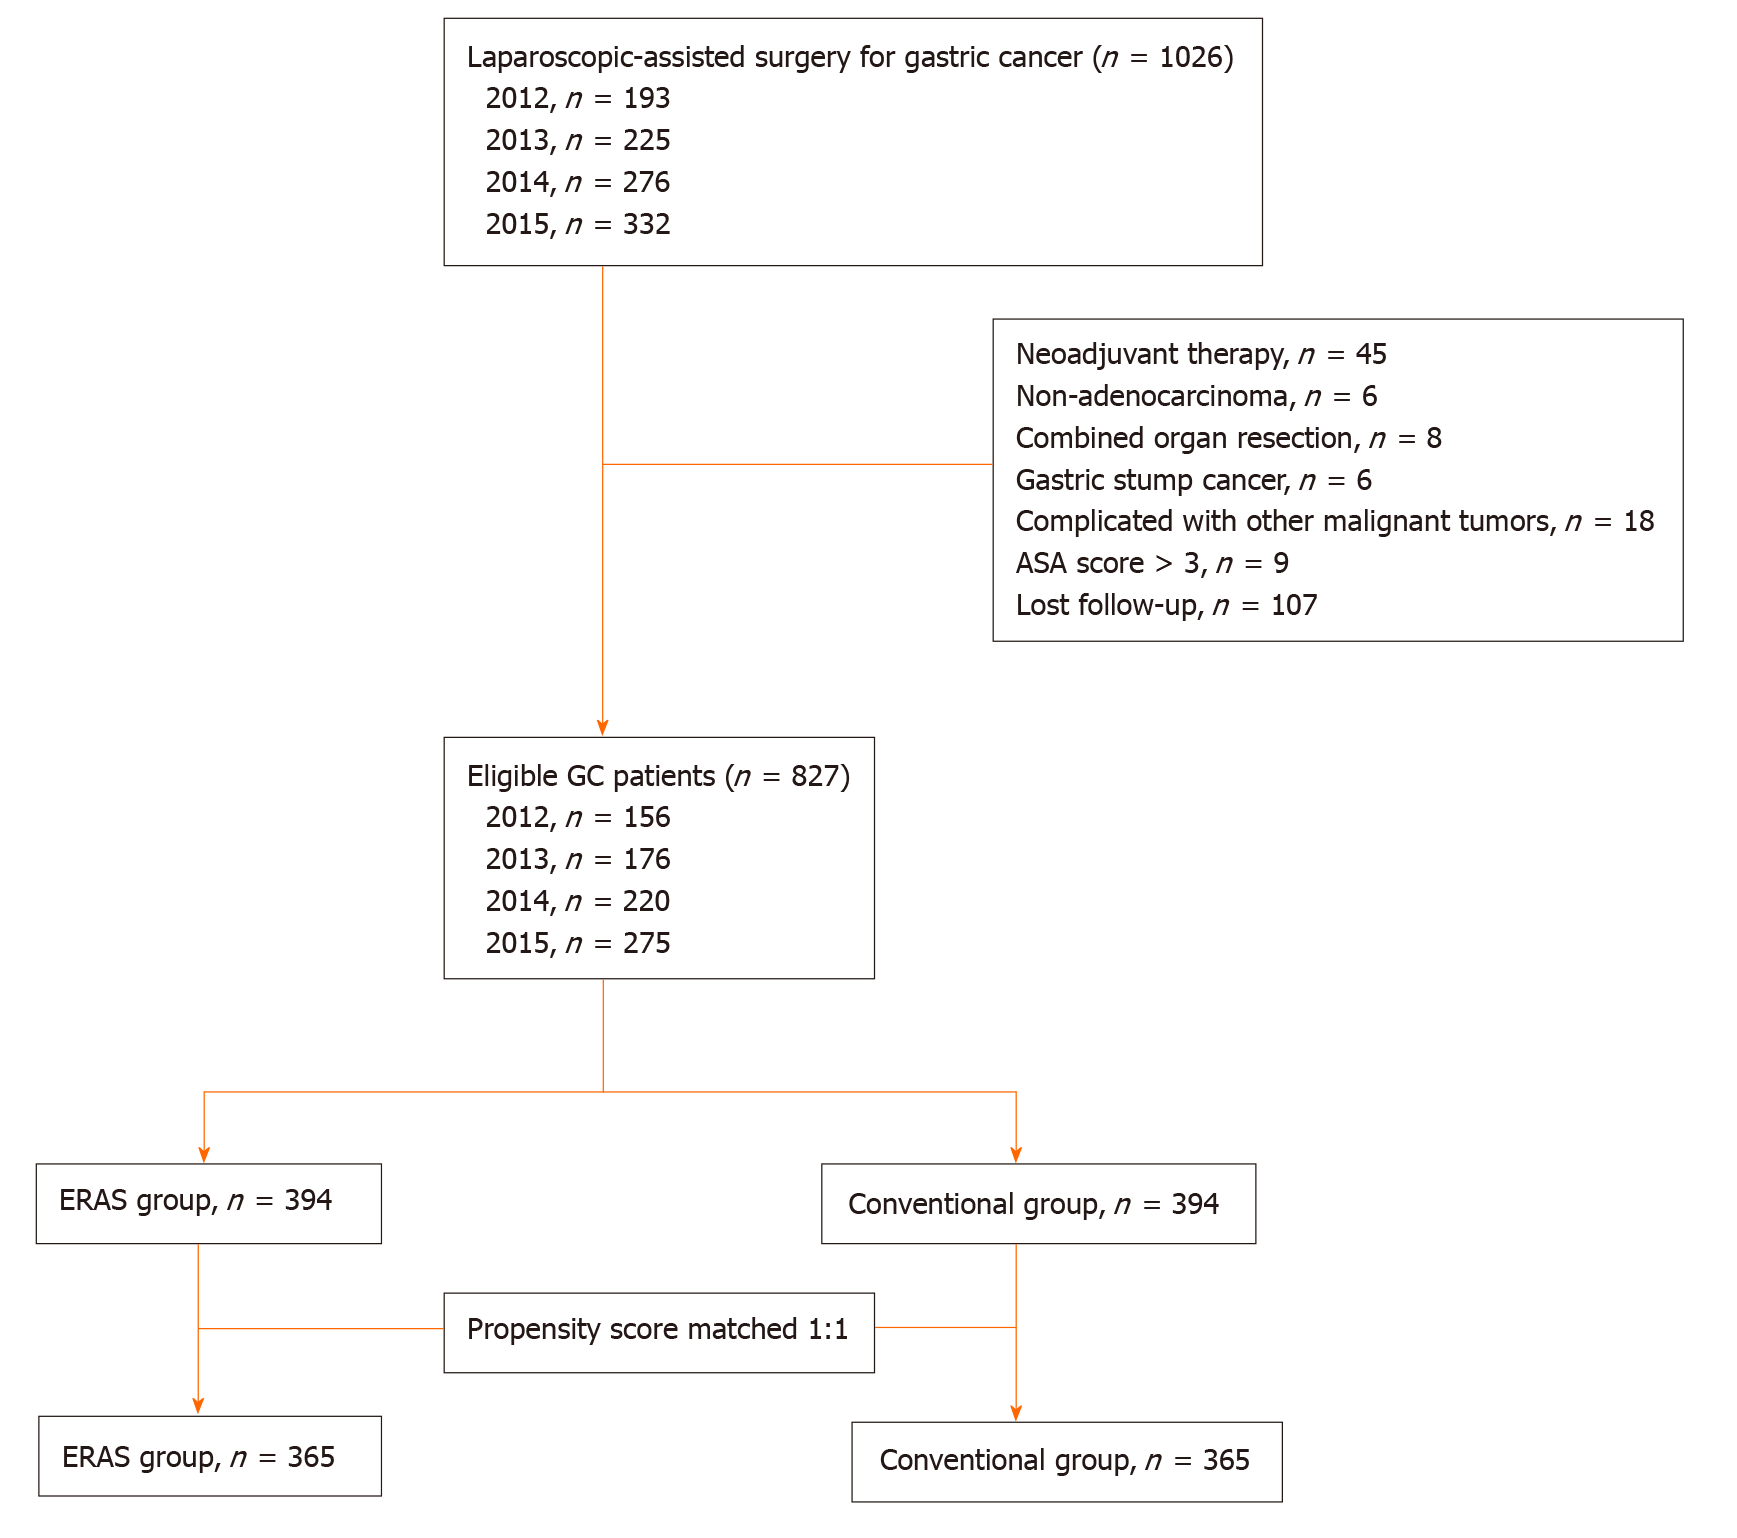
Figure 1 Flow diagram of patient selection process.
GC: Gastric cancer; ASA: American Society of Anesthesiologists; ERAS: Enhanced recovery after surgery.
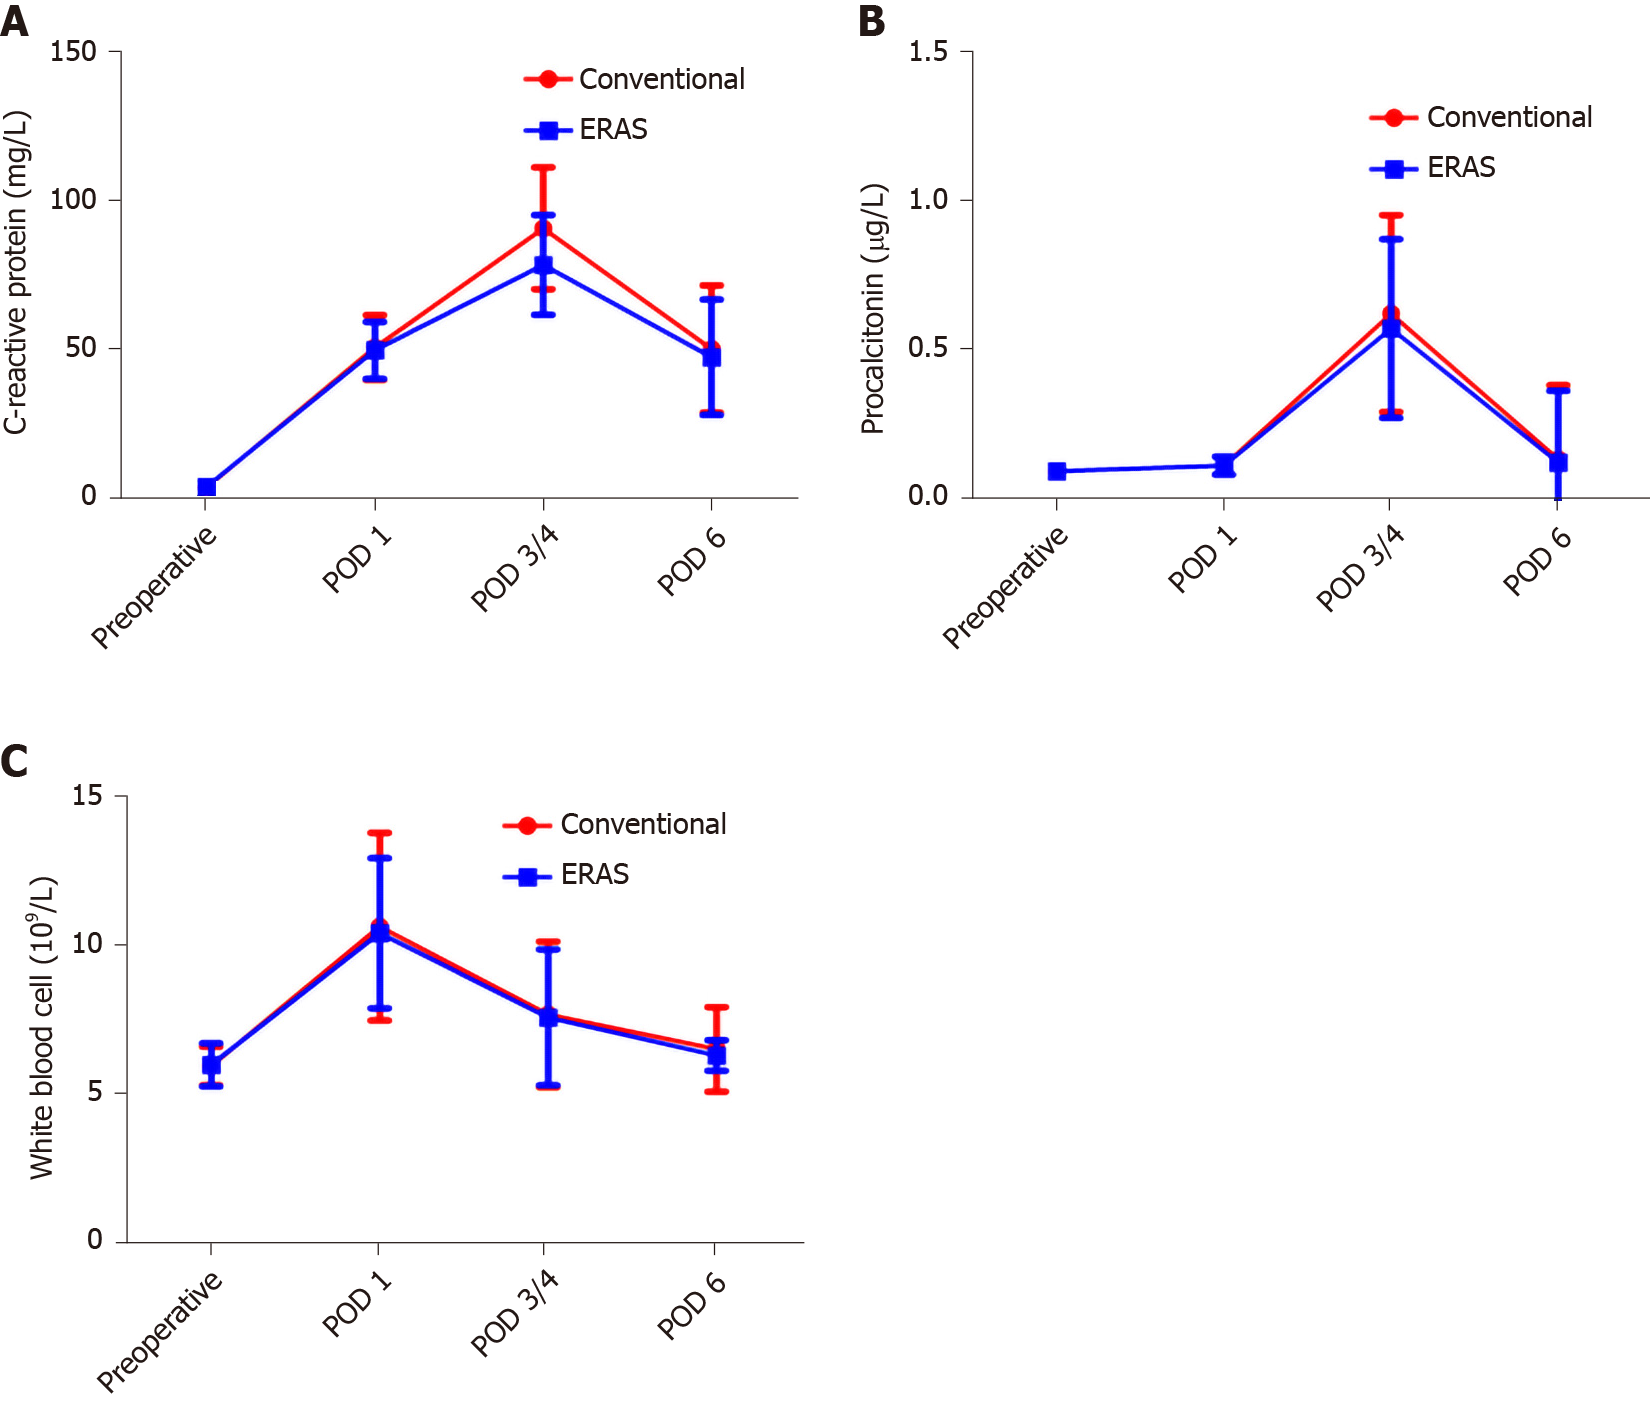
Figure 2 Comparison of levels of inflammatory indexes in the two groups.
A: C-reactive protein; B: Procalcitonin; C: White blood cell count. POD: Postoperative day; ERAS: Enhanced recovery after surgery.
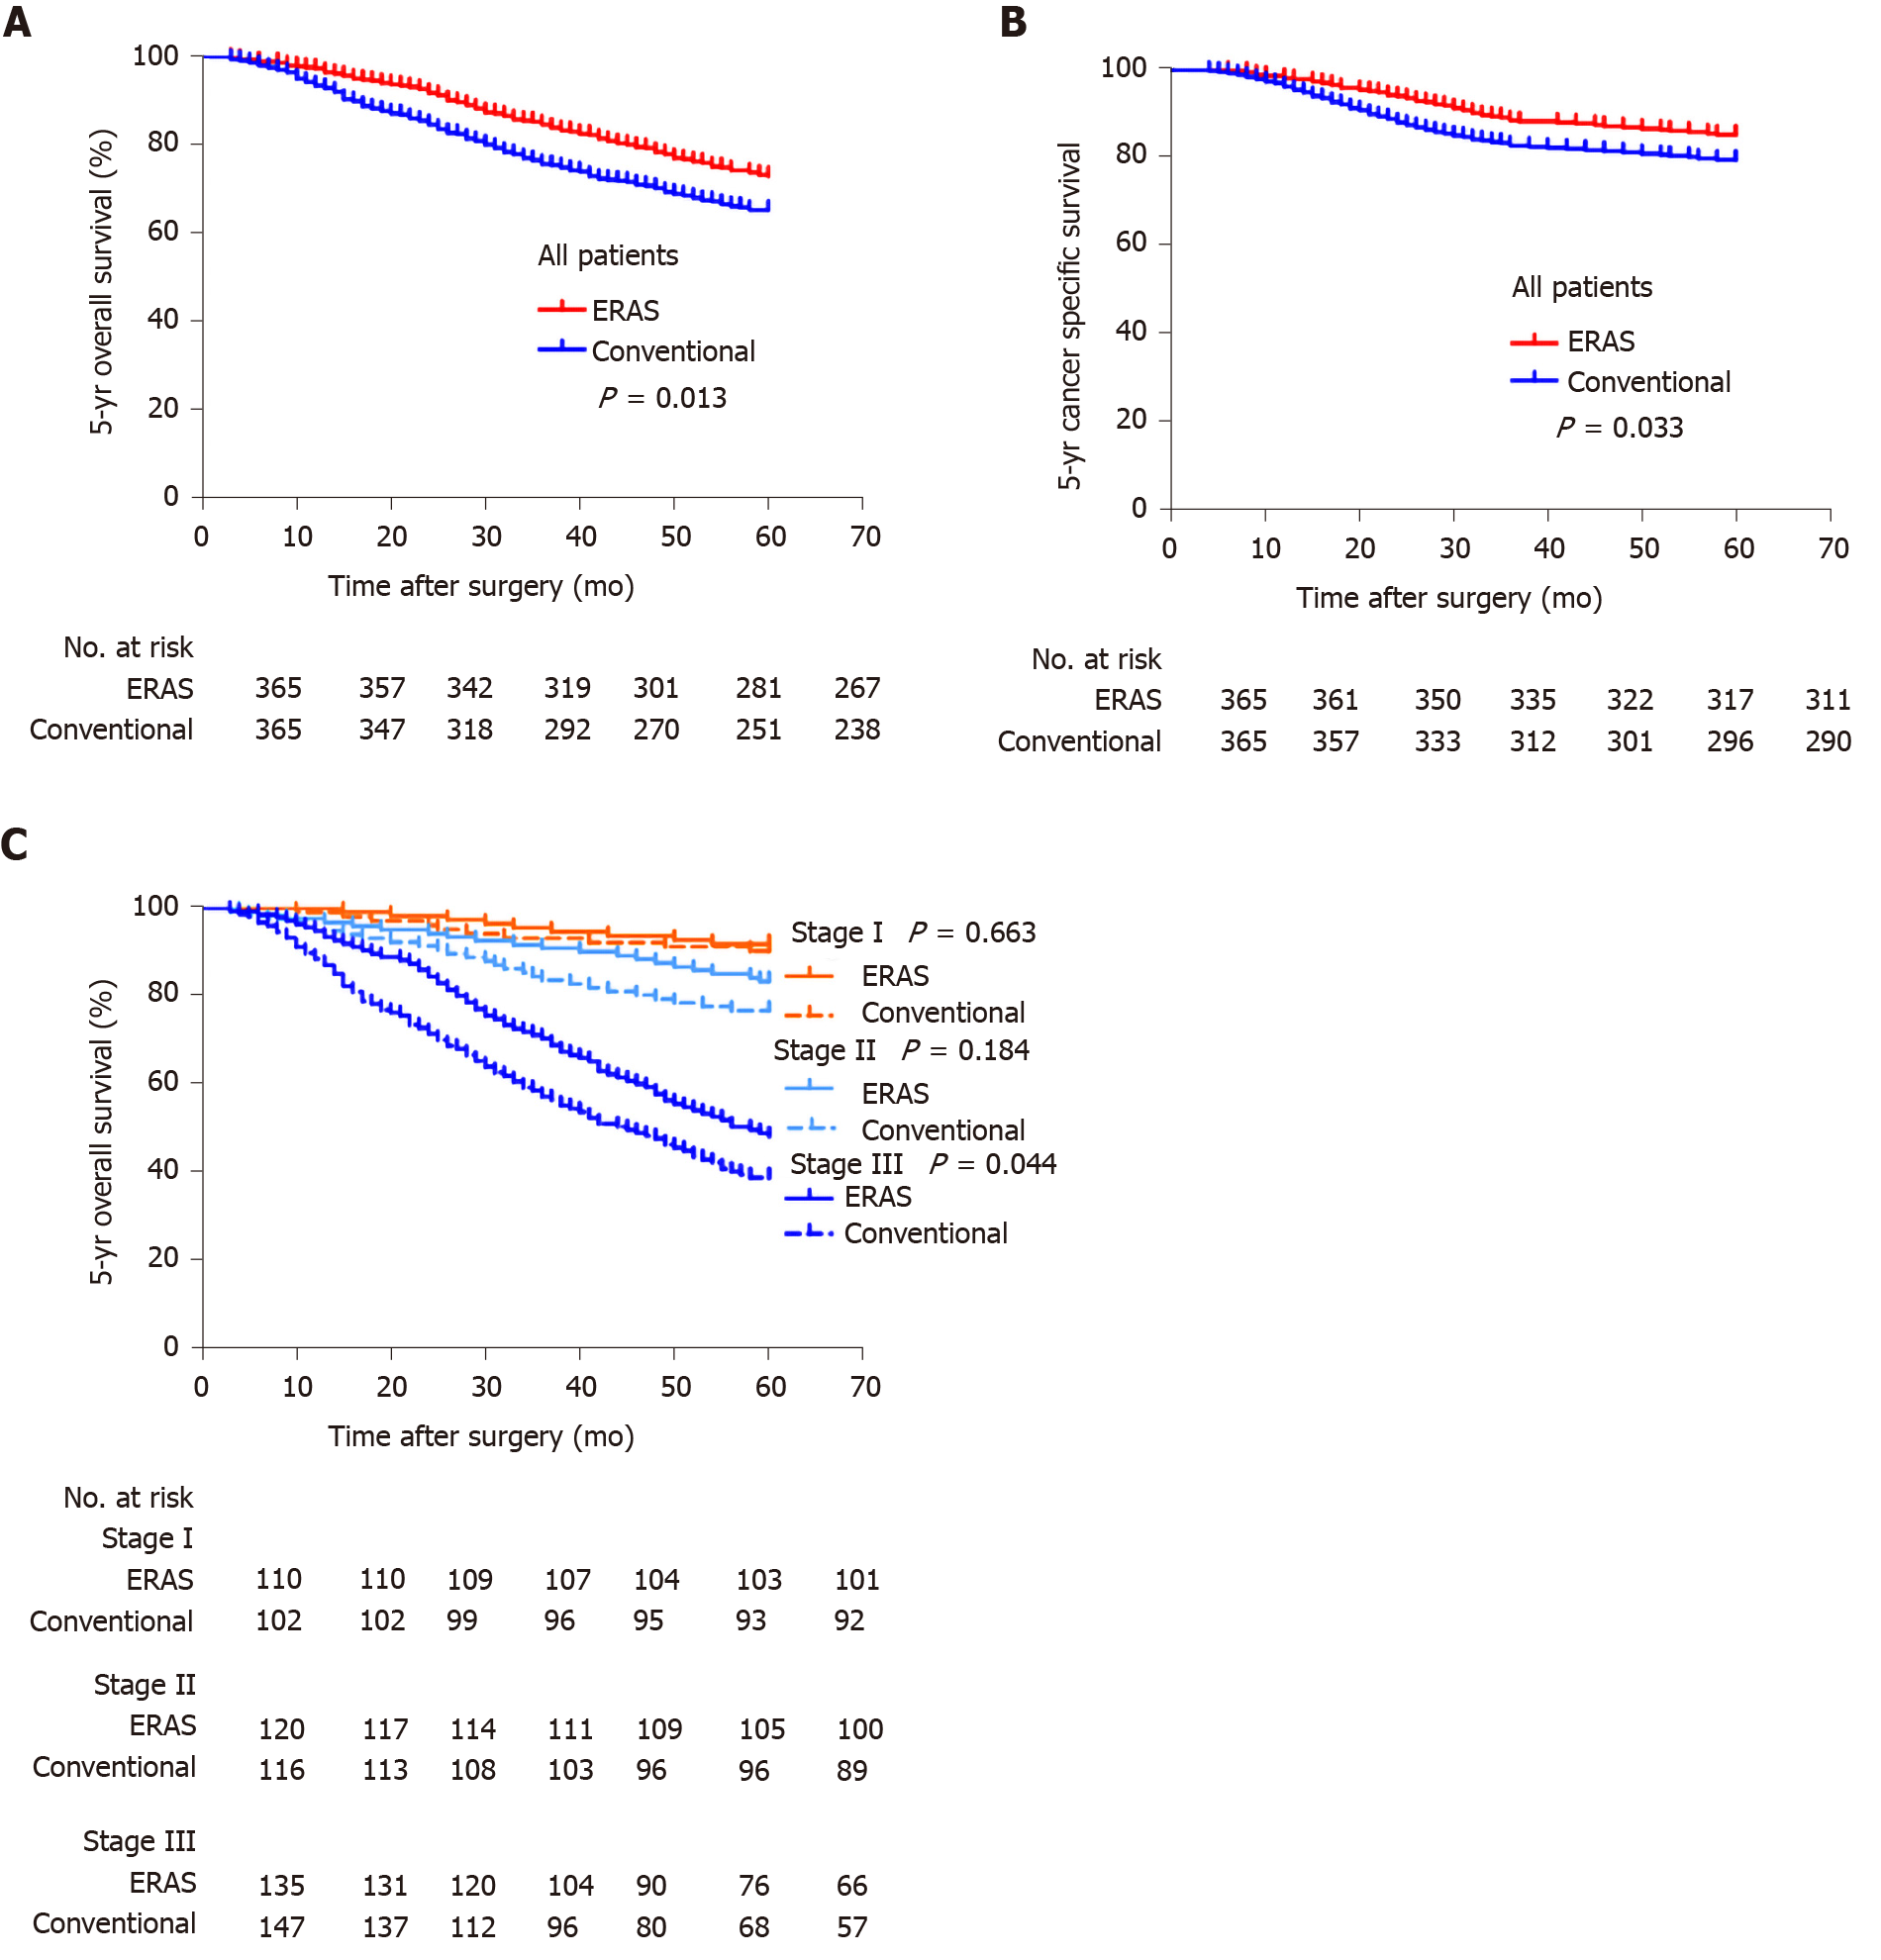
Figure 3 Kaplan-Meier curves.
A: 5-yr overall survival; B: 5-yr cancer-specific survival; C: 5-yr overall survival for stages I, II, and III disease between the two groups. ERAS: Enhanced recovery after surgery.
- Citation: Tian YL, Cao SG, Liu XD, Li ZQ, Liu G, Zhang XQ, Sun YQ, Zhou X, Wang DS, Zhou YB. Short- and long-term outcomes associated with enhanced recovery after surgery protocol vs conventional management in patients undergoing laparoscopic gastrectomy. World J Gastroenterol 2020; 26(37): 5646-5660
- URL: https://www.wjgnet.com/1007-9327/full/v26/i37/5646.htm
- DOI: https://dx.doi.org/10.3748/wjg.v26.i37.5646


