Copyright
©The Author(s) 2020.
World J Gastroenterol. Sep 7, 2020; 26(33): 5022-5049
Published online Sep 7, 2020. doi: 10.3748/wjg.v26.i33.5022
Published online Sep 7, 2020. doi: 10.3748/wjg.v26.i33.5022
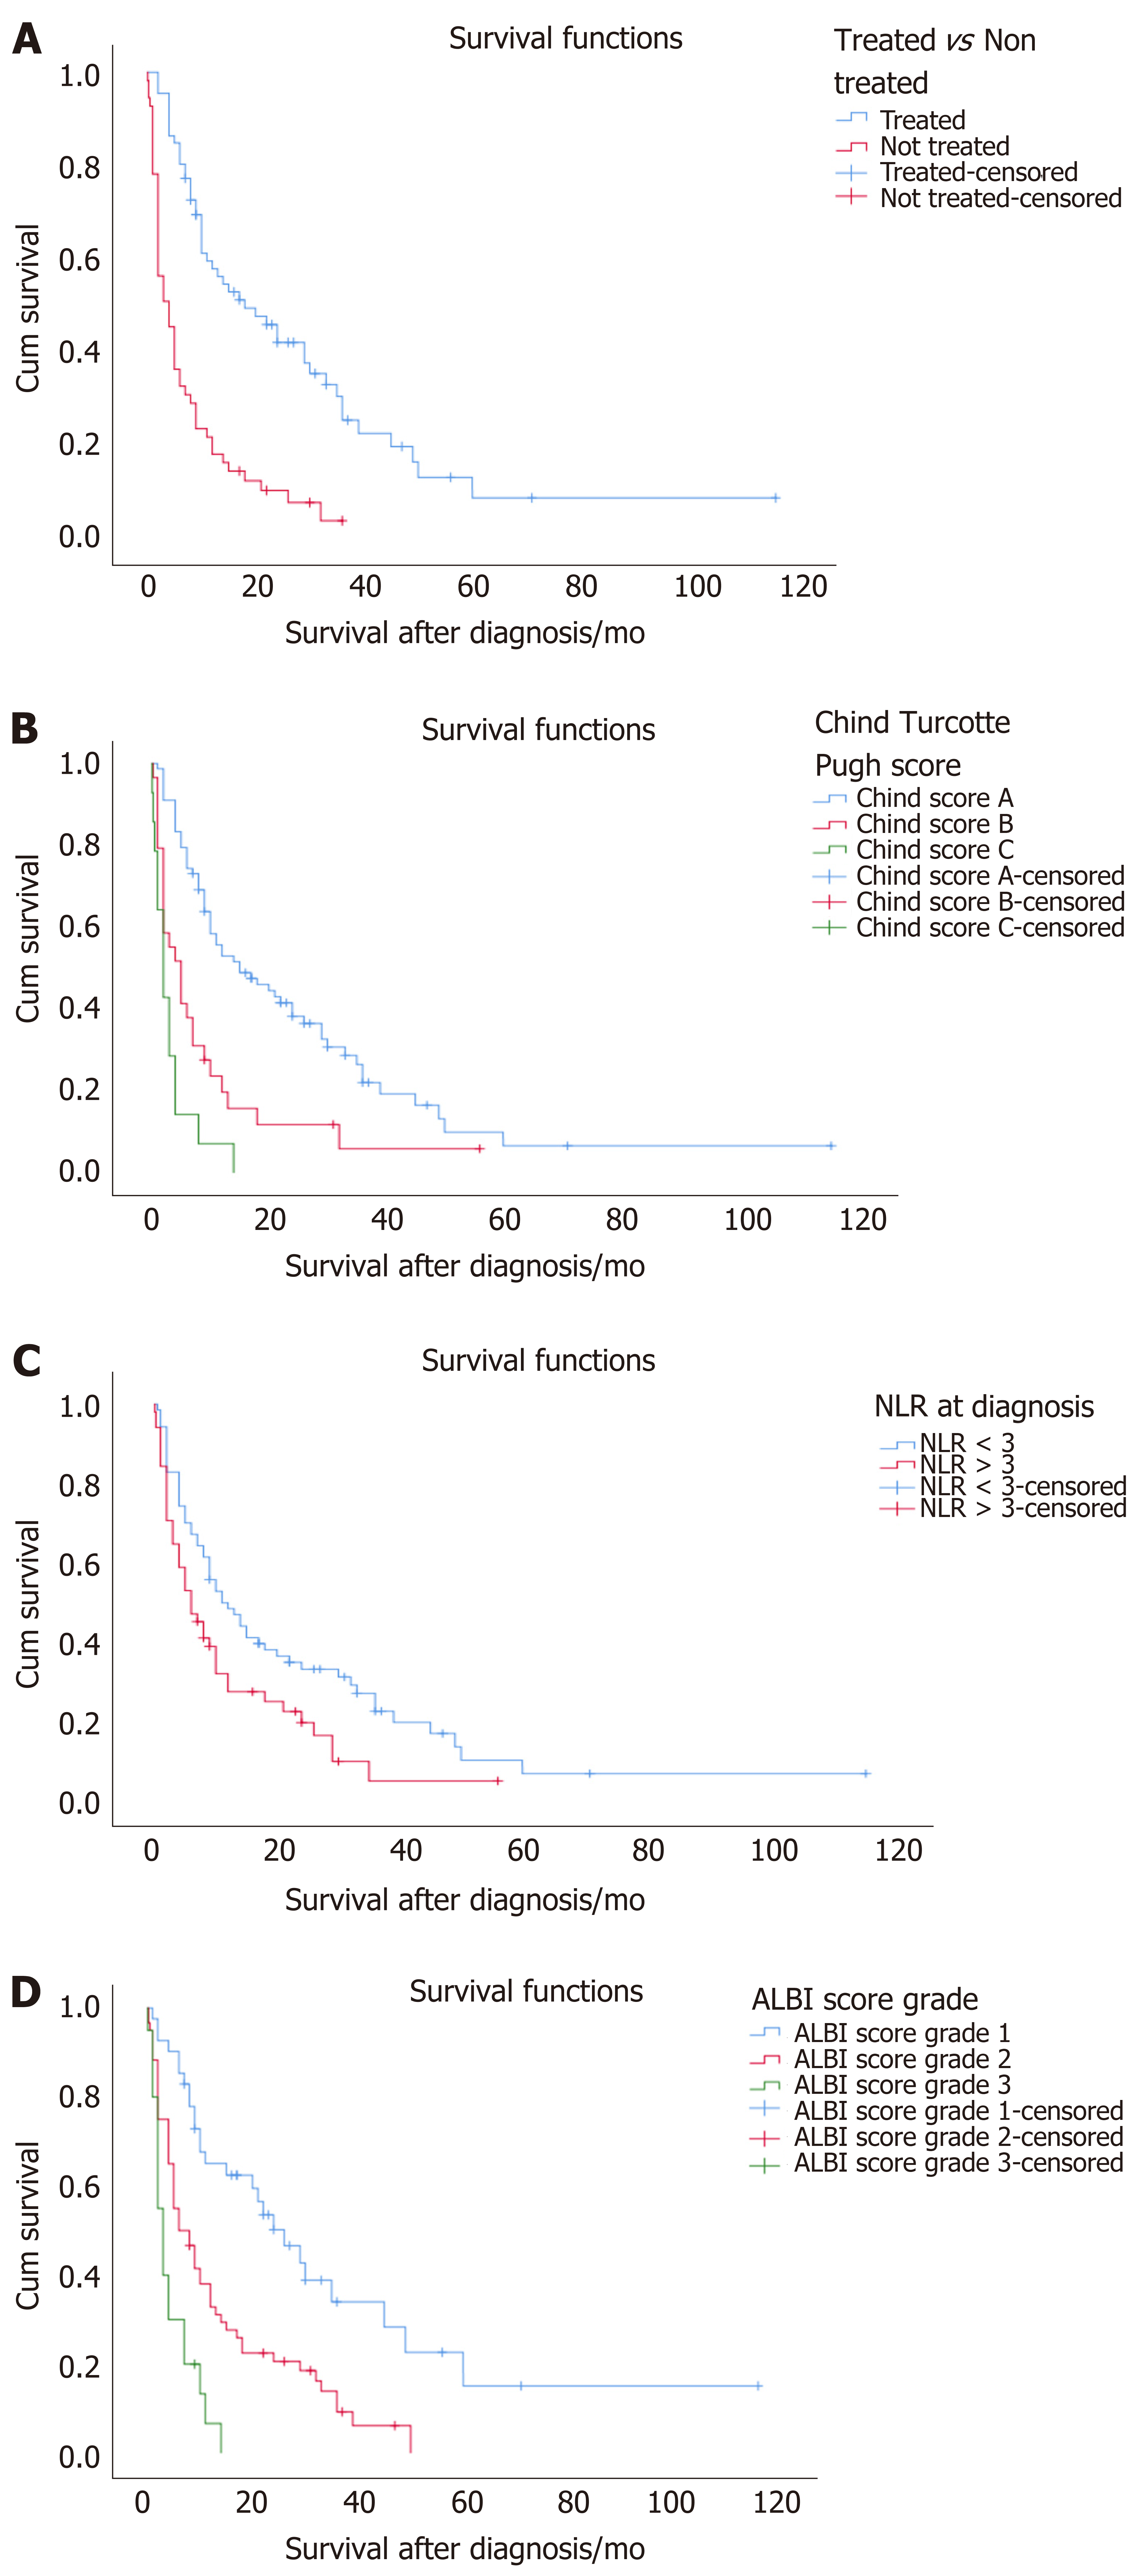
Figure 1 Hepatocellular carcinoma survival curves.
A: Survival curve between the treated and non-treated group; B: Survival curve between different stages of the child Turcotte Pugh score; C: Survival curve comparing low and high neutrophil to lymphocyte ratio; D: Survival curve comparing different albumin bilirubin grades. NLR: Neutrophil to lymphocyte ratio. ALBI: Albumin bilirubin.
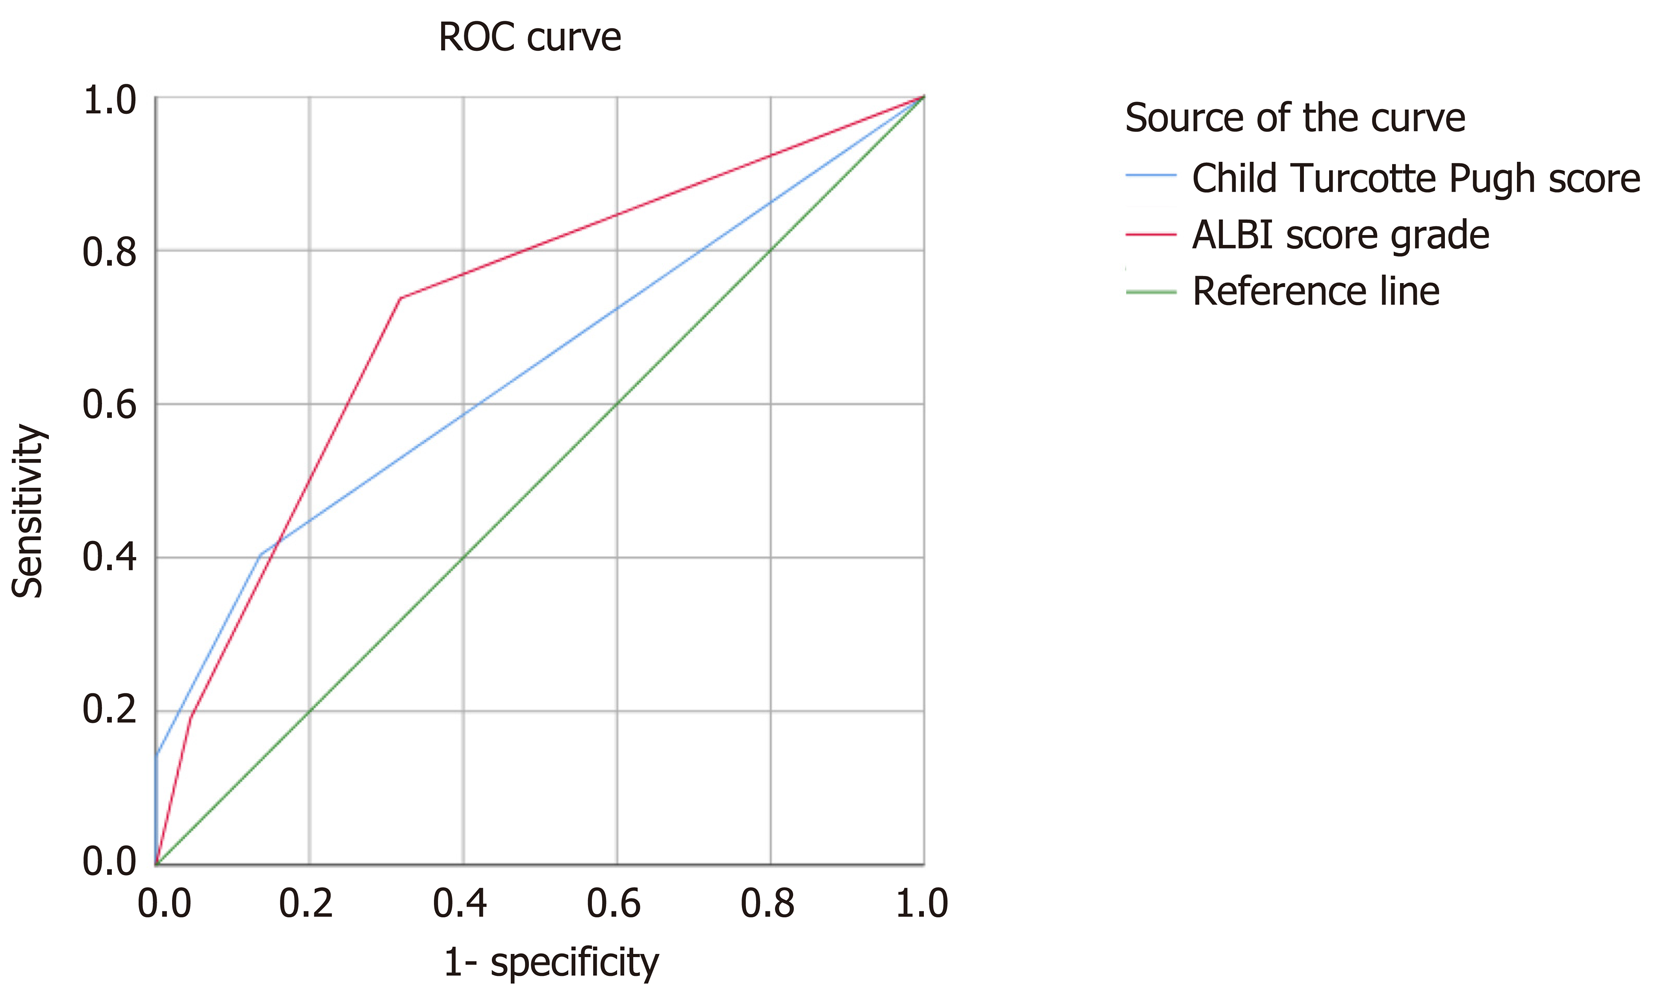
Figure 2 Receiver operating characteristic curves comparing between child turcotte pugh score and albumin bilirubin grading system.
The area under the curves represents death from hepatocellular carcinoma. ROC: Receiver operating characteristic.
- Citation: Bannaga A, Arasaradnam RP. Neutrophil to lymphocyte ratio and albumin bilirubin grade in hepatocellular carcinoma: A systematic review. World J Gastroenterol 2020; 26(33): 5022-5049
- URL: https://www.wjgnet.com/1007-9327/full/v26/i33/5022.htm
- DOI: https://dx.doi.org/10.3748/wjg.v26.i33.5022


