Copyright
©The Author(s) 2020.
World J Gastroenterol. Sep 7, 2020; 26(33): 4933-4944
Published online Sep 7, 2020. doi: 10.3748/wjg.v26.i33.4933
Published online Sep 7, 2020. doi: 10.3748/wjg.v26.i33.4933
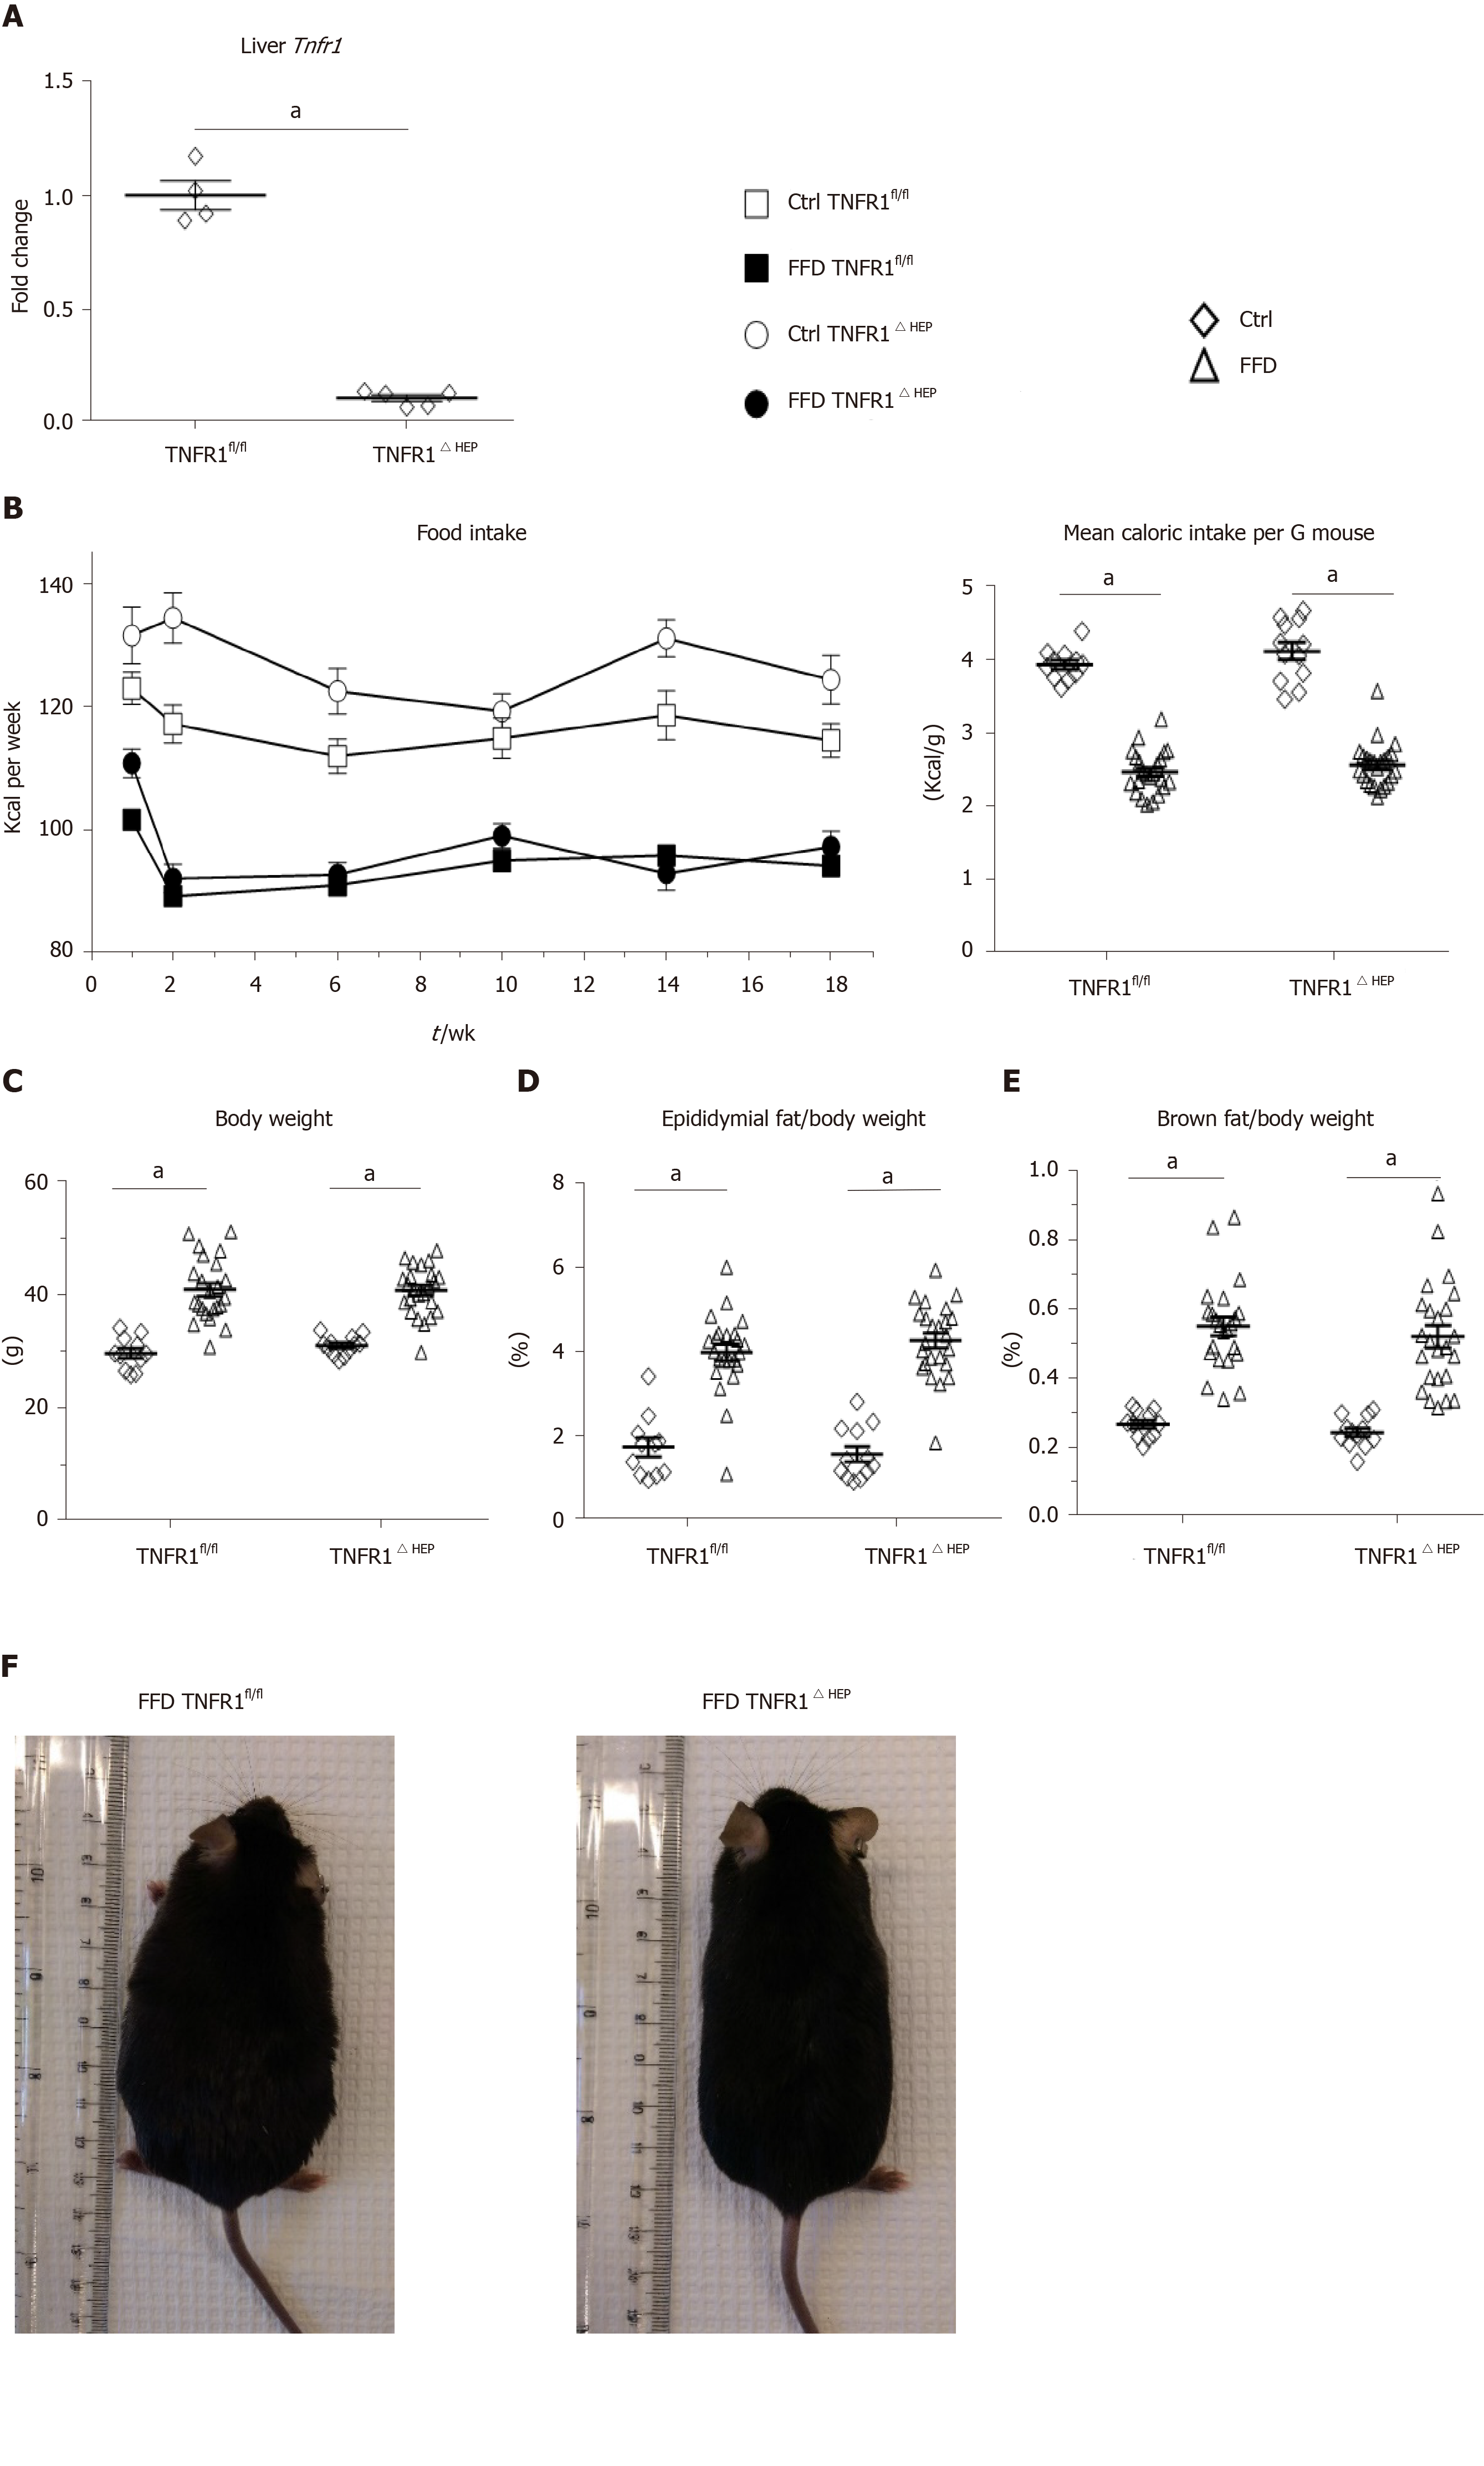
Figure 1 Effect of tumor necrosis factor alpha receptor 1 deficiency in hepatocytes on body weight.
A: Tumor necrosis factor alpha receptor 1 (Tnfr1) expression in liver samples (n = 4-5); B: Food intake per group over the course of the experiment, given in kilocalories (Kcal) and normalized to the mouse weight; C: Body weight and relative weights of epididymal (D) and brown fat tissues (E) after 20 wk of feeding; F: Example appearance of mice with a knockout of TNFR1 in hepatocytes (TNFR1ΔHEP) and their TNFR1-expressing littermates (TNFR1fl/fl) after 20 wk of fast food diet (FFD). Numbers of biological replicates: Ctrl/TNFR1fl/fln = 11; FFD/TNFR1fl/fln = 23; Ctrl/TNFR1ΔHEPn = 12; FFD/TNFR1ΔHEPn = 24. Line shows mean + standard error of the mean. Significant differences are marked with (a) if P < 0.05. Ctrl: Standard chow.
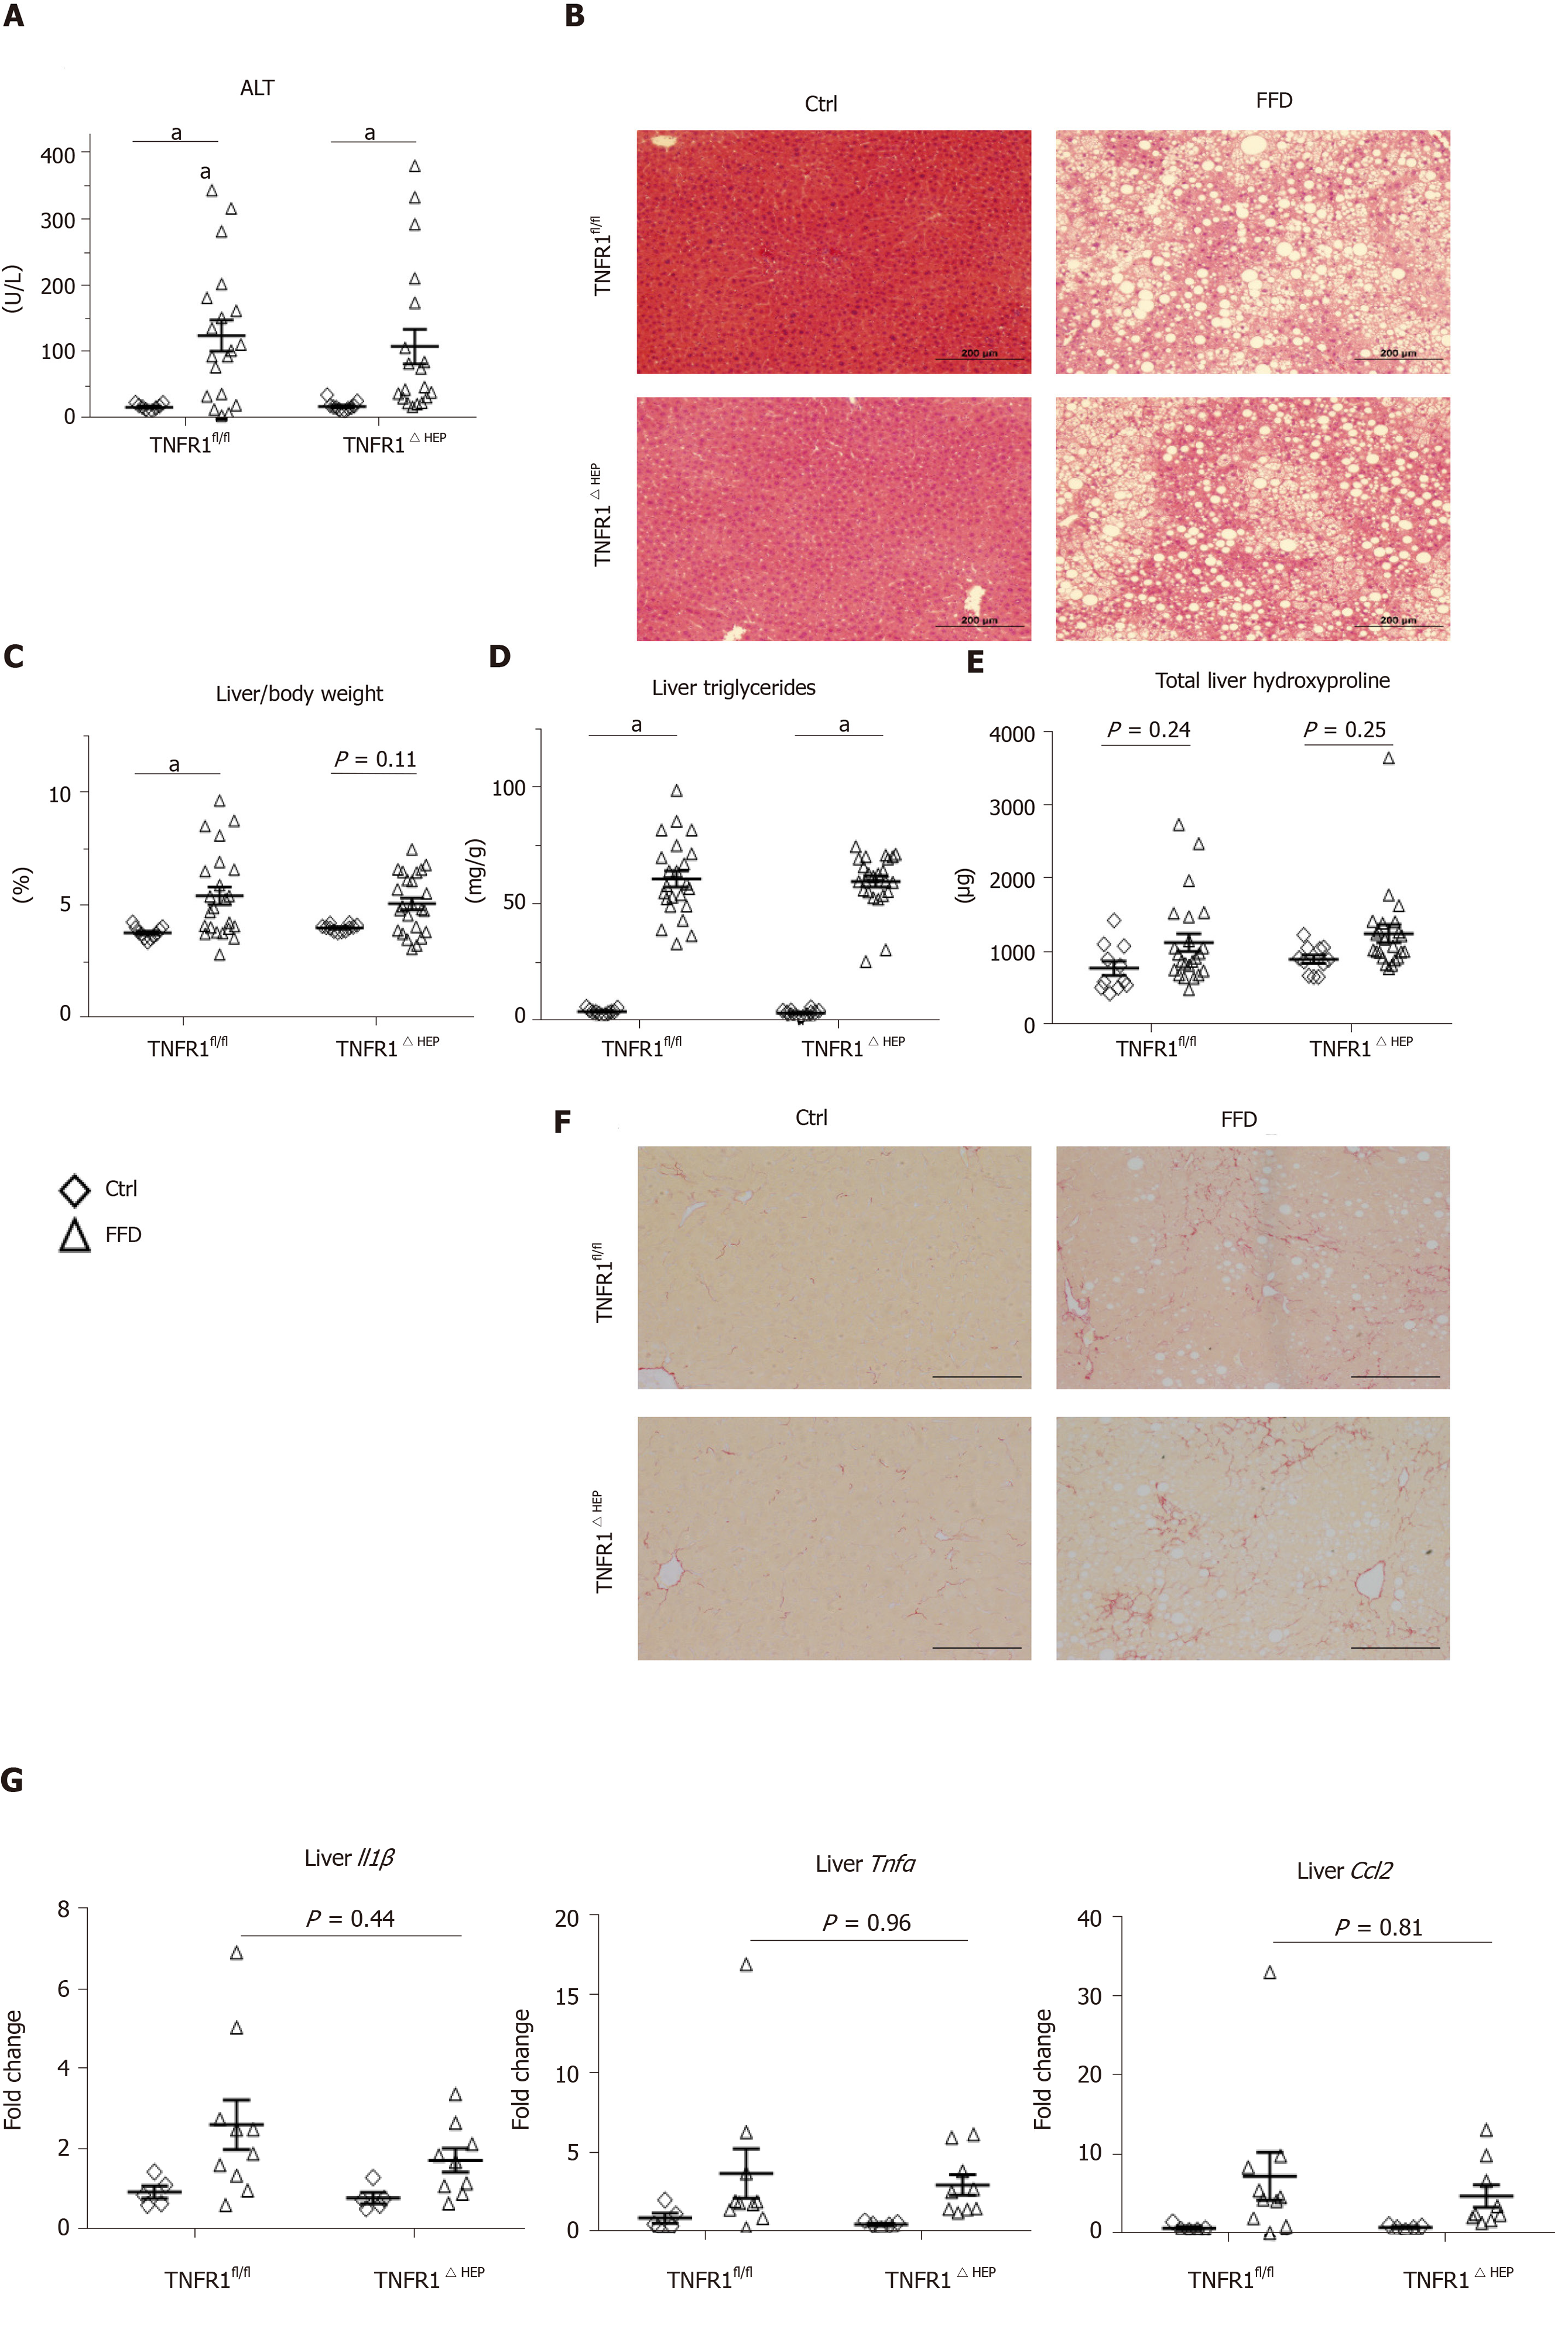
Figure 2 Effect of tumor necrosis factor alpha receptor 1 deficiency in hepatocytes on liver phenotype.
A: Plasma levels of alanine amino transferase (ALT); B: Representative hematoxylin and eosin-stained liver sections; C: Relative liver weight; D: Relative amount of triglycerides normalized to liver weight. E: Total amount of hydroxyproline per liver; F: Representative Sirius Red-stained liver sections; G: Expression of the inflammatory genes interleukin 1-β (Il1-β), tumor necrosis factor alpha (Tnfα), and C-C motif chemokine ligand 2 (Ccl2). Scale bars: 200 µm. Number of biological replicates: Ctrl/tumor necrosis factor alpha receptor 1-expressing littermates (TNFR1fl/fl) n = 9-11; fast food diet (FFD)/TNFR1fl/fln = 19-23; Ctrl/TNFR1ΔHEPn = 11-12; FFD/TNFR1ΔHEPn = 19-24. Line shows mean + standard error of the mean. Significant differences are marked with (a) if P < 0.05. Ctrl: Standard chow.
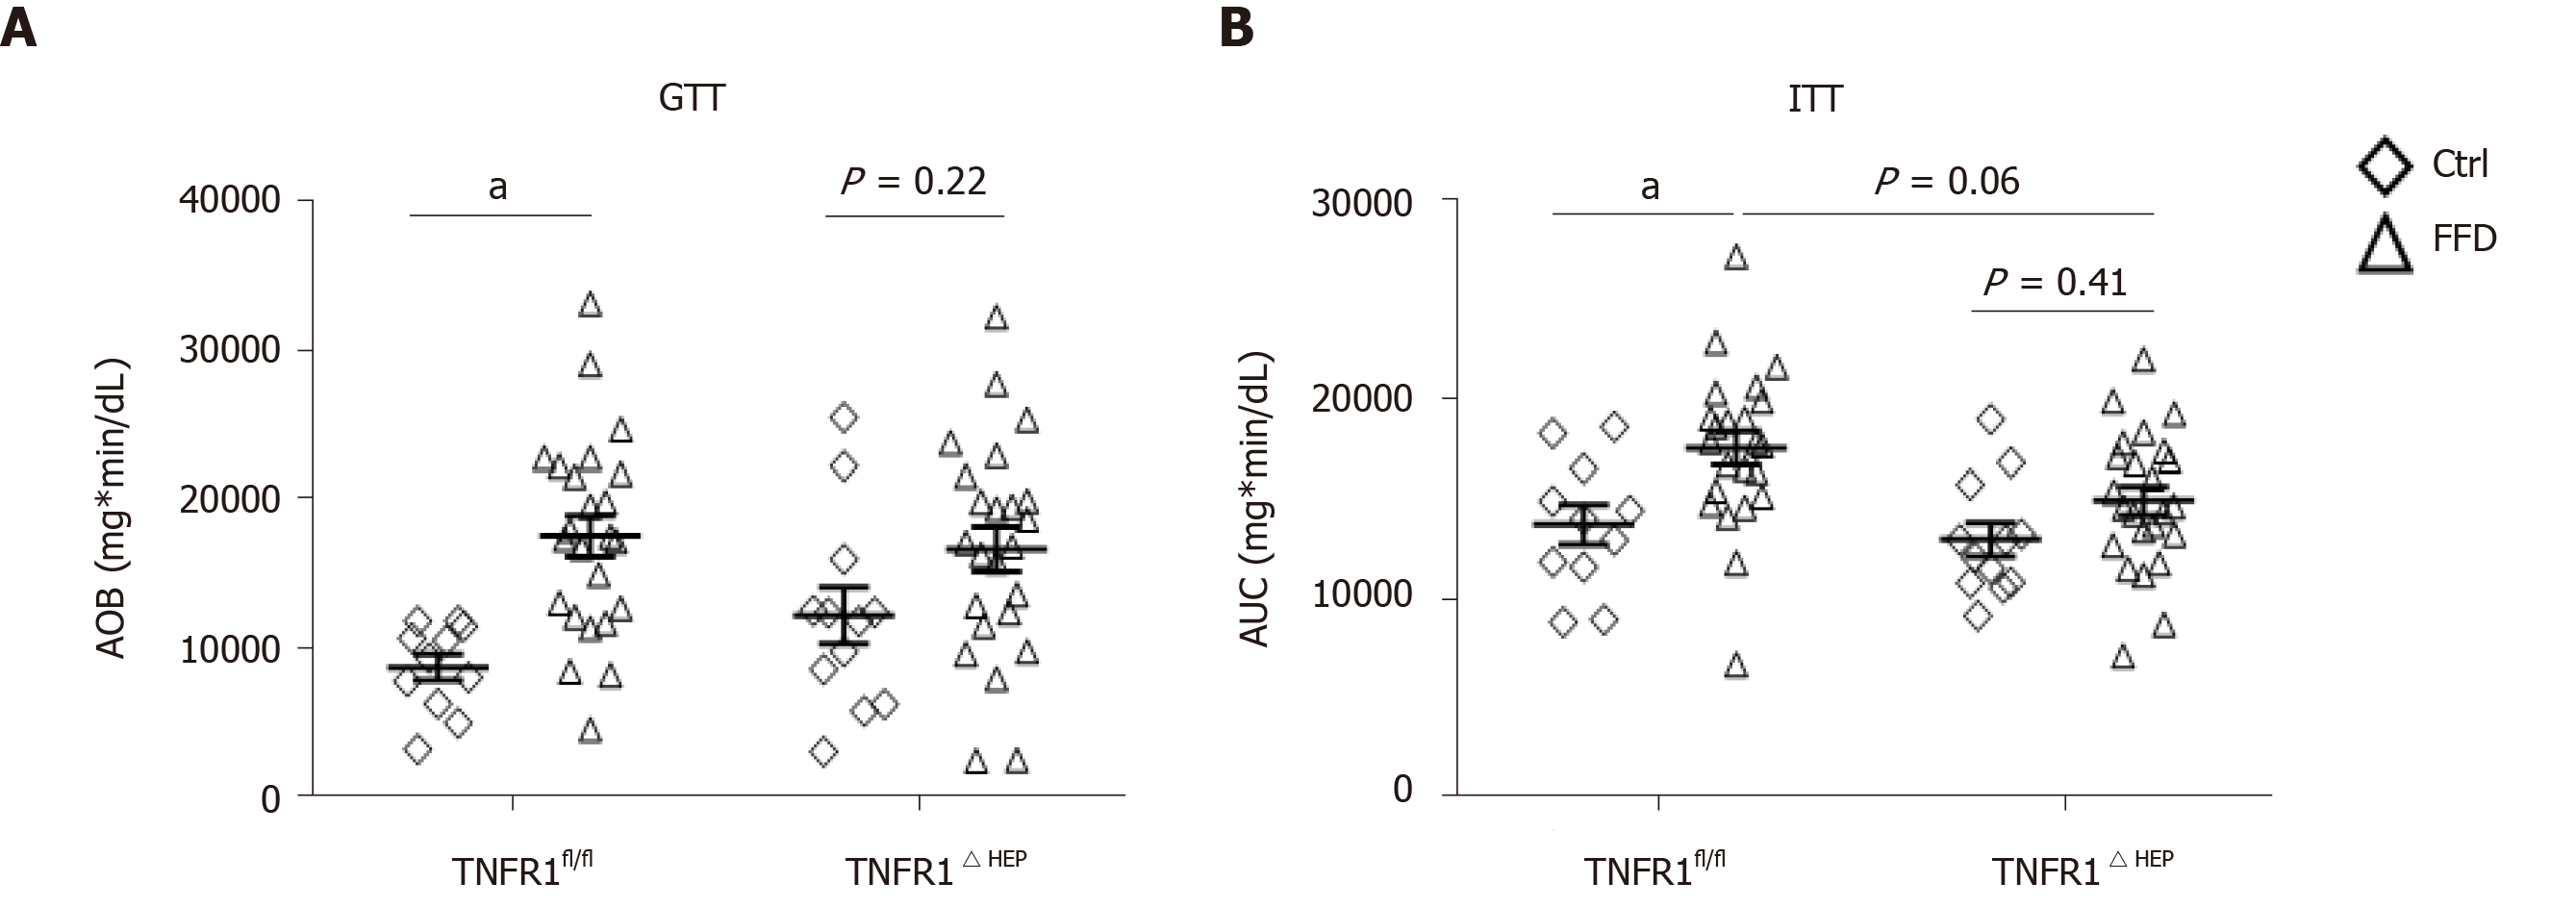
Figure 3 Effect of tumor necrosis factor alpha receptor 1 deficiency in hepatocytes on metabolic function.
A: Glucose tolerance test performed after 18 wk of feeding; B: Insulin tolerance test performed after 19 wk of feeding. Numbers of biological replicates: Ctrl/tumor necrosis factor alpha receptor 1-expressing littermates (TNFR1fl/fl) n = 11; fast food diet (FFD)/TNFR1fl/fln = 23-24; Ctrl/TNFR1ΔHEPn = 12; FFD/TNFR1ΔHEPn = 24. Line shows mean + standard error of the mean. Significant differences are marked with (a) if P < 0.05. Ctrl: Standard chow; GTT: Glucose tolerance test.
- Citation: Bluemel S, Wang Y, Lee S, Schnabl B. Tumor necrosis factor alpha receptor 1 deficiency in hepatocytes does not protect from non-alcoholic steatohepatitis, but attenuates insulin resistance in mice. World J Gastroenterol 2020; 26(33): 4933-4944
- URL: https://www.wjgnet.com/1007-9327/full/v26/i33/4933.htm
- DOI: https://dx.doi.org/10.3748/wjg.v26.i33.4933


