Copyright
©The Author(s) 2020.
World J Gastroenterol. Aug 28, 2020; 26(32): 4857-4865
Published online Aug 28, 2020. doi: 10.3748/wjg.v26.i32.4857
Published online Aug 28, 2020. doi: 10.3748/wjg.v26.i32.4857
Figure 1 Flowchart of patient selection.
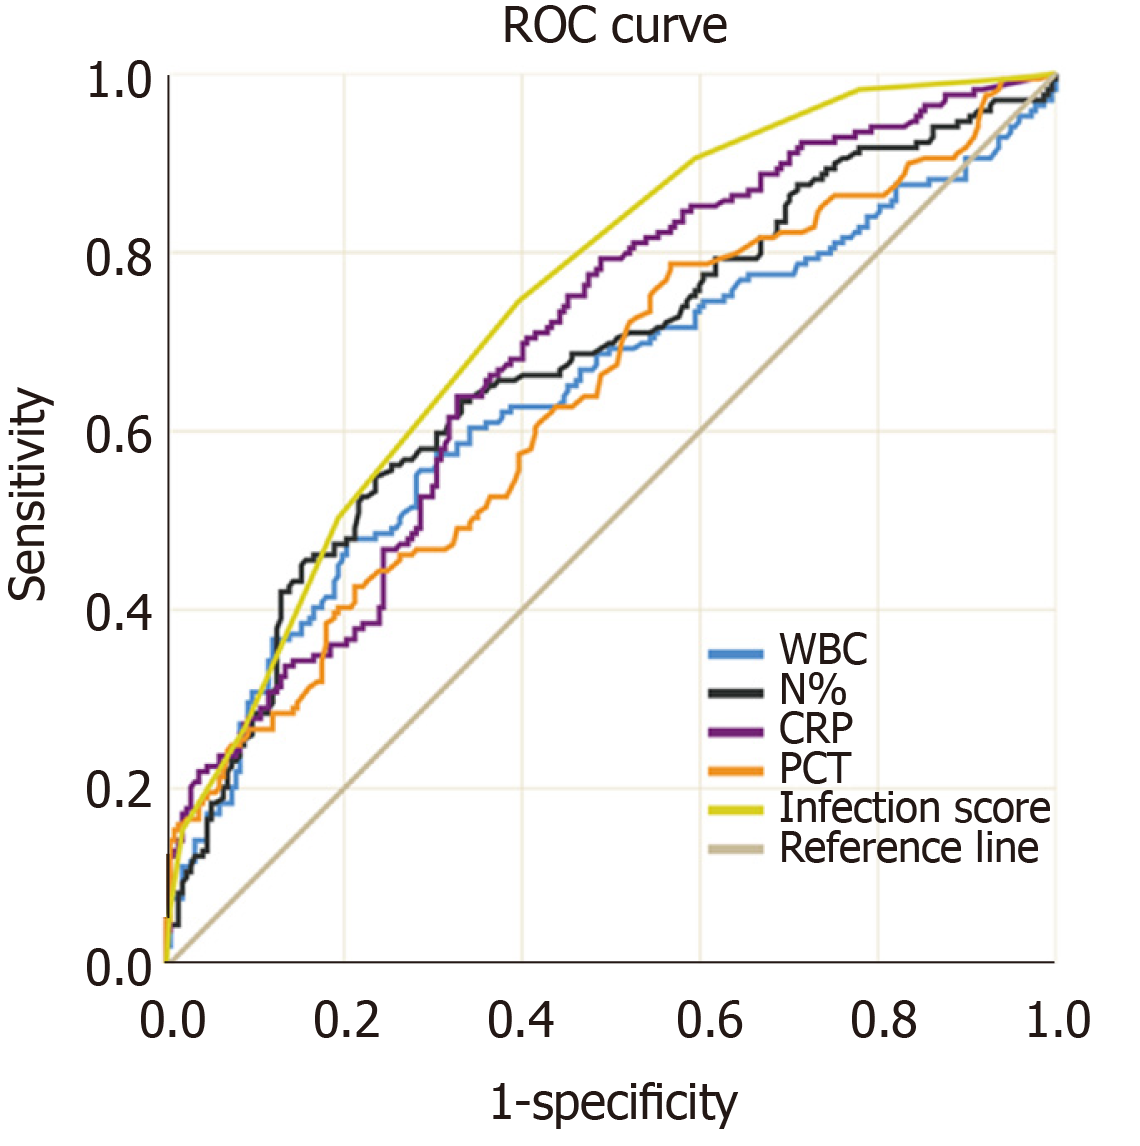
Figure 2 Receiver operating characteristic curves of procalcitonin, C-reactive protein, white blood cells, and proportion of neutrophils for the diagnosis of infections in acute-on-chronic liver failure.
ROC: Receiver operating characteristic curve; WBC: White blood cells; CRP: C-reactive protein; PCT: Procalcitonin; N%: Proportion of neutrophils.
- Citation: Lin S, Yan YY, Wu YL, Wang MF, Zhu YY, Wang XZ. Development of a novel score for the diagnosis of bacterial infection in patients with acute-on-chronic liver failure. World J Gastroenterol 2020; 26(32): 4857-4865
- URL: https://www.wjgnet.com/1007-9327/full/v26/i32/4857.htm
- DOI: https://dx.doi.org/10.3748/wjg.v26.i32.4857


